Abstract
Live fluorescence microscopy has the unique capability to probe dynamic processes, linking molecular components and their localization with function. A key goal of microscopy is to increase spatial and temporal resolution while simultaneously permitting identification of multiple specific components. We demonstrate a new microscope platform, OMX, that enables subsecond, multicolor four-dimensional data acquisition and also provides access to subdiffraction structured illumination imaging. Using this platform to image chromosome movement during a complete yeast cell cycle at one 3D image stack per second reveals an unexpected degree of photosensitivity of fluorophore-containing cells. To avoid perturbation of cell division, excitation levels had to be attenuated between 100 and 10,000× below the level normally used for imaging. We show that an image denoising algorithm that exploits redundancy in the image sequence over space and time allows recovery of biological information from the low light level noisy images while maintaining full cell viability with no fading.
Keywords: OMX, phototoxicity, image processing, denoising, yeast
The ability to collect live biological image information in three dimensions as a function of time, four-dimensional imaging, is a powerful use of optical microscopy. It has led to the discovery of new phenomena, and in combination with analysis of mutations or other perturbations, can link biological functions to molecular mechanisms. The dynamic information gained from four-dimensional data also allows the accurate measurement of quantitative physical parameters, such as diffusion constants or velocity of active movement.
Though a powerful technique, live fluorescence imaging imposes constraints, which can severely impede its use. Biological processes within a cell are sensitive to the excitation light used for fluorescence imaging (for a review, see ref. 1, chap. 19). This may be evidenced by a failure or delay of cell division, morphological changes, or perturbation of other biological processes. The phototoxicity resulting from excitation light is in part caused by the long-lived triplet state present in all fluorescent processes interacting with molecular oxygen, generating very reactive intermediates such as free radicals. High levels of free radicals kill cells (2). In addition, excitation light can damage the fluorochrome, leading to the well-known phenomenon of photobleaching. Both phototoxicity and bleaching are directly proportional to the excitation light intensity. In general, one reduces the excitation intensity to minimize the photodamage. However, this has the undesirable consequence of lowering the signal-to-noise ratio of the image, resulting in a dim and therefore noisy image. These two competing considerations make information retrieval from live image sequences a challenging problem.
Using a newly devised fast multidimensional image acquisition platform (OMX) (SI Text), we address here the problem of sample damage due to excitation light and demonstrate that reduction of excitation light by several orders of magnitude, in combination with the appropriate use of image denoising algorithms, can allowwdr informative four-dimensional imaging at previously impracticable rates without phototoxicity or fading.
Results
Preservation of Live Cell Viability Requires Reduction of Light Intensity.
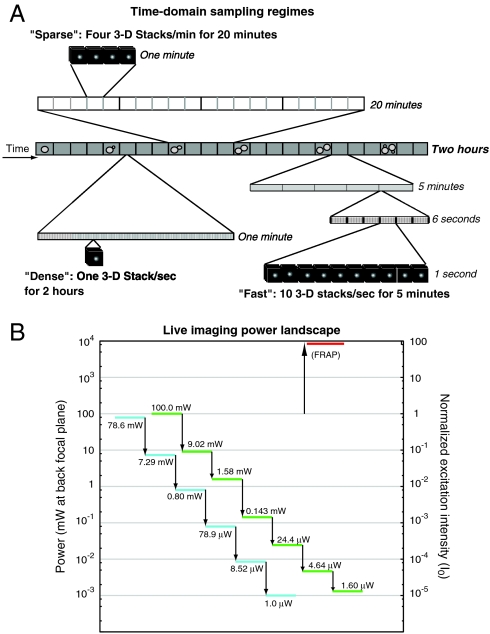
In the course of imaging experiments on yeast chromosome dynamics, we observed that yeast cells that had been imaged under what is normally considered to be a low-light dose failed to divide when left overnight, whereas their nonimaged neighbors divided normally. This prompted us to quantitatively measure the phototoxicity of our experiments. A yeast strain containing a Lac repressor::GFP fusion (YDB271) binding to a specific amplified Lac operator (3) was used to study phototoxicity during and after four-dimensional data collection. Three-dimensional images (25 Z sections) were acquired at 23 °C every 15 s over a period of 20 min, covering roughly 20% of a yeast cell cycle. This imaging regime is hereafter referred to as “sparse” (Fig. 1). Initially, we performed imaging under an excitation light intensity that resulted in an image intensity sufficient to allow direct automated tracking of the Lac repressor::GFP spots after deconvolution of the data. For these and subsequent experiments, this excitation intensity, 4.8 × 10⁻⁵ W/μm2, is referred to as I0, as shown in Fig. 1. Although cells imaged under these conditions showed no defects during the actual imaging period, they were observed the next day arrested with the large dumbbell shapes characteristic of lethal DNA damage (4). To assess the overall sensitivity of yeast to light intensity, four-dimensional images were collected in the same sparse regime at I0 and four lower light levels, reducing light intensity at each step by approximately a factor of ten (see Fig. 1, and in more detail in Table 1). After data collection at each excitation intensity, we monitored cell viability as described in Materials and Methods.
Fig. 1.
Overview of imaging conditions used in this study. (A) Sparse, dense, and fast time domain sampling regimes are shown to scale. (B) Power landscape showing the measured values of light intensity at the back focal plane for various attenuation values. Over 6 orders of magnitude of attenuation are possible. High-intensity light used for FRAP is shown at top right.
Table 1.
Viability in dense imaging regime
| Strain | W1588-4C | YDB271 | SO992a | SO992b |
| GFP: | None | GFP:LacI | None | GFP∶FYVEEEA1 |
| I = 1.0I0 | − | − | N/D | N/D |
| I = 0.1I0 | − | − | N/D | N/D |
| I = 10-2I0 | − | − | − | − |
| I = 10-3I0 | +* | − | + | − |
| I = 5 × 10⁻⁴I0 | + | +† | N/D | N/D |
| I = 10-4I0 | + | +‡ | + | + |
*Growth resumed after 3 h delay.
†Viable at exposures below 250 msec per second.
‡Insufficient signal to track spots.
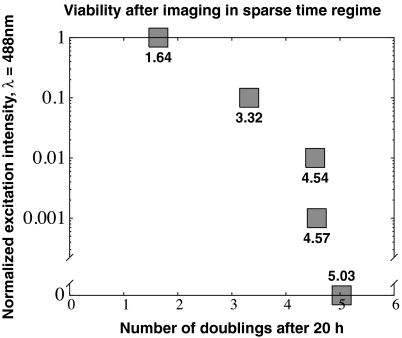
A plot of yeast viability as a function of excitation light intensity (Fig. 2) shows that the I0 excitation light arrests or kills the yeast cells with little or no cell division occurring after time-lapse data collection. The excitation light at I = 10-1I0, one log down, appears to arrest the cells at a checkpoint with a protruding bud for several hours (SI Text), after which they recover and eventually resume dividing. Only at excitation I = 10-2I0, two logs down in intensity, were the cells observed to divide normally compared to the no-excitation control. In summary, the yeast cells as a representative in vivo sample are very sensitive to excitation light, necessitating the reduction of normal excitation intensity by two orders of magnitude for unperturbed viability in the sparse imaging regime. The photon flux with 488 nm light at our I = 10-2I0, which just allows viability under sparse-regime image acquisition, is 480 nW/μm2- sec or 1.2 × 10¹² photons/μm2- sec. Under our standard experimental conditions of 10 msec exposure time in each of 25 Z sections, this translates into 3.0 × 10¹¹ photons/μm2 per 3D image. We measured typical light exposure of yeast under room light during the daytime at ∼1 pW/μm2, 5 orders of magnitude less than the light intensity that starts affecting viability. Therefore, the conditions of even low-light fluorescence imaging are significantly brighter in comparison to the unimaged state.
Fig. 2.
Viability measured 20 h after imaging in the sparse sampling regime. The number of cell doublings observed during a 20 h period as a function of excitation light intensity for the 20 min of imaging are shown. Normalized intensity values of 1 or 0.1 lead to decreased viability, whereas attenuation to 0.01 or below does not affect viability at this sampling regime.
Denoising Recovers Information from Dim Images.
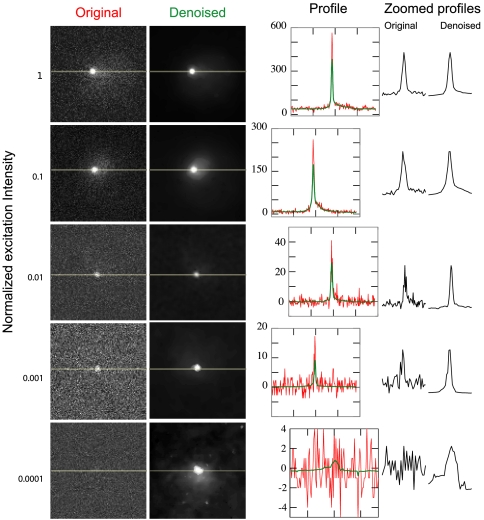
To preserve the ability of a cell to divide, the light intensity had to be reduced by at least two orders of magnitude in the sparse imaging regime. The consequence is that the images became very noisy (Fig. 3) and were no longer suitable for spatial or other quantitative analysis. When excitation light was reduced even further, the dominance of noise in the I = 10-4I0 series required time-averaging of the four-dimensional data even to be certain that cell image information was present. Maintaining both viability and sufficient image information is therefore a considerable technical hurdle in live imaging.
Fig. 3.
Denoising increases the signal-to-noise of low-light images. Single yeast cells are imaged at varying excitation intensities (Left); each row contains a different cell. Average projections of raw images are at left, and the projections of the denoised versions of the same images are at right. Intensity line profiles drawn through the images where indicated (yellow lines) are plotted at right. Profiles are superimposed in the graphs showing the number of counts (red = raw, green = denoised), and compared side-by-side in the zoomed profiles at far right. Zoomed profiles display the intensity of 35 pixels surrounding the center point, normalized to the same height for each profile.
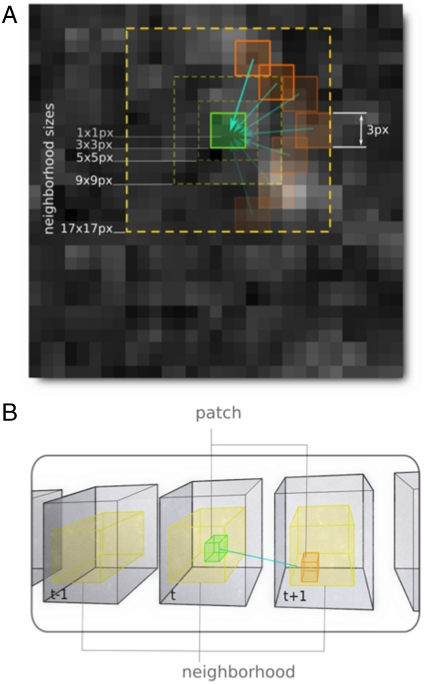
Remarkably, it is possible to computationally recover useful information from the extremely low-dose images without making any assumptions about sample structure. The approach is to use generalized denoising strategies that seek to remove statistical noise while preserving relevant sample intensity and spatial information. A promising denoising algorithm suitable for 2, 3, 4, and 5 (space, time, and wavelength) dimensional imaging has been recently published (5, 6) and implemented on several computer platforms. A diagram depicting the functioning of this algorithm is illustrated in Fig. 4. In essence, the denoising procedure typically first analyzes the image data for statistical signatures of Poisson and Gaussian noise originating from the limited number of photons (Poisson) and the dark current inherent to electronic imaging detectors (Gaussian). The overall strategy is to find regions of the image, which by virtue of similar statistical behavior, are likely to have the same underlying intensity distribution and then average them to reduce noise. The challenge is to correctly identify appropriate regions to average. More specifically, for each point of the image sequence, a set of pixels, termed a “patch,” of predefined size (e.g., 3 × 3 × 3 or 5 × 5 × 5 pixels) is considered. A local space and/or time neighborhood (a subset of the entire image centered on the current point) is scanned for patches showing similar intensity statistics. These patches are then averaged using weights defined as an increasing function of the similarity with the reference patch. This procedure is iterated several times, always averaging the original data but using the result of the previous step to perform patch comparisons. At each step, space-time neighborhoods are increased in size alternately in space and in time until a statistical control procedure (a “bias-variance” tradeoff) locally stops the growth in space or in time, whereas it may be continued in other locations of the image sequence. As a result, the shape of space-time neighborhoods used for denoising is locally adapted to the image content. Finally, the algorithm has been shown to preserve edges and image intensities over a wide variety of test cases (5, 6).
Fig. 4.
Diagram of the denoising procedure. (A) Illustration two-dimensional of N × N pixel patches used for comparisons. The center patch (green) is compared with all other same-sized patches (orange) within a certain neighborhood size (yellow). (B) Extension of this concept into three or four dimensions: patches at a given timepoint (green cube) are compared to other patches of the same size in the same and adjacent timepoints (orange), still within a certain neighborhood size (yellow).
We applied this denoising strategy to the images in Fig. 3. Inspection of the intensity series of images shows that the yeast fluorescent chromosome site is clearly visible even in the I = 10-4I0 series. Line plots through the center of the fluorescent chromosome site dramatically demonstrates the rescue of the cell image data from the noise. In addition, in many cases it is possible to find the outline of the cell, the boundaries of the nucleus, and possibly other cellular structures from the faint GFP background fluorescence once the noise has been removed (see Fig. 7). This is important as it indicates the ability to recover more general shapes and not just point-like objects. We conclude that denoising is a useful tool for studying live 3D structure at light excitation levels that preserve cell viability.
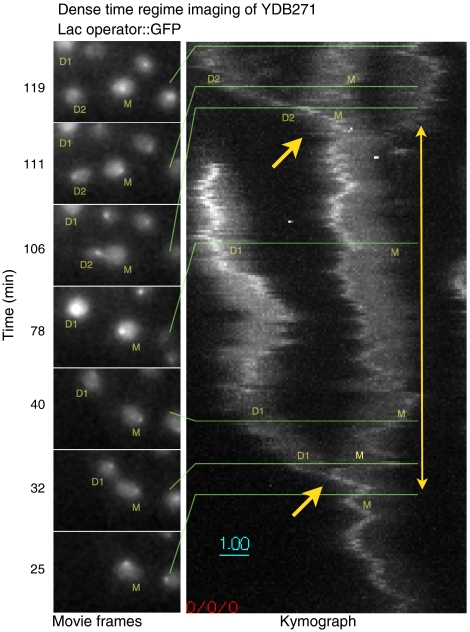
Fig. 7.
At low light levels (I = 5 × 10⁻⁴I0), dense-regime imaging can continue for 2 h, encompassing a whole cell cycle, without fading or loss of viability. The entire series is shown in the SI Text. At left, individual frames from the 2 h imaging sequence, centered on the original cell, are shown proceeding in time from bottom to top. YDB271 yeast cells are labeled M (original mother cell), D1 (first daughter cell), and D2 (second daughter cell). Right, a kymograph created by averaging the 3D stacks in 30 s groups, then projecting the maximum intensity of the time-averaged 3D stacks first along the Z axis, then along the Y axis. Cell divisions are indicated by single arrows; the two-headed arrow delimits an entire cell cycle of the mother cell.
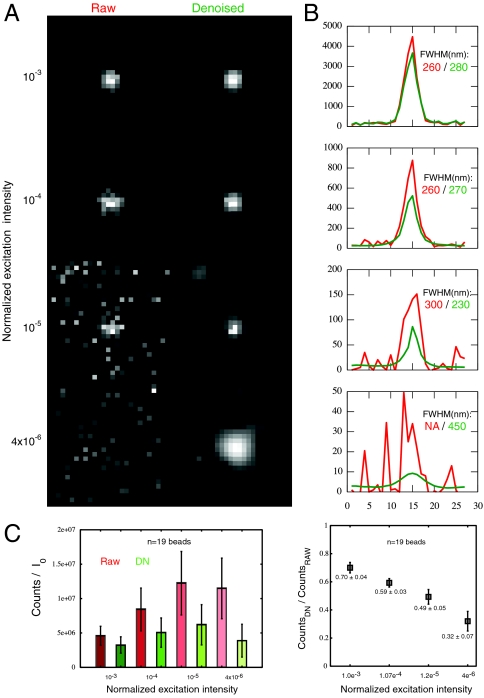
To test for possible distortion of image information by the denoising algorithm, 100 nm fluorescent beads were imaged in 3D at different levels of excitation intensity, and compared with and without denoising (Fig. 5). Inspection of the fluorescent signal’s full width at half maximum (FWHM) from I = 10-3I0 to I = 10-5I0 shows no significant difference. A slight broadening of the FWHM at I = 3 × 10⁻⁶I0 is seen, although the overall bell-shaped profile was unchanged, in contrast to the completely noise-dominated profile of the raw image. Peak intensity is largely preserved, but shows a slight reduction after denoising; the magnitude of the intensity decrease correlates with the amount of noise present. When corrected for excitation intensity, the measured intensity of the fluorescent bead signal after denoising (Fig. 5C) is level within error, but increases in inverse proportion to excitation in the absence of denoising, reflecting the fact that noise makes up a larger proportion of the recorded image at low excitation intensities. This gives reasonable confidence in quantitative image features after denoising.
Fig. 5.
Quantitation of denoising effects on low-light images of fluorescent latex beads. (A) The same bead is measured in 3D at four different excitation intensities (10-3I0, 10-4I0, 10-5I0, and 4 × 10⁻⁶I0). Single Z sections through the 3D stack are shown and analyzed. The raw images (Left) lose signal-to-noise as excitation intensity decreases, whereas this is mostly recovered in the denoised images (Right). (B) Line profiles through the beads demonstrate overall maintenance of peak width measured by Gaussian fitting, until the noisiest condition (bottom), in which the raw image does not give a fit at all, and the denoised image shows peak broadening. (C) Peak intensities corrected for excitation intensity display sensitivity to signal-to-noise ratio. A field of fluorescent beads was imaged 60 times, subjected to denoising, and both raw and denoised images were time-averaged to enable comparisons. (Left) Excitation-corrected raw peak intensities increase as excitation decreases, whereas denoised peak intensities are more stable. Error bars show variation (± 1 standard deviation) in individual bead intensities. (Right) Ratios of denoised to raw peak intensities are plotted as mean ± standard deviation (n = 19 fluorescent beads).
Reduction of Excitation Light Intensity Greatly Reduces Fading.
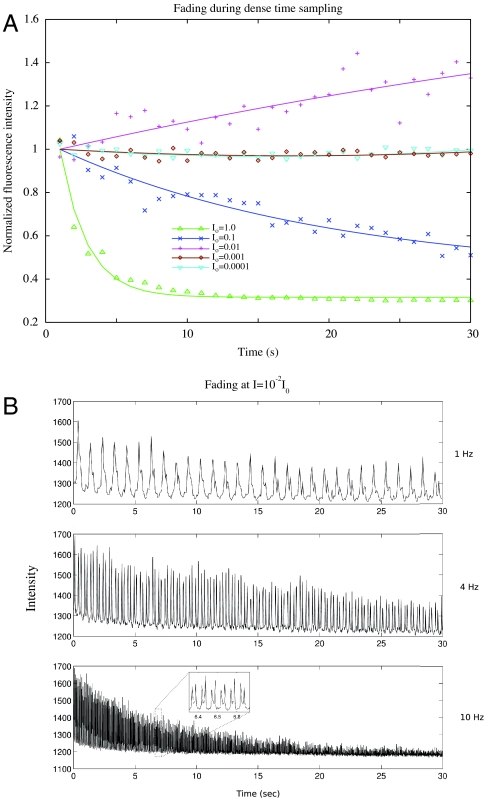
The use of low excitation light levels consistent with viability, made possible by denoising, benefits imaging in other areas as well. A major problem for all live time-lapse microscopy is fluorophore fading. Fluorescent molecules, both small molecule dyes and fluorescent proteins such as GFP, are susceptible to light-induced chemical alteration. In many cases only a few time points can be collected before the signal approaches the noise floor, or becomes swamped by autofluorescence. Computational bleach correction can retain the brightness, but this cannot prevent the loss of signal to noise, and eventually extracting quantitative information becomes impossible. Fading can be eliminated, however, by reducing the excitation light. A time-lapse intensity series (from Fig. 3) displays reduced bleaching curves as the excitation intensity is progressively reduced to I = 10-4I0 as seen in Fig. 6A. The I0 curve fades very quickly into the noise, and even the I = 10-1I0 series falls off rapidly. The signal at I = 10-2I0 increases slightly, possibly due to weak photoactivation of EGFP (7), and the emission levels at I = 10-3I0 and I = 10-4I0 are essentially unchanging as a function of time, indicating a negligible amount of fading.
Fig. 6.
Fading plots of Lac repressor::GFP foci during dense time sampling. (Upper) Yeast cells are imaged at five successively lower excitation levels, and peak intensities in each 3D stack, normalized to the intensity at the first timepoint, are plotted as a function of time. Photobleaching is visible at both I = I0 and I = 10-1I0. At I = 10-2I0, intensity is seen to increase, which may be due to weak photoactivation of GFP. Lower intensities remain flat for the entire 30s of imaging. (Lower) Fading increases at a given intensity level (I = 10-2I0) as the rate of imaging increases. In total, the samples receive 3.9 s of excitation at 1 Hz, 12 s of excitation at 4 Hz, and 23.7 s of excitation at 10 Hz.
Fast Four-Dimensional Live Imaging and Fading Trade-Offs.
A major goal of the OMX microscope is very fast live four-dimensional image collection. This capability is documented in Fig. 6B for yeast strain YDB271. Four-dimensional images were collected with a 10 msec exposure time in one stack of 13 sections, four stacks of 10 sections, or ten stacks of 8 sections, every second for 30 s (Fig. 6B) at an excitation light intensity of I = 10-2I0 that was previously shown to be compatible with complete long-term viability in the sparse imaging regime. As the rate of three-dimensional imaging is increased, the samples receive more total light over the 30 s interval: 3.9 s of excitation at 1 Hz, 12 s of excitation at 4 Hz, and 23.7 s of excitation at 10 Hz. Fading therefore occurs to a greater extent for the faster time series, a serious problem for in vivo imaging of rapid processes. If no fading at all is desired, it is necessary to reduce the excitation light intensity to I = 10-3I0 or lower. Even in cases of fading, denoising allows the image information to be recovered well into the fading region (see SI Text), whereas without denoising, the information is buried in the noise at the end of the fast data collection.
Because excitation intensity, density of time sampling, fading and cell viability are interconnected, we analyzed cell division (as an assay for cell viability) as a function of intensity. To capture at least one yeast cell cycle at 30 °C (estimated to be approximately 90 min), we extended the time length for four-dimensional data collection to 2 h. We recorded one three-dimensional image (6 μm stack height at 0.25 μm spacing) per second, in the time-lapse regime we term “dense” (Fig. 1). The results are summarized in Table 1. The yeast LacI/O GFP sample (strain YDB271) had no cell divisions in the dense regime at I = 10-3I0 or greater. At I = 5 × 10⁻⁴I0 (or lower) the three-dimensional data (at one 3D stack/sec) for the full 2 h showed unperturbed cell divisions (as well as no fading). A control strain (W1588-4C) with no GFP, also imaged at one 3D image/second for 2 h, failed to undergo cell division at I = 10-2I0. Even at I = 10-3I0, the control strain took approximately 3 h to resume normal cell division and growth after the 2 h data collection, presumably reflecting a repair-induced delay.
Another yeast strain (strain SO992), containing a GFP fusion to FYVEEEA1, an endocytic pathway component, (8) was similarly imaged (SI Text). At I = 10-3I0, this strain did not divide after 2 h of dense data collection, indicating phototoxicity. An isogenic control with no GFP did not divide at I = 10-2I0 but did divide at I = 10-3I0 intensity, similar to the LacI/O control (strain W1588-4C). Because the strain without GFP can tolerate more excitation light than the strain with GFP, and the strains are otherwise isogenic, the interaction between light and GFP itself may be responsible for the increase in phototoxicity. However, even strains without GFP are sensitive to excitation light.
Given the capability to image at low light levels in the dense time regime, it became possible to image an entire cell cycle in yeast at a rate of one 3D image per second. Whereas strain YDB271 was completely viable at I = 10-4I0, the images obtained after denoising did not allow us to reliably detect spots at every single timepoint. We therefore tested viability at the intermediate level of I = 5 × 10⁻⁴I0 (Fig. 7). To maintain full viability at this higher intensity level, we found that the exposure time had to be reduced to a total of 160 msec out of each second over a 2 h period. This meant that we could not collect Z stacks divided into 25 sections every 0.25 μm as before, as this would require exposing the sample to excitation light for 250 msec out of every second. To record an entire 6 μm stack in this short of a timespan required the use of stereoscopic projection imaging (see SI Text). In projection imaging, the stage is swept through the Z stack during the entire time in which the shutter is open, 80 msec in this case. Two such stage sweeps are performed every second: the first moving the stage up, and the second moving the stage both down and 2.5 μm to the right. After this second image, the stage is moved 2.5 μm back to the left. LacI::GFP foci are computationally detected in the resulting images and Gaussian profiles are fit to their centers with subpixel accuracy. The disparity in position along the X-axis (stereoscopic parallax) between every pair of points taken at successive time intervals is then used to calculate the Z position of the focus. Fig. 7 shows individual projection images taken at this speed and the entire time series depicted as a kymograph. Intensity plots as function of time (SI Text) show no discernable fading at this intensity level during dense time domain imaging. In the kymograph, the intensity of the brightest point can be seen to increase during the cell cycle, indicating DNA synthesis during S phase and recruitment of more LacI::GFP protein to the Lac operator array.
Because of the fast dynamics of chromosome movement in living cells (9), it is desirable to collect several 3D images per second. We therefore wished to test the viability of yeast under such extremely fast imaging conditions, in which the excitation light is activated for almost the entire imaging period. To test this, strain YDB271 was imaged at I = 10-3I0 for 5 min (at 30 °C) with a time domain sampling increased to 10 three-dimensional data stacks/sec (defined as “fast;” see Fig. 1). With a 10 msec exposure time and single images captured at 91 Hz, the sample is exposed to excitation light for over 90% of the entire imaging process. After data collection, the sample showed no delay or lack of cell division, suggesting little photon damage at this fast speed for this brief time period.
In summary, using low excitation light levels and denoising on the OMX platform makes it possible to image fluorescent reporters at dense (1 3D stack/sec) temporal resolution over an entire cell cycle or more, at full viability as monitored by cell division, with the resulting images suitable for quantitative analysis.
Fast Live Four-Dimensional Data and Denoising in General.
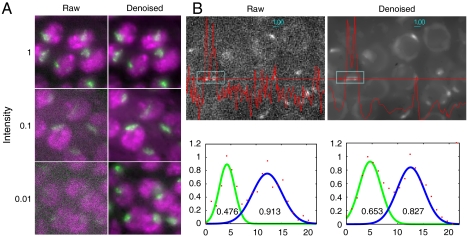
To ascertain whether denoising was applicable to only point-like data, or is generally applicable to many kinds of biological samples, we studied two additional systems. The first example is a GFP fusion to the Drosophila male differentiation pathway X chromosome specific complex component MSL3 (10), kindly provided by Mitzi Kuroda. It specifically binds the X chromosome at all points in the cell cycle. The rest of the chromosomes are visualized by a red fluorescent protein (RFP) fusion to histone variant H2AvD. As seen in Fig. 8A, reduction of the excitation light intensity by a factor of 10 or 100 gives rise to very noisy data, but denoising recovers the biological information for the two labels.
Fig. 8.
Denoising applied to more complex images. (A) Larval nuclei of Drosophila melanogaster imaged simultaneously in two wavelengths. All chromosomes are labeled with a histone H2AvD::RFP fusion (shown in magenta), and the euchromatic half of the X chromosome is labeled with a GFP::MSL3 fusion (shown in green). The demarcation between the two signals is retained to a much greater degree in the denoised series, compared to the raw images. (B) Meiotic nuclei of C. elegans containing a GFP fusion to ZYG12, localizing to the outer nuclear envelope and to patches at the pairing center ends of chromosomes. Denoising results in a smoother line profile (red line) and clear demarcation of nuclear boundaries. Profiles of the two ZYG12::GFP patches in the inset box are fit to Gaussian distributions (Lower); numbers within the graphs display the full width at half maximum intensity.
The second example (Fig. 8B) is a fusion of GFP to ZYG-12 (11), important for centrosome attachment to the nucleus, and chromosome movement in meiotic prophase, in a live Caenorhabditis elegans worm. The original image is very noisy, whereas denoising recovers several image features. In particular, foci of ZYG-12 are clearly distinguishable against the background in the denoised images, and can be tracked in three dimensions. A line profile through two patches (Left) displays the retention of image intensity after denoising. The peak widths are changed slightly (the left peak is broadened, the right is narrowed).
Discussion
Live imaging, the centerpiece of modern optical microscopy, requires a number of components to come together to work effectively. The samples must be unperturbed by the excitation light; little or no photobleaching should occur; the specifically labeled biomolecules must be discernable from the imaging noise, and finally the imaging hardware must be able to acquire the time sampled three-dimensional data at a fast (in principle oversampled) rate, ideally at multiple simultaneous wavelengths. This paper documents that all these components have come together to accomplish live imaging in a general fashion.
One of the main challenges of live fluorescence imaging is to avoid phototoxicity in the cells under observation, while at the same time obtaining enough emitted light to generate informative images from the raw CCD data. To avoid studying a system that is perturbed by photodamage, live imaging requires careful consideration of the dose (intensity and total time) of excitation light. For example, certain techniques, such as fluorescence recovery after photobleaching (FRAP), employ very intense light, approximately two orders of magnitude above our maximum I0, four orders of magnitude above the cutoff for viability in the sparse regime of I = 10-2I0, and six orders of magnitude above the cutoff for imaging a whole cell cycle in the dense regime of I = 5 × 10⁻⁴I0. The potential for severe phototoxicity suggests that every live imaging study, regardless of the technique used, should contain controls for viability, preferably one that includes cell division.
Whereas it is likely that different cell types will differ in their sensitivity to excitation light intensity, we chose the LacI/LacO system in yeast as a representative live GFP fluorescent biological sample whose fast division time and ease of imaging facilitates the observation of phototoxicity. Our conditions for successful imaging were (1) the ability to track in three dimensions the center of the signal obtained from the GFP::Lac repressor fusion, and (2) the unperturbed viability of the cells, compared to nearby nonimaged cells, after imaging. For cells that take much longer to divide or do not divide at all, other controls must be devised.
The level of excitation required to detect fluorescence signals depends on the sensitivity and the efficiency of the imaging system, on the fluorophore density, and most strongly on the number of fluorescence photons emitted at each exposure. In a fully viable yeast OMX high-resolution imaging experiment in the dense regime, with an objective of NA = 1.4, the number of EGFP per point spread function (PSF) volume is approximately 30 (see SI Text), and the most intense exposure that can be used is I = 5 × 10⁻⁴I0 for 10 msec. With this low light condition, the number of photoelectrons generated per electron multiplying charge coupled device (EMCCD) pixel is 5 (12), with a signal-to-noise ratio of 1.6 (see SI Text). To overcome this low S/N problem, the denoising algorithm assembles the signal from the resolution limited spot of 3 × 3 pixels, effectively reaching a signal-to-noise ratio of 4.8 enough to computationally boost the signal beyond the noise floor to reconstruct the true image.
Whereas this study emphasized cell division as a viability assay, for numerous reasons many biological systems are not amenable to this test. A number of other assays, such as quantitative measurement of the unperturbed long-term motility of biomolecules, or detection of indicators of damage such as DNA repair enzymes, can be used in addition (1). The amount of light reduction will in most cases be a compromise between signal recovery and phototoxicity. There are potentially two viability-enhancing strategies: (1) reducing excitation light, and (2) protecting the cell from light. One may be able to reduce phototoxicity by increasing expression of free radical scavenging enzymes, or targeting them to the nucleus, for example. Other methods could include removing oxygen from the environment of cells that do not require it, or adding high concentrations of molecules that react with singlet oxygen to form harmless species that do not interfere with fluorescence.
The denoising method dramatically recovers biological image information from the noisy images taken at low excitation light intensity. Whereas we could attenuate to I = 10-4I0 and still recover some information from our yeast GFP samples, it may be possible to even go down one order of magnitude more, depending on the brightness of the signal. The lower light intensities used in this study, combined with the particular GFP system under observation, approaches the limits of the denoising algorithm’s ability to retrieve information.
The lack of fading over long time periods made possible by low excitation light is a crucial step forward for fast 4D imaging, because the data are of a constant signal-to-noise level from the beginning to the end of the imaging period. This allows reliable measurement of dynamic information across long time spans, such as throughout an entire cell cycle. The observation of the two-fold increase in intensity in the LacI::GFP signal during the cell cycle in Fig. 7, reflecting the synthesis of DNA and recruitment of new protein, is an example of the kind of imaging result only possible with low excitation light that does not cause fading.
The ability to track the dynamic behavior of subcellular components at high temporal resolution through an entire cell cycle is an important facet of live imaging for many reasons. Rare events that may only occur once per cell cycle will always be captured, and biologically relevant differences in movement as a function of the cell cycle are possible to discern. Another advantage is that instead of starting and stopping at arbitrary points, the trajectory of the signal throughout an entire cell cycle is available for analysis. The unbiased nature of the dense imaging regime allows true comparisons of dynamics between one cell and another without needing to artificially synchronize them; instead, trajectories can be registered with each other at a defined timepoint (such as the separation of two fluorescent signals at anaphase).
Whereas we have performed these experiments on a single microscope system (OMX), the question is raised whether the relationship between excitation power and sensitivity would hold on other microscopes. A careful study of 100 nm fluorescent beads in both OMX and a DeltaVision microscope showed that the detected fluorescence counts per watt of excitation light were within 6.7% of each other, thus demonstrating the equivalent sensitivity and light throughput of both systems. Most modern microscopy systems have excellent light throughput and are not likely to appreciably vary from each other; therefore, our results are likely to be generalizable to all in vivo imaging. We have demonstrated here that fast imaging of live cells involves a surprising amount of phototoxicity, but that with the proper image processing algorithms, excitation light may be attenuated in compensation, and useful information can be retrieved.
Materials and Methods
Strains.
Yeast.
YDB271 ho HMLα hmlprox::lacO(256)-LEU2 MATa HMRα-BamHI ura3 ade1 ade3::GAL::HO leu2 trp1:hisG ura3-52 Spc29-RFP-(kan::Ca-URA3-MX) HIS3::URA3pro::lacI-GFP-(KAN)
W1588-4C MATa ade2-1 trp1-1 can1-100 leu2-3,112 his3-11,15 ura3-1 ssd1-d2 RAD5 bud4 ybp1-1 [psi+]
SO992a MATa far1 bar1::Kan sk2 gal2 sjl1::TRP1
SO992b MATa far1 bar1::Kan sk2 gal2 sjl1::TRP1 GFP:FYVEGFP∶FYVEEEA1
Drosophila.
Imaged fly tissue genotype: msl3::GFP, H2AvD::mRFP/CyO; msl3::GFP C. elegans. ZYG-12::GFP worms were strain WH223: ojIs9 [zyg-12ABC::GFP unc-119(ed3)]; unc119(ed3)
OMX Microscope.
See SI Text for a complete description of the microscope and its operation.
Data Acquisition.
Cells were grown overnight in synthetic + dextrose (SD) medium (yeast minimal medium + glucose) at 30 °C in 5 mL cultures on a rotary shaker. SD medium with 2% agarose was liquified in a microwave and poured into a glass-bottomed Petri dish (Bioptechs Delta-T) to a depth of 5 mm. The bottom of the dish is coated with indium tin oxide, allowing heat to be generated by the application of current. Solidified agarose pads were removed from the dishes; 10 μL of cells were placed in the center of the dish, and covered with the pads. Dishes were placed on the OMX microscope via a custom-built adaptor connected to a power source (Bioptechs, Inc) that provided a current to keep the dish at 30 °C. The objective used for imaging was kept constantly heated to 30 °C by a thermal ribbon and microcontroller (Minco, Inc) using a custom-built copper collar, 3 mm thick, coupling the thermal ribbon to the objective. Cells were imaged with room light only for the initial 30 min, to distinguish growing from nongrowing cells by the appearance of a bud. The positions of newly budded cells were saved in the microscope control program, and random subsets of these cells were selected for imaging. For bead imaging, 100 nm red-emitting fluorescent latex beads (Molecular Probes, Inc) were diluted 1∶10,000 in ethanol. A 1 μL drop of diluted beads was placed in the center of a plasma-cleaned coverslip, allowed to spread out and air-dry, then mounted on a slide with 5 μL of glycerol. Laser light at 488 nm and 532 nm was used for excitation of yeast cells and fluorescent latex beads, respectively. Images were acquired on Andor iXon EMCCD cameras set at their highest gain level. Dark current was calculated by averaging 512 frames taken with no excitation light, and subtracted from images before further processing.
Viability Measurement.
After fluorescent imaging was completed, the dish containing the cells was retained in position on the microscope for overnight monitoring with brightfield imaging using ambient room light. Three-dimensional brightfield images were acquired every 30 s or 5 min for 12 or more hours during the overnight period, to measure cell division. Maximum-intensity projection images of these images were assembled into movies (see SI Text) and visually inspected to assess viability.
Image Processing.
4D datasets were processed with the denoising algorithm “ndsafir” (5) modified to accept files in our data format. The command typically used was: ndsafir_priism $INFILE $OUTFILE -sampling=2 -iter=5 -p=3 -noise=gaussian -adapt=0 -island=4 -usetmp , indicating the patches are calculated every 2 pixels, the number of iterations (increasing the patch size) was set to 5, the initial patch size was set at 3 pixels, the noise model was presumed to be Gaussian, the adaptivity parameter was set at 0, the island threshold parameter was set at 4, and intermediate steps were saved as temporary files. For point tracking, the FindPoints program of the Priism software suite (http://msg.ucsf.edu/IVE) was used. 3D Gaussian fitting was performed on detected peaks using a search box of 5 × 5 × 3 pixels in X, Y, and Z. For 2D projection imaging, Gaussian peaks were located in each pair of images; the X coordinate distance between peak pairs, multiplied by the ratio between the Z and X stage movements, was used as the inferred Z coordinate.
Supplementary Material
Acknowledgments.
We thank Mitzi Kuroda and T. Sural for providing the Drosophila strain, Abby Dernburg for providing the C. elegans strain, Wendell Lim and Jessica Walter for providing yeast strain SO992, Yuri Strukov for providing and imaging the Drosophila sample preparation, Eric Branlund for technical support and advice, and Jason Swedlow and Orion Weiner for comments on the manuscript.
Footnotes
This article is part of the special series of Inaugural Articles by members of the National Academy of Sciences elected in 2009.
The authors declare no conflict of interest.
This article is a PNAS Direct Submission.
See Commentary on page 16005.
This article contains supporting information online at www.pnas.org/lookup/suppl/doi:10.1073/pnas.1004037107/-/DCSupplemental.
References
- 1.Pawley JB. Handbook of Biological Confocal Microscopy. 2nd Ed. New York: Plenum; 2006. [Google Scholar]
- 2.Jamieson DJ. Oxidative stress responses of the yeast Saccharomyces cerevisiae. Yeast. 1998;14:1511–1527. doi: 10.1002/(SICI)1097-0061(199812)14:16<1511::AID-YEA356>3.0.CO;2-S. [DOI] [PubMed] [Google Scholar]
- 3.Straight AF, et al. GFP tagging of budding yeast chromosomes reveals that protein–protein interactions can mediate sister chromatid cohesion. Curr Biol. 1996;6:1599–1608. doi: 10.1016/s0960-9822(02)70783-5. [DOI] [PubMed] [Google Scholar]
- 4.Weinert TA, Hartwell LH. The RAD9 gene controls the cell cycle response to DNA damage in Saccharomyces cerevisiae. Science. 1988;241:317–322. doi: 10.1126/science.3291120. [DOI] [PubMed] [Google Scholar]
- 5.Boulanger J, Kervrann C, Bouthemy P. Space-time adaptation for patch-based image sequence restoration. IEEE T Pattern Anal. 2007;29:1096–1102. doi: 10.1109/TPAMI.2007.1064. [DOI] [PubMed] [Google Scholar]
- 6.Boulanger J, et al. Patch-based nonlocal functional for denoising fluorescence microscopy image sequences. IEEE T Med Imaging. 2010;29:442–454. doi: 10.1109/TMI.2009.2033991. [DOI] [PubMed] [Google Scholar]
- 7.Yokoe H, Meyer T. Spatial dynamics of GFP-tagged proteins investigated by local fluorescence enhancement. Nat Biotechnol. 1996;14:1252–1256. doi: 10.1038/nbt1096-1252. [DOI] [PubMed] [Google Scholar]
- 8.Burd C, Emr S. Phosphatidylinositol(3)-phosphate signaling mediated by specific binding to RING FYVE domains. Mol Cell. 1998;2:157–162. doi: 10.1016/s1097-2765(00)80125-2. [DOI] [PubMed] [Google Scholar]
- 9.Marshall W, et al. Interphase chromosomes undergo constrained diffusional motion in living cells. Curr Biol. 1997;7:930–939. doi: 10.1016/s0960-9822(06)00412-x. [DOI] [PubMed] [Google Scholar]
- 10.Gorman M, Franke A, Baker BS. Molecular characterization of the male-specific lethal-3 gene and investigations of the regulation of dosage compensation in Drosophila. Development. 1995;121:463–475. doi: 10.1242/dev.121.2.463. [DOI] [PubMed] [Google Scholar]
- 11.Malone CJ, et al. The C. elegans hook protein, ZYG-12, mediates the essential attachment between the centrosome and nucleus. Cell. 2003;115:825–836. doi: 10.1016/s0092-8674(03)00985-1. [DOI] [PubMed] [Google Scholar]
- 12.Shaner NC, Steinbach PA, Tsien RY. A guide to choosing fluorescent proteins. Nat Methods. 2005;2:905–909. doi: 10.1038/nmeth819. [DOI] [PubMed] [Google Scholar]
Associated Data
This section collects any data citations, data availability statements, or supplementary materials included in this article.


