

Abstract
Our laboratory has reported that manipulations that provoke a robust sodium appetite [e.g., sodium depletion, deoxycorticosterone acetate (DOCA)] decrease lateral hypothalamic self-stimulation (LHSS) reward if rats are denied access to hypertonic saline solutions. The following studies investigated the interaction between chronic sodium appetite and the renin-angiotensin-aldosterone system on LHSS reward. In Experiment 1, animals treated with the diuretic furosemide (FURO; 20 mg/kg) when denied access to saline exhibited an increase in the current required to produce 50% of the maximum LHSS response rate (ECu50) 48 hours after extracellular volume depletion. FURO-depleted rats that were allowed to drink 0.3 M saline after depletion, or that were treated with the selective mineralocorticoid receptor (MR) antagonist spironolactone, which significantly reduced sodium appetite, did not show ECu50 changes. In Experiment 2 chronic intracerebroventricular administration of the selective MR antagonist RU 28318 (10 μg/μl/hr) prevented decreases in the ECu50 induced by DOCA-no salt treatment. We conclude that an unresolved sodium appetite will reduce responding for rewards and that experimental manipulations that reduce sodium appetite (e.g., access to saline or blockade of MR) decrease hedonic deficits.
Keywords: reward, anhedonia, depression, sodium, intracranial self-stimulation
Introduction
The renin-angiotensin-aldosterone system (RAAS) has peripheral and central actions that are consistent with the defense of body water and sodium homeostasis (e.g., vasoconstriction, sodium and water retention, thirst and sodium appetite) when these regulated variables are depleted. Although excitation of the RAAS is adaptive in combating disruption of fluid homeostasis, prolonged elevations of angiotensin (ANG) II or mineralocorticoid hormones (MC) are known to have adverse effects on the heart, kidneys, brain, and vasculature (Burniston, Saini, Tan, & Goldspink, 2005a; Burniston, Saini, Tan, & Goldspink, 2005b; Jin et al., 2006; Pietranera, Saravia, Gonzalez Deniselle, Roig, Lima, & De Nicola, 2006; Struthers & MacDonald, 2004). Prolonged excitation of the RAAS is observed in various pathological states (e.g., heart failure, Conn’s disease), and the system can contribute to the deleterious progression and consequences of these states (Connell, Fraser, & Davies, 2001; Rocha & Funder, 2002; Struthers & MacDonald, 2004). Experimental attention has been devoted to the damaging physiological effects of prolonged high activity of the RAAS, however with the exception of thirst and sodium appetite, very little is known of the behavioral or psychological effects of chronic RAAS excitation or persistent body fluid disruption.
Patients with major depression exhibit increased plasma levels of the MC aldosterone (ALDO), without an increase in plasma renin activity (PRA) (Emanuele, Geroldi, Minoretti, Coen, & Politi, 2005; Murck, Held, Ziegenbein, Kunzel, Koch, & Steiger, 2003). A pharmacologically validated animal model of depression, the chronic mild stress model, also is accompanied by increased ALDO levels in rats showing depressive-like behaviors (Grippo, Francis, Beltz, Felder, & Johnson, 2005). Moreover, there are several diseases that present with body fluid homeostatic disturbances and/or increased activity of components of the RAAS that are accompanied by a greater incidence of depression [e.g., congestive heart failure, Conn’s syndrome; (Johnson & Grippo, 2006; Joynt, Whellan, & O’Connor, 2003; Khurshid & Weaver, 2005; Malinow & Lion, 1979)]. It is plausible that the effects those pathologies have on body fluid and sodium balance are related to their impact on affective states.
Studies from different research groups have investigated the effects of treatments which induce salt hunger on brain reward mechanisms. Our laboratory has shown that treatment with the MC receptor (MR) agonist deoxycorticosterone acetate (DOCA) or the diuretic furosemide (FURO), both of which provoke a robust sodium appetite, induce a decreased responsiveness to rewarding stimuli (i.e., anhedonia, which is a primary symptom of major depression in humans) if the animals are not given access to saline for drinking (Grippo, Moffitt, Beltz, & Johnson, 2006; Morris, Na, Grippo, & Johnson, 2006). Although Conover and colleagues (1994) did not observe that FURO-induced sodium depletion altered responding for lateral hypothalamic self-stimulation (LHSS), these investigators did find that 0.15 M saline in the sodium deficient state was selected in a choice test where the rewarding brain stimulation was the alternative.
The following experiments tested the hypothesis that blockade of RAAS signaling will prevent the hedonic disturbances that result from an unresolved sodium appetite. Sodium appetite was induced using either FURO-induced sodium depletion or DOCA injections (Na, Morris, Johnson, Beltz, & Johnson, 2007; Sakai, Nicolaidis, & Epstein, 1986; Wolf, 1965). Three antagonists for the RAAS, the angiotensin converting enzyme inhibitor captopril (CAP), and the selective MR antagonists RU 28318 and spironolactone (SPIRO), were used to determine the efficacy of RAAS blockade in preventing FURO- and DOCA-induced decreases in responding for LHSS reward. Additional experiments addressed the effects of these drugs on sodium appetite and thirst, plasma ALDO and PRA, and plasma and urinary Na+ and K+.
General Methods
Animals
Male Sprague-Dawley rats weighing between 250-375 g were used for all experiments. The animals were maintained on a 12 h light/dark cycle with ad libitum access to Teklad® chow (#7013; NIH-31 Modified Open Formula Diet; 0.33% sodium; Harlan Laboratories, Indianapolis, IN) and tap water except where noted. Rats were housed individually in hanging wire mesh cages, except where noted, and were adapted to the laboratory for at least one week prior to any experimental manipulation. All procedures were conducted in accordance with the National Institutes of Health Guide for the Care and Use of Laboratory Animals and were approved by the University of Iowa Animal Care and Use Committee.
Implantation of intracranial cannulas
Animals were anesthetized with an Equithesin®-like anesthetic cocktail (composed of 0.97 g of sodium pentobarbital and 4.25 g of chloral hydrate/100 ml distilled water and prepared by The University of Iowa Hospitals and Clinics Pharmacy; 0.33 ml/100 g bw) and placed in a Kopf stereotaxic instrument. With the head leveled between bregma and lambda, stainless steel 23 ga guide cannulas were implanted and secured to the skull using jewelers’ screws and dental acrylic. 30 ga obturators were used to plug the cannulas to ensure their patency until they were used. The following coordinates were used for lateral ventricle cannula placements: 0.2 mm posterior to bregma, 1.7 mm lateral to the midline, 5.5 mm ventral to the skull surface.
Implantation of osmotic minipumps for delivery of drugs
Under isoflurane anesthesia, ALZET osmotic minipumps (model 2004, Durect Corp., Cupertino, CA) were placed subcutaneously behind the neck. At least 24 h before intracranial infusions, the minipumps were placed in sterile 0.9% saline at 37° C to ensure a constant pump rate. For chronic intracranial infusions, silastic tubing was attached to the pump, threaded subcutaneously, and the free end of the tubing was connected to the intracranial cannula and secured using dental acrylic. Following the completion of experiments, the osmotic minipumps were removed, and the patency of the delivery system was determined by the residual volume of drug remaining in the pump.
Electrode placement
Rats had bipolar stimulating electrodes (10 mm length; Plastics One, Roanoke, VA.) chronically implanted in the lateral hypothalamus (LH). The LH was chosen for electrode placement based on its high reliability in producing self-stimulation behavior in rats (Morris et al., 2006; Olds, 1962). Under an Equithesin®-like anesthetic cocktail (3 ml/kg i.p.) rats were placed in a stereotaxic instrument, and the head was leveled between bregma and lambda. The coordinates used were: 3.0 mm posterior to bregma, 1.7 mm lateral to the midline, and 8.5 mm ventral to the skull surface. Four jewelers’ screws and dental acrylic were used to fix the electrode to the skull. Ketofen (5 ml/kg sc; University of Iowa Hospital Pharmacy) was administered to the animals for postoperative analgesia. Rats were allowed to recover from surgery for at least one week prior to experimentation.
Self-stimulation training
Following a recovery period of at least one week, rats were trained in a Plexiglas® operant chamber equipped with a lever that delivered a 300 ms train of rectangular pulses with 1 ms duration (Grippo et al., 2006; Morris et al., 2006). Training consisted of three to four days of adaptation to the chamber and learning the association between lever pressing and current-pulse delivery. The electrical parameters were set to predetermined values (frequency = 60 Hz; current intensity = 250 μA) and were systematically varied with “free” pulses given until the rat began to respond by pressing the lever. Once the specific parameters were determined for each rat, these were held constant for the duration of the study (with the exception of current intensity which was varied as described below). Rats that did not respond to electrical stimulation, displayed untoward motor effects, or did not generate at least 30 responses per minute (RPM) at 250 μA by the second day of training were eliminated from the study (i.e., this was a functional assessment of successful electrode placement).
LHSS current-response functions
Following LHSS training, baseline LHSS current-response functions were determined for each rat similar to methods described previously (Miliaressis, Rompre, Laviolette, Philippe, & Coulombe, 1986; Morris et al., 2006). Current was delivered in a descending series from 250 to 25 μA in ten discrete presentations of 25 μA decrements. The rat was allowed to respond for 1 minute at each current intensity. On each of three consecutive days, one current-response curve (see Figure 1 for a representative curve) was generated for each rat (RPM at each of the 10 current intensities) and these were averaged to yield a single baseline curve. An optimal current-response curve from a previous study by Morris et al., 2006) was generated for each rat using the following criteria: 1) the range of current intensities to which the rat responded was between 25 and 350 μA, 2) the response rate was minimal for low levels of current intensity (e.g., 25-75 μA) and increased monotonically, eventually reaching a plateau produced by presenting 10 consecutive increments of 25 μA current intensities, so that there was a sigmoidal relationship between current intensity and behavioral responses (r2 > .80), and 3) the maximum amount of current intensity for which the rat would respond also did not produce a motor effect. Data points were plotted using Sigma Plot (Jandel Scientific, Chicago, IL) and fitted to a 3-parameter sigmoidal function from which three parameters were calculated: 1) the maximum rate of responding, 2) the current intensity that supported 50% of the maximum response rate; defined as the effective current 50 (ECu50), and 3) the minimum rate of responding.
Figure 1.
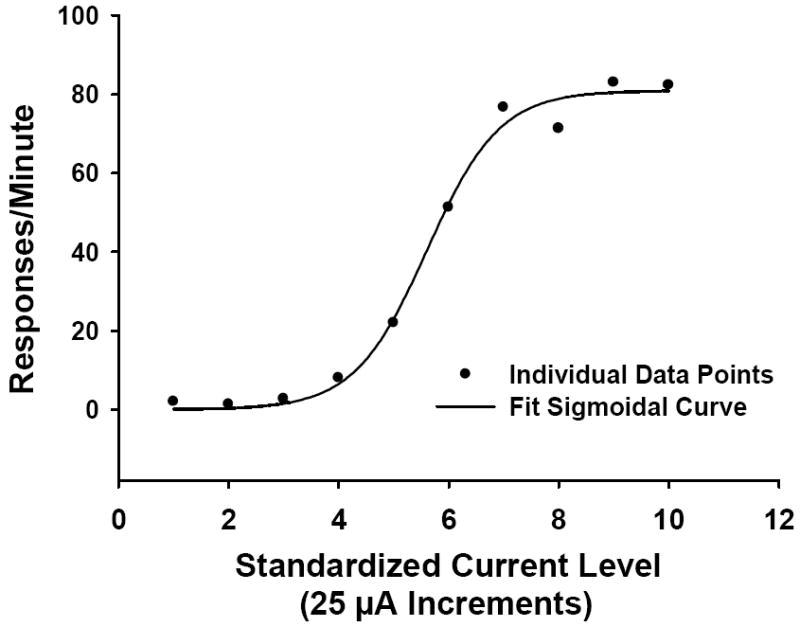
A representative lateral hypothalamic self-stimulation current-response function. Filled circles illustrate raw data points and the solid line indicates the fit curve.
Analysis of plasma aldosterone (ALDO) and plasma renin activity (PRA)
For analysis of plasma ALDO and PRA, rats were rapidly decapitated and trunk blood was collected in chilled tubes treated with anticoagulant. The samples were centrifuged at 4° C at 3000 rpm. Separated plasma was stored at -70° C until assayed for PRA or ALDO. ALDO levels were determined using Diagnostics Products solid-phase 125I radioimmunoassay kits (Los Angeles, CA). The sensitivity for ALDO is ~16 ng/ml; sensitivity for PRA is < 1 ng/ml/min. ANG I was measured and expressed as PRA using a commercially available radioimmunoassay kit (PerkinElmer, Waltham, MA). Under the conditions of the assay, the accumulation of ANG I is favored by allowing the endogenous substrate to react in the presence of reagents that inhibit both plasma converting enzymes and proteolysis by angiotensinases. The intra- and inter-assay coefficients of variation are 8% and 10%, respectively.
Statistical procedures
Mean ECu50 values were compared using paired t-tests or repeated measures ANOVA with post-hoc least significant difference (LSD) tests conducted where necessary. LHSS current-response functions following experimental manipulations were calculated identically to the baseline current-response curves. Decreased responsiveness to reward was evidenced by a significant increase in the midpoint of the curve (ECu50), representing a rightward shift in the manipulation-induced current-response curve relative to the baseline current-response curve. Body weights were analyzed by one-way ANOVA or Student’s t-tests. Water and 0.3 M saline intakes were analyzed using paired t-tests for within-group comparisons or independent t-tests for between-group comparisons. Urinary and plasma Na+ and K+, and plasma ALDO and PRA were analyzed using one-way ANOVA with follow-up Fischer’s LSD tests when the overall F value was significant. A p-value of less than .05 was considered statistically significant.
Experiment 1a: Effects of FURO-induced sodium depletion and blockade of the RAAS on LHSS reward thresholds
Protocol
After establishing LHSS baseline responding (see General Methods), baseline daily water and 0.3 M NaCl intakes were determined for all rats by recording intakes for a period of 3 days prior to the start of the experiment. Animals were also adapted to the taste of sodium-deficient rat chow (MP Biomedicals, Santa Ana, CA; Cat # 902902) during this period. Rats were randomly assigned to the following groups: 1) Vehicle-treated (n = 8), 2) FURO-treated without access to saline (FURO-NS; n = 10), 3) FURO-treated with continuous access to 0.3 M saline (FURO-WS; n = 9), 4) FURO plus daily treatment with the mineralocorticoid receptor (MR) antagonist SPIRO with no saline available (FURO+SPIRO-NS; n = 9), 5) FURO plus daily treatment with CAP with no saline available (FURO+CAP-NS; n = 7), 6) sham-FURO treatment plus daily treatment with SPIRO alone (SPIRO alone; n = 7), and 7) sham-FURO treatment plus daily treatment with CAP alone (CAP alone; n = 7).
FURO was administered subcutaneously as two (10 mg/kg) injections delivered 1 hr apart. Animals were then kept without access to food or fluids for 2 hrs after the second FURO injection. The diuretic effect of FURO was verified by a loss of body weight of at least 15 g, 2 hr after the second FURO injection. Animals treated with SPIRO were pretreated once daily (50 mg/kg) for 2 days prior to the beginning of the experiment (i.e., FURO treatment/day 1). This treatment protocol was followed based on preliminary studies that demonstrated that pretreatment was necessary to significantly reduce DOCA-induced sodium appetite (unpublished observations; M.J. Morris). All other rats were given vehicle injections during the 2-day pretreatment period. On the day of FURO treatment (day 1), SPIRO or CAP was administered one hour prior to FURO. SPIRO was given subcutaneously as a suspension mixed in corn oil at a dose of 50 mg/kg; CAP was injected subcutaneously in saline vehicle at a dose of 100 mg/kg. This dose of CAP has been shown to block FURO-induced sodium appetite in acute sodium appetite tests given the day after FURO treatment (Ruhf, Starbuck, & Fitts, 2001; Thunhorst & Johnson, 1994).
Rats were injected with CAP, SPIRO or vehicle at approximately the same time daily for 3 days (i.e., the day of FURO treatment and the subsequent 2 days). Animals were allowed access to sodium-deficient chow, water, and 0.3 M saline (dependent on group) for a period of 48 hrs after FURO (i.e., days 1-3 of the experiment). LHSS responding was tested 48 hrs after FURO treatment at approximately 3 hours after the final treatment with CAP, SPIRO, or vehicle. Following the completion of LHSS testing on day 3, all groups were subsequently allowed access to 0.3 M saline for a recovery (REC) period of approximately 48 hrs (days 3-5 of the experiment). Following REC, animals were once again tested for LHSS responsiveness (day 5), which marked the end of the experiment. Daily water and saline intakes were recorded throughout the experiment. A significant overall F ratio prompted post-hoc comparisons between baseline vs. test 1 and vs. test 2, baseline vs. REC1 and REC2 and each test vs. each REC. Test 1 refers to the 24 hr period following FURO treatment (day 1-2); test 2 was the period from 24-48 hrs after treatment (day 2-3). REC1 and REC2 represent the recovery periods of 0-24 hrs (days 3-4 of the experiment) and 24-48 hrs (days 4-5 of the experiment), respectively.
Results
Body weights differed between groups before the start of the experiment [F(6, 57) = 3.92, p = .003], with LSD post-hoc tests showing that vehicle-treated (mean+SEM = 371.1 ± 15.0 g), FURO-NS-treated (357.4 ± 9.3 g), and FURO-WS-treated (360.4 ± 11.2) rats weighed significantly more (p < .05) than the FURO+SPIRO-NS (331.4 ± 3.4 g), FURO+CAP-NS (328.9 ± 4.9 g), SPIRO alone (332.7 ± 8.4 g), and CAP alone (326.6 ± 6.1 g) groups. FURO acted as an effective diuretic, as expected all FURO-treated rats lost at least 15 g body weight 2 hours after the last FURO injection.
A sigmoidal relationship existed between current intensity and response rate for LHSS. As current intensity increased, RPM also increased approaching an asymptote. In the FURO-NS group there was a significant effect of time on ECu50 [F(2, 18) = 4.64, p = .024], and large rightward shifts in LHSS current-response functions were apparent (Figure 2). Subsequent post-hoc LSD tests revealed that ECu50 values at 48 hr after FURO treatment were significantly greater than baseline (p = .015) and REC values (p = .041; Table 1). This result replicates the findings of a previous study from our laboratory (Grippo et al., 2006). CAP treatment failed to prevent the increased ECu50 observed after FURO-NS treatment as there remained a significant effect of time in the FURO+CAP-NS group [F(2, 12) = 6.59, p = .012], with ECu50 values at 48 hr and REC significantly elevated from baseline (p = .02, and p = .034, respectively). FURO-WS rats did not show a significant change in ECu50 from baseline, suggesting that saline availability during treatment prevented the LHSS deficits observed following FURO-NS treatment. SPIRO treatment also blocked the hedonic changes that followed FURO-NS treatment (Table 1). SPIRO alone and CAP alone had no significant effects on ECu50 values as compared to baseline (Table 1). There was no effect of time (baseline vs. 48 hr vs. REC) on minimum or maximum RPM for any of the groups, with the exception of the vehicle-treated group which exhibited an increase in maximum RPM at 48 hr as compared to the REC period [overall F(2, 14) = 4.23, p = .037; 48 hr vs. REC, p = .021; Table 1].
Figure 2.
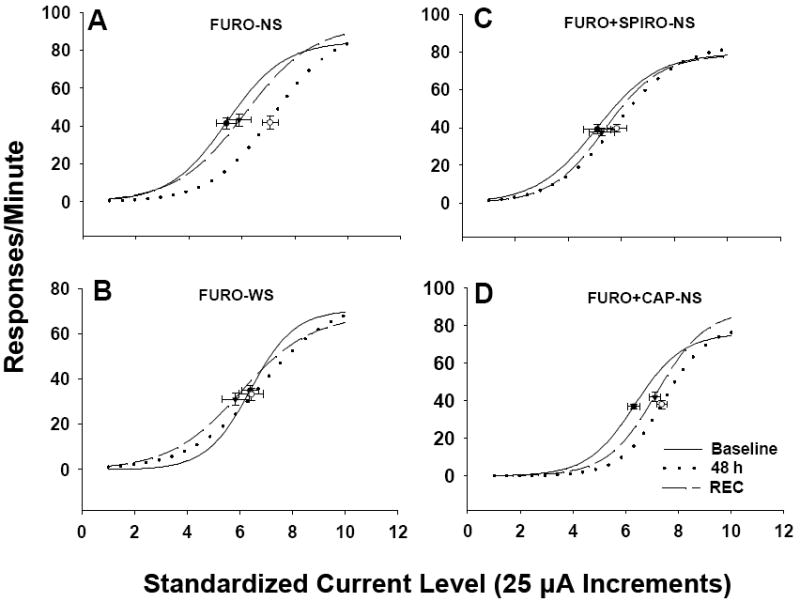
Mean lateral hypothalamic self-stimulation (LHSS) current-response curves for Experiment 1a. LHSS curves for the (A) FURO-NS, (B) FURO-WS, (C) FURO+SPIRO-NS, and (D) FURO+CAP-NS groups at baseline (solid line), 48 hours after FURO treatment (48 h; dotted line), and following recovery (REC; dashed line) in Experiment 1a. Data are shown as sigmoid curves fit to mean values. Black dots or open circles indicate the midpoint effective current 50 (ECu50) of each curve with corresponding vertical and horizontal SEM bars. FURO-NS = furosemide-treated without assess to saline; FURO-WS = furosemide-treated with continuous access to 0.3 M saline; FURO+SPIRO-NS = furosemide plus spirolactone with no saline available; FURO-+CAP-NS = furosemide plus captopril with no saline available.
Table 1.
Lateral hypothalamic self-stimulation performance following furosemide treatment. Values depict current-response curve parameters (mean ± SEM) defining lateral hypothalamic self-stimulation responding in Experiment 1a.
| Group (n) | Min RPM | ECu50 | Max RPM |
|---|---|---|---|
| Vehicle (8) | |||
| Baseline | 1.53±0.33 | 5.80±0.28 | 77.52±6.52 |
| 48 hr | 0.94±0.33 | 5.68±0.25 | 87.75±4.79† |
| REC | 1.29±0.22 | 5.81±0.28 | 78.25±4.29 |
| FURO-NS (10) | |||
| Baseline | 1.31±0.41 | 5.41±0.36 | 87.62±6.85 |
| 48 hr | 0.90±0.29 | 7.07±0.38*† | 90.50±6.60 |
| REC | 1.96±0.68 | 5.79±0.44 | 90.28±6.75 |
| FURO-WS (9) | |||
| Baseline | 0.51±0.12 | 6.16±0.33 | 73.55±4.82 |
| 48 hr | 1.28±0.40 | 6.41±0.47 | 69.50±4.82 |
| REC | 1.46±0.59 | 5.63±0.51 | 66.27±4.98 |
| FURO+SPIRO+NS (9) | |||
| Baseline | 2.00±0.45 | 5.19±0.51 | 81.17±5.57 |
| 48 hr | 2.00±0.77 | 5.75±0.38 | 83.44±3.45 |
| REC | 2.55±1.12 | 5.07±0.49 | 78.20±4.03 |
| FURO+CAP+NS (7) | |||
| Baseline | 1.32±0.29 | 6.31±0.24 | 74.25±2.16 |
| 48 hr | 1.00±0.22 | 7.38±0.19* | 76.36±4.41 |
| REC | 1.14±0.24 | 7.10±0.21* | 84.79±6.24 |
| SPIRO alone (7) | |||
| Baseline | 2.57±0.34 | 5.80±0.24 | 78.00±6.56 |
| 48 hr | 5.54±1.99 | 5.00±0.70 | 75.07±5.52 |
| REC | NR | NR | NR |
| CAP alone (7) | |||
| Baseline | 1.50±0.21 | 6.27±0.22 | 76.61±9.50 |
| 48 hr | 1.78±0.58 | 5.75±0.42 | 72.21±7.80 |
| REC | 0.78±0.42 | 6.97±0.37 | 74.50±9.16 |
Min = minimum; max = maximum; RPM = responses per minute; ECu50 = effective current 50; REC = recovery; NR = not recorded; see the legend for Figure 3 for group abbreviations.
p < .05 vs. respective baseline value;
p < .05 vs. respective REC value.
Table 2 summarizes the water and 0.3 saline intakes during the baseline, the 24 hr period after treatment (i.e., with vehicle, FURO and/or RAAS antagonists; Test 1), the 24-48 hr period after treatment (Test 2), and recovery. There was a significant effect of time on water intake in the FURO-NS [F(4, 44) =17.63, p < .001], FURO+SPIRO-NS [F(4, 36) = 4.76, p = .003], and FURO+CAP-NS [F(4, 24) = 4.97, p = .005] groups. FURO-NS rats showed increased water intakes in the 24 hr period following FURO treatment (test 1 vs. baseline, p < .001; test 1 vs. REC 1, p = .002) and between 24 and 48 h following FURO treatment (test 2 vs. baseline, p = .001). FURO+SPIRO-NS showed a similar pattern, with test 1 and test 2 water intakes significantly greater than baseline (p = .003, p = .002, respectively). Test 1 intakes were also higher than REC2 intakes (p = .047). The FURO+CAP-NS group also showed elevated water intake following FURO treatment as compared to baseline (test 1 vs. baseline, p = .003; test 2 vs. baseline, p = .044; REC2 vs. baseline, p = .007; test 1 vs. REC1, p = .017).
Table 2.
Water and 0.3 M saline intakes following furosemide or vehicle treatment (mean ± SEM) in Experiment 1a.
| Group | Baseline | Test 1 | Test 2 | REC 1 | REC 2 |
|---|---|---|---|---|---|
| Water Intake (ml) | |||||
| Vehicle | 20.6±1.2 | 23.5±2.2 | 22.3±1.5 | NR | NR |
| FURO-NS | 20.6±0.9 | 37.9±2.9* | 32.4±2.2* | 27.9±2.1* | 25.1±1.6* |
| FURO-WS | 22.9±1.0 | 24.6±1.7 | 23.1±2.1 | 21.9±2.0 | 25.7±1.7 |
| FURO+SPIRO-NS | 19.3±1.1 | 31.5±4.1* | 27.9±2.3* | 27.0±3.9 | 23.8±0.9 |
| FURO+CAP-NS | 21.3±0.9 | 34.7±2.3* | 33.4±4.1* | 25.1±3.4 | 25.1±1.1 |
| CAP alone | 22.9±1.9 | 31.7±4.7 | 27.4±5.6 | 23.4±4.1 | 24.4±3.4 |
| 0.3 M saline intake (ml) | |||||
| Vehicle | 4.0±1.0 | 2.4±0.9 | 4.1±1.2 | NR | NR |
| FURO-NS | 3.8±0.7 | Ø | Ø | 18.7±2.0* | 8.3±1.8* |
| FURO-WS | 3.9±0.6 | 22.6±3.3* | 11.2±2.3* | 8.6±1.0* | 5.3±1.5 |
| FURO+SPIRO-NS | 4.0±1.0 | Ø | Ø | 20.9±2.4* | 2.4±2.4* |
| FURO+CAP-NS | 3.7±0.4 | Ø | Ø | 21.7±3.1* | 5.1±1.4 |
| CAP alone | 3.1±0.7 | Ø | Ø | 7.7±1.4* | 7.0±2.2 |
As expected, FURO treatment elicited a robust sodium appetite. There was a significant effect of time on 0.3 M saline intake for the FURO-WS group [F(4, 40) = 16.86, p < .001]. Intakes were significantly higher during test 1 and test 2 vs. baseline (p < .001, p = .007, respectively), and vs. REC1 and REC2 (p < .001, p = .001, respectively). FURO-NS rats displayed greater intakes during REC1 and REC2 vs. baseline [overall F(2, 22) = 30.27, p < .001; baseline vs. REC1, p < .001; baseline vs. REC2, p = .049]. During REC1, FURO+SPIRO-NS rats also drank more saline as compared to baseline [F(2, 18) = 43.55, p < .001; baseline vs. REC1, p < .001], as did FURO+CAP-NS rats [F(2, 12) = 29.57, p < .001; baseline vs. REC1, p = .001]. During REC1, CAP alone treated rats exhibited a significant increase in saline intake as compared to baseline [F(2, 12) = 5.08, p = .025; baseline vs. REC1, p = .011]. CAP alone treatment had no significant effect on water intakes. Treatment with SPIRO alone had no significant effects on water or 0.3% saline intake. (See Table 2 for water and saline intakes.)
Experiment 1b. Effects of blockade of components of the RAAS on FURO-induced thirst, sodium appetite, and plasma Na+ and K+
Protocol
A separate group of animals was included to determine the effects of FURO+SPIRO and FURO+CAP on FURO-induced thirst and sodium appetite, as this could not be determined following the above protocol. As in Experiment 1a rats were adapted to the taste of sodium-free rat chow and 0.3 M saline for 3 days, during which time baseline daily saline and water intakes were determined. Animals were randomly assigned to the following groups: 1) vehicle (n = 6), 2) FURO-NS (n = 6), 3) FURO-WS (n = 6), 4) FURO+SPIRO-NS (n = 6), 5) FURO+SPIRO-WS (n = 8), 6) FURO+CAP-NS (n = 7), 7) FURO+CAP-WS (n = 7), 8) SPIRO alone WS (n = 7), and 9) CAP alone WS (n = 7). Rats were treated with FURO and subsequently decapitated for the collection of trunk blood for analysis of plasma Na+ and K+ prior to any REC period (i.e., 48 hrs after FURO treatment). Blood was collected in chilled, heparinized tubes and spun for 15-20 minutes in a refrigerated centrifuge. Plasma was collected and stored at -20 °C and subsequently analyzed for Na+ and K+ concentration using detection with an ion-specific electrode system (NOVA Biomedical, Waltham, MA.). SPIRO-treated rats were pretreated daily for 2 days prior to FURO depletion; all other groups were treated with vehicle during this time. Administered doses of FURO, SPIRO, and CAP were identical to Experiment 1a. (Note: only groups 1-4, and 6 were used for analysis of plasma Na+/K+).
Results
Figure 3 presents the water and saline intakes for the groups in Experiment 1b. The pattern of water intake was similar to that seen for comparable groups in Experiment 1a. FURO-treated rats consumed significantly more saline following treatment than during baseline. There was a significant effect of time on 0.3 M saline intake in the FURO-WS group [F(2, 10) = 26.43, p < .001], and FURO+CAP-WS group [F(2, 12) = 79.04, p < .001]. FURO-WS rats consumed more saline in test 1 and test 2 as compared to baseline (p < .001, p = .001, respectively). The FURO+CAP-WS group exhibited the same pattern (p < .001 baseline vs. test 1 and 2). Treatment with the MR antagonist SPIRO significantly reduced saline intake such that there was no significant effect of time (p = .154), despite a trend toward increased saline intake for test 1 vs. baseline. Treatment with CAP alone or with SPIRO alone had no effect on water or saline intakes in Experiment 1b.
Figure 3.
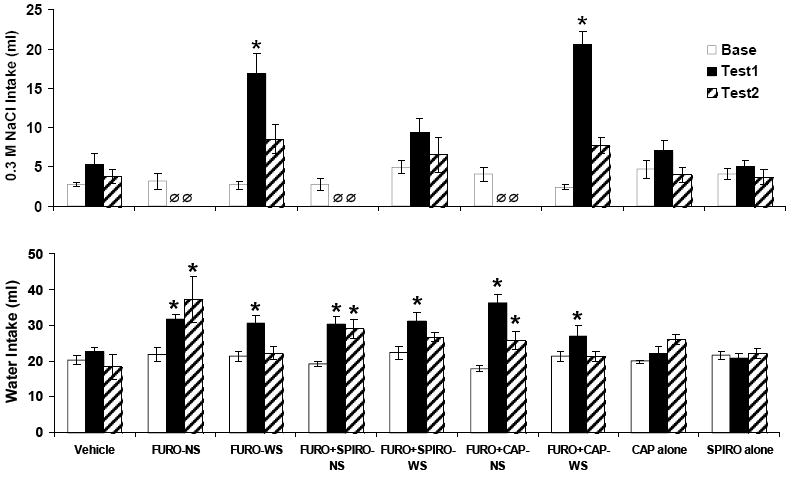
Mean ± SEM intakes of 0.3 M saline and water in Experiment 1b. There was no effect of time on saline intake in the FURO+SPIRO-NS group, indicating that SPIRO reduced saline intakes in this group. Ø indicates the 0.3 M saline was not available for the FURO-NS, FURO+SPIRO-NS and FURO+CAP+NS groups. Group abbreviations for Figures 3 and 4 and Tables 1, 2, 3 and 4: FURO-NS = furosemide-treated without access to saline; FURO-WS = furosemide-treated with continuous access to 0.3 M saline; FURO+SPIRO-NS = furosemide plus spirolactone with no saline available; FURO-+CAP-NS = furosemide plus captopril with no saline available; CAP alone = sham furosemide treatment plus daily treatment with captopril; SPIRO alone = sham furosemide treatment plus daily treatment with spironolactone; FURO+SPIRO-WS = furosemide plus spirolactone with continuous access to 0.3 M saline; FURO-+CAP-WS = furosemide plus captopril with continuous access to 0.3 M saline. See the legend for Figure 3 for group abbreviations. *p < .05 vs. baseline (base).
There was no significant effect of group on plasma Na+ or plasma K+. FURO-NS rats showed reduced plasma Na+ values relative to vehicle-treated and FURO-WS rats, as did the FURO+SPIRO-NS and FURO+CAP-NS groups (see Table 3).
Table 3.
Plasma Na+ and K+ (mean ± SEM) values following furosemide treatment in Experiment 1b.
| Group (n) | PNa+ | PK+ |
|---|---|---|
| Vehicle (6) | 145.8±8.2 | 7.6±0.4 |
| FURO-NS (6) | 130.8±4.5 | 6.5±0.4 |
| FURO-WS (6) | 158.4±4.6 | 7.7±0.2 |
| FURO+SPIRO-NS (7) | 136.8±2.4 | 6.6±0.5 |
| FURO+CAP-NS (7) | 135.2±14.2 | 7.1±1.0 |
PNa+ and PK+ are expressed as mmol/L; see the legend for Figure 3 for group abbreviations.
Experiment 1c. Effects of blockade of components of the RAAS on plasma aldosterone (ALDO) and renin activity (PRA), and urinary Na+ and K+ excretion following FURO treatment
Protocol
A separate group of animals were included to determine the effects of FURO+SPIRO and FURO+CAP on urinary Na+ and K+ excretion, and plasma ALDO and PRA. Plasma ALDO and PRA were assessed as described in the General Methods. Urine was collected the morning prior to FURO treatment (“baseline”), 2 hrs after FURO treatment (2 hr), and 48 hrs after treatment (48 hr). Urinary Na+ and K+ were analyzed using an ion-specific electrode (NOVA). Experimental n’s for the analysis of ALDO were: vehicle = 9; FURO-NS = 10; FURO-WS = 13; FURO+SPIRO-NS = 9; FURO+CAP-NS = 8. Subsets of these rats were also analyzed for PRA (n = 6/group), and urinary Na+ and K+ (n = 4/group with separate SPIRO alone and CAP alone groups included).
Results
Urinary Na+ and K+ excretion data are presented in Table 4. FURO treatment, as expected, increased the urinary excretion of Na+. There was a significant effect of group on Na+ excretion at 48 hrs post-FURO treatment [F(6, 27) = 10.78, p < .001]. FURO-WS rats excreted significantly more Na+ at 48 hr than all other groups (p < .001 vs. each group). The FURO-NS group excreted significantly less Na+ at 48 hr than FURO-WS and SPIRO alone rats (p < .001, p = .043, respectively), although FURO-NS rats excreted large amounts of sodium immediately following the FURO treatment and were subsequently denied any source of sodium. K+ excretion was not significantly different as a result of group at any time point measured.
Table 4.
Urinary Na+ and K+ (mean ± SEM) excretion following furosemide or vehicle treatment in Experiment 1c.
| Group (n) | UV (ml) | UNa+ | UK+ |
|---|---|---|---|
| Vehicle (4) | |||
| Baseline | 12.8±1.3 | 0.7±0.4 | 1.0±0.2 |
| 2 hr | NA | NA | NA |
| 48 hr | 11.8±0.8 | 0.4±0.9 | 1.6±0.1 |
| FURO-NS (4) | |||
| Baseline | 12.9±1.4 | 0.7±0.1 | 0.9±0.0 |
| 2 hr | 15.3±1.3 | 1.5±0.1 | 0.9±0.3 |
| 48 hr | 14.5±2.4 | 0.1±0.0 | 2.0±0.2 |
| FURO-WS (4) | |||
| Baseline | 12.5±2.4 | 0.8±0.2 | 1.0±0.2 |
| 2 hr | 14.8±1.5 | 1.6±0.2 | 1.0±0.2 |
| 48 hr | 11.0±1.5 | 2.2±0.6* | 1.3±0.2 |
| FURO+SPIRO-NS (4) | |||
| Baseline | 18.0±1.9 | 1.3±0.2 | 0.8±0.2 |
| 2 hr | 14.3±2.8 | 1.8±0.3 | 0.9±0.3 |
| 48 hr | 13.5±3.2 | 0.1±0.0 | 1.0±0.0 |
| FURO+CAP-NS (4) | |||
| Baseline | 15.5±0.5 | 0.6±0.1 | 1.1±0.1 |
| 2 hr | 11.8±2.0 | 1.0±0.2 | 0.8±0.2 |
| 48 hr | 16.6±4.7 | 0.2±0.1 | 1.3±0.3 |
| SPIRO alone (4) | |||
| Baseline | 14.5±0.9 | 1.1±0.1 | 0.9±0.2 |
| 2 hr | NA | NA | NA |
| 48 hr | 13.8±0.9 | 0.8±0.1 | 1.6±0.1 |
| CAP alone (4) | |||
| Baseline | 17.5±1.5 | 0.8±0.1 | 1.0±0.1 |
| 2 hr | NA | NA | NA |
| 48 hr | 15.0±1.5 | 0.3±0.1 | 1.3±0.4 |
Note: Urinary sodium and potassium are expressed in total mEq.
NA = not enough urine available at this time point to analyze.
p < .05 vs. all other groups.
Plasma ALDO and PRA concentrations are presented in Figure 4. Plasma ALDO levels differed significantly based on group [F(4, 48) = 22.54, p < .001]. FURO-NS and FURO+SPIRO-NS rats had increased plasma ALDO relative the vehicle-treated group (p < .001 in both cases), while the FURO+CAP-NS and FURO-WS (p = .056) groups were not statistically different from vehicle. Also, FURO-NS and FURO+SPIRO-NS showed elevated ALDO as compared to the FURO-WS group (p <.001 in both cases). Following a significant overall one-way ANOVA [F(4, 29) = 5.63, p = .003], post-hoc tests indicated that PRA was significantly elevated in FURO-NS, FURO+SPIRO-NS, and FURO+CAP-NS relative to vehicle-treated (p = .01, .013, and .003, respectively) and FURO-WS rats (p = .008, .010, and .002, respectively).
Figure 4.
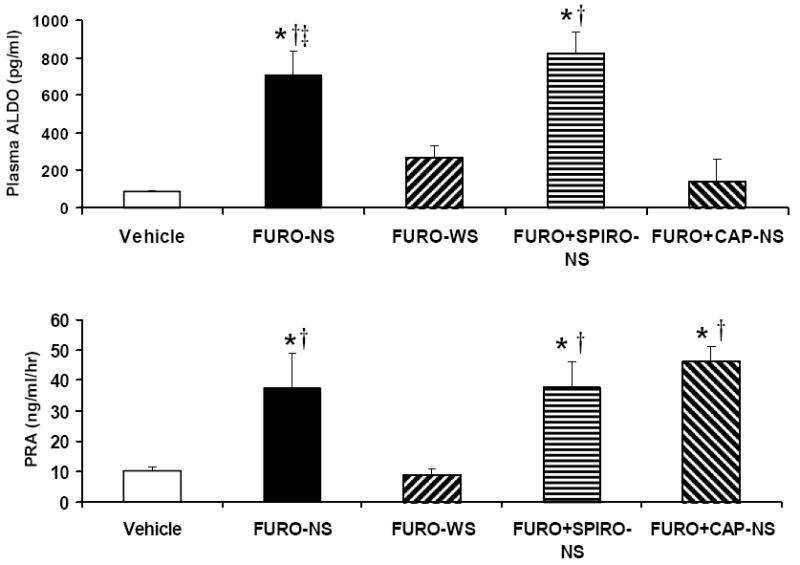
Mean ± SEM levels of plasma aldosterone and plasma renin activity following furosemide treatment in Experiment 1c. *p < 0.05 vs. vehicle; †p < 0.05 vs. FURO-WS; ‡p < .05 vs. FURO+CAP-NS. See the legend for Figure 3 for group abbreviations.
Experiment 2a: Effects of central treatment with the MR antagonist RU 28318 on DOCA-no salt-induced hedonic deficits
Protocol
A within-subjects design with two phases of treatment was used. After establishing LHSS baseline responding and baseline 0.3 M saline intakes, rats were randomly assigned to the following groups: 1) DOCA-treated for 6 days (phase 1) with no saline available followed by DOCA treatment for 6 days (phase 2) with intracerebroventricular (icv) administration of the MR antagonist RU 28318 (D-DMRX; n = 8), 2) DOCA-treated with icv administration of RU 28318 for 6 days followed by DOCA treatment for 6 days without saline available (DMRX-D; n = 8), 3) treatment for 12 days with icv RU 28318 alone (MRX alone; n = 9), 4) DOCA-treated for 6 days with concurrent icv administration of the selective GR antagonist RU 486, (D+GRX; n = 9). Subgroups of rats were tested with RU 28318 (acute MRX; n = 10) or RU 486 (acute GRX; n = 9) prior to the beginning of the experiment (i.e., the administration of DOCA) to determine the effects of acute treatments on LHSS responding. During the experiment these animals were treated with the same drug that they received for the acute tests. DOCA was administered at a dose of 10 mg/kg; RU 28318 and RU 486 were administered icv at doses of 10 μg/μl/hr and 100 ng/μl/hr, respectively. The dose of RU 28318 was chosen because it has been shown to significantly reduce saline intake in FURO-treated rats (Sakai et al., 1986), and the dose of RU 486 was used because it has been reported to facilitate spatial learning in rats (Oitzl, Fluttert, Sutanto, & de Kloet, 1998). Body weights were recorded at the beginning of the experiment, at the switch from phase 1 to phase 2, and at the end of the experiment. With the exception of the measurement of baseline intakes no animals were allowed access to saline during treatment. Appropriate placement of icv cannulas was determined at the conclusion of Experiments 2a and 2b by measuring water intakes following acute icv injection of 50 ng ANG II in 1.0 μl of sterile water. Animals that did not drink ≥ 5 ml water in the 15 minutes following ANG II injection were excluded from the study.
Results
There were no differences in body weight between groups prior to the start of the experiment [D-DMRX (mean±SEM) = 340.8 ± 17.4; DMRX-D = 336.5 ± 18.7; MRX alone = 324.9 ± 17.6; D+GRX = 338.9 ± 4.3], at the switch from phase 1 to phase 2 (D-DMRX = 341.4 ± 16.6; DMRX-D = 336.6 ± 19.3; MRX alone = 325.4 ± 18.2; D+GRX = 342.1 ± 14.5), or at the end of the experiment (D-DMRX = 349.9 ± 16.2; DMRX-D = 344.8 ± 18.9; MRX alone = 335.4 ± 19.1; D+GRX = 350.3 ± 4.6).
Shown in Figure 5 are the mean LHSS current-response curves for Experiment 2a. ECu50 values in the D-DMRX group were significantly different as a result of time [i.e., baseline vs. phase 1 vs. phase 2; F(2, 14) = 18.21, p < .001]. Large rightward shifts in LHSS current-response functions were apparent during phase 1 as compared to baseline and phase 2, which was confirmed by the observation that ECu50 values for phase 1 testing were significantly greater than during baseline (p < .001) or phase 2 (p < .001; Figure 6). This replicates our previous finding that DOCA-treated rats without saline available during treatment show elevated mean ECu50 values relative to baseline (Morris et al., 2006). DOCA-treated rats that were also treated chronically with icv RU 28318 administration (DMRX-D group) did not evidence changes in ECu50 from baseline (Figure 6). There were no significant effects of time on ECu50 in the DMRX-D, DGRX, or MRX alone groups (Figure 6), although in the case of the MRX alone group the overall F statistic was close to being statistically significant [F(2, 16) = 3.55, p = .057)] There was a significant effect of time on the maximum number of RPM for LHSS for the D-DMRX group [F(2, 14) = 4.67, p = .028], with the maximum RPM at phase 2 being significantly greater than baseline (p = .038) and phase 1 (p = .048). See Table 5 for maximum and minimum RPM.
Figure 5.
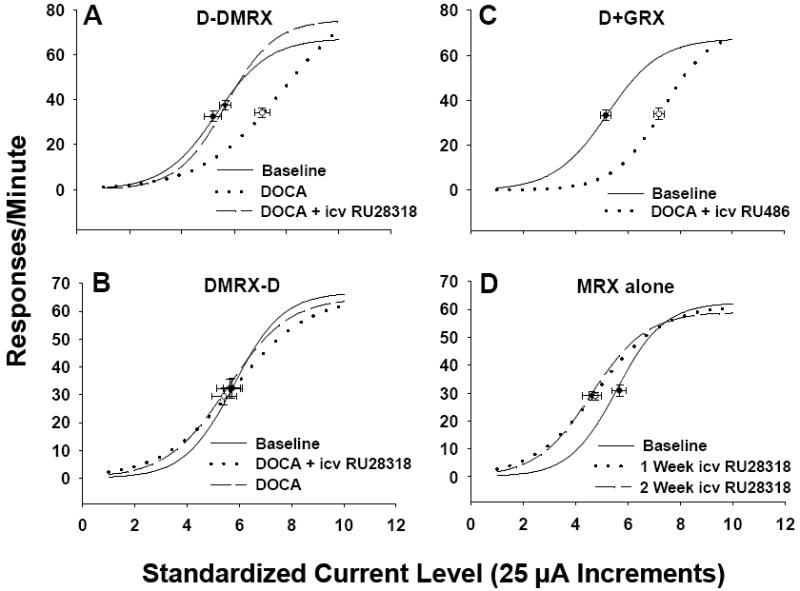
Mean lateral hypothalamic self-stimulation (LHSS) current-response curves for Experiment 2a. LHSS curves for the (A) D-DMRX, (B) DMRX-D, (C) D+GRX, and (D) MRX alone groups at baseline (solid line), phase 1 (dotted line), and phase 2 (dashed line). Data are shown as sigmoid curves fit to mean values. Black dots indicate the effective current 50 (ECu50) value of each curve with corresponding vertical and horizontal SEM bars. Group abbreviations for Figures 6, 7 and 8 and Table 5: D-DMRX = DOCA-treated for 6 days (phase 1) with no saline available followed by DOCA treatment for 6 days (phase 2) with icv administration of the MR antagonist RU 28318; DMRX-D = DOCA-treated with icv administration of RU 28318 for 6 days followed by DOCA treatment for 6 days without saline available; MRX alone = treatment for 12 days with icv RU 28318 alone; D+GRX = DOCA-treated for 6 days with concurrent icv administration of the selective GR antagonist RU 486.
Figure 6.
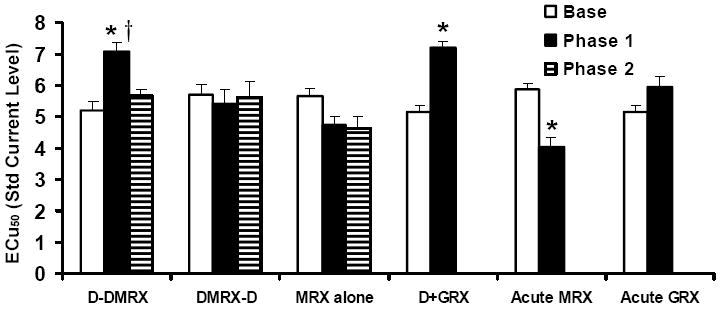
Mean ± SEM ECu50 values for Experiment 2a. ECu50 values were significantly higher in the D-DMRX group at phase 1 relative to baseline and phase 2. Phase 1 ECu50 values were increased in the D+GRX group relative to baseline, suggesting that chronic icv RU 486 failed to block the increased ECu50 induced by DOCA-NS treatment. ECu50 values were significantly reduced in the acute MRX group following icv injection of RU 28318 as compared to baseline. Acute MRX = tested with an acute injection of RU 28318 before beginning DOCA treatments; GRX = tested with an acute injection of RU 486 before beginning DOCA treatment; see the legend for Figure 5 for additional group abbreviations. *p < .05 vs. respective baseline; †p < .05 vs. phase 2.
Table 5.
Lateral hypothalamic self-stimulation performance following DOCA treatment with or without icv treatment with Mineralocorticoid or Glucocorticoid Receptor antagonists (RU 28318 or RU 486, respectively). Values depict current-response curve parameters (mean ± SEM) defining lateral hypothalamic self-stimulation responding in Experiment 2a.
| Group (n) | Min RPM | ECu50 | Max RPM |
|---|---|---|---|
| D-DMRX (8) | |||
| Baseline | 2.03±0.41 | 5.19±0.33 | 67.63±4.28 |
| Phase 1 | 1.13±0.24 | 7.08±0.30*‡ | 69.69±4.83 |
| Phase 2 | 1.75±0.18 | 5.66±0.22 | 79.19±4.58*† |
| DMRX-D (8) | |||
| Baseline | 1.44±0.34 | 5.71±0.33 | 67.47±7.02 |
| Phase 1 | 2.03±0.66 | 5.41±0.48 | 64.03±5.83 |
| Phase 2 | 1.97±0.54 | 5.63±0.50 | 67.16±6.98 |
| MRX alone (9) | |||
| Baseline | 1.28±0.31 | 5.67±0.26 | 64.31±3.87 |
| Phase 1 | 3.06±0.70 | 4.75±0.34 | 63.00±3.40 |
| Phase 2 | 3.17±0.75 | 4.61±0.37 | 61.53±2.78 |
| D+GRX (9) | |||
| Baseline | 2.94±0.58 | 5.16±0.20 | 69.14±4.12 |
| Phase 1 | 1.47±0.17 | 7.20±0.20* | 67.92±5.06 |
| Acute MRX (10) | |||
| Baseline | 1.30±0.31 | 5.89±0.25 | 68.22±5.74 |
| Phase 1 | 3.95±1.25* | 4.03±0.30* | 67.00±4.07 |
| Acute GRX (9) | |||
| Baseline | 2.97±0.59 | 5.16±0.20 | 69.17±4.15 |
| Phase 1 | 1.11±0.26 | 5.94±0.35 | 55.56±3.30* |
Min = minimum; max = maximum; RPM = responses per minute; ECu50 = effective current 50; see the legend for Figure 6 for group abbreviations.
p < .05 vs. respective baseline value;
p < .05 vs. Phase 1;
p < .05 vs. Phase 2.
Figure 7 presents the acute effects of icv RU 28318 and RU 486 prior to the start of DOCA treatment on LHSS. The acute MRX group exhibited a robust leftward shifts in LHSS current-response functions, indicative of enhanced responsiveness to LHSS, and a significantly decreased ECu50 value relative to their baselines [t(9) = 5.84, p < .001]. By contrast, acute GRX rats displayed rightward shifts (Figure 7), although the change in ECu50 failed to reach statistical significance (p = .06; Figure 7). It should be noted that acute icv GR antagonism led to a significantly reduced maximum number of RPM for LHSS at the highest current intensities [t(8)= 4.18, p = .003; Table 5], suggesting that treatment may have in some way compromised the capacity of the animals to lever press. Acute MRX rats did not show differences in maximum RPM, however the minimum number of RPM at the lowest current intensity was significantly greater than that observed at baseline [t(9) = 2.44, p = .038; Table 5].
Figure 7.
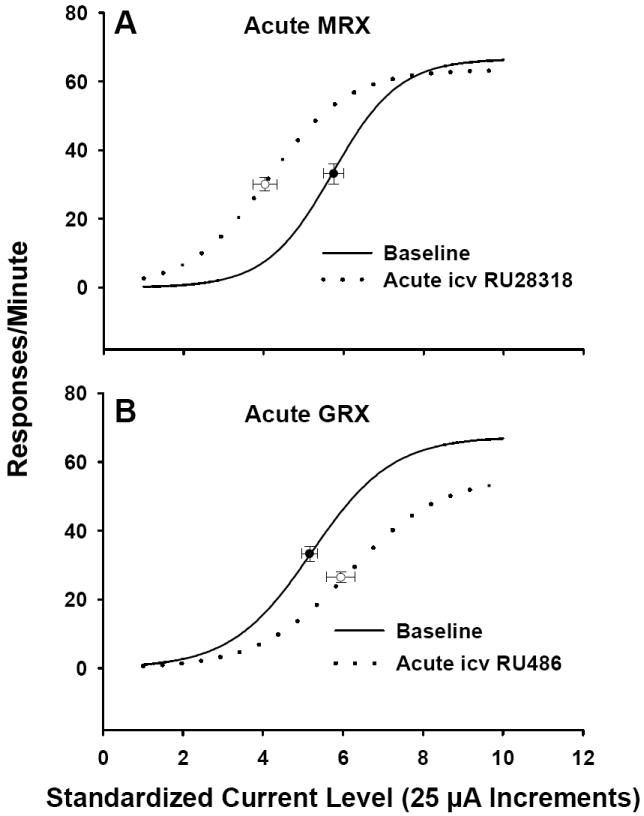
Mean lateral hypothalamic self-stimulation current-response curves for rats following acute treatment with icv RU 28318 or icv RU 486 in Experiment 2a. Data are shown as sigmoid curves fit to mean values. Black dots indicate the midpoint effective current 50 (ECu50) of each curve with corresponding vertical and horizontal SEM bars. See the legend for Figure 6 for abbreviations of acute MRX and acute GRX.
Experiment 2b: Effects of RU-28318 on DOCA-induced thirst and sodium appetite
Protocol
Baseline daily 0.3 M NaCl and water intakes were established followed by the random assignment of rats to the following groups: 1) DOCA-WS (n = 8), 2) DOCA plus chronic icv treatment with RU 28318 (DOCA+icvMRX; n = 7), 3) DOCA plus subcutaneous treatment with RU 28318 via osmotic minipump, included to determine if the icv dose of RU 28318 could potentially have peripheral effects (DOCA+scMRX; n = 8), and 4) DOCA plus chronic icv treatment with RU 486 (DOCA+GRX; n = 8). All rats were treated for 12 days. The doses and routes of administration of DOCA, RU 28318, and RU 486 were identical to Experiment 2a. Water and 0.3 M saline intakes were recorded daily. Body weights were recorded at the beginning and end of the experiment.
Results
As in Experiment 2a, body weights were not different between the groups at the beginning or end of the experiment (not shown). The daily intakes of 0.3 M NaCl and water are given in Figure 8. There were no between-group differences in water intake at any time during the experiment. By contrast, there was a significant effect of group on 0.3 M saline intake on day 3 [F (3, 30) = 6.29, p = .002; DOCA-WS vs. DOCA+icvMRX, p = .029; DOCA-WS vs. DOCA+icvMRX, p = .049; DOCA+icvMRX vs. DOCA+GRX, p < .001; DOCA+scMRX vs. DOCA+GRX, p = .015] and day 5 [overall F(3, 30) = 6.41, p = .002] with DOCA+icvMRX rats having drank less saline than all other groups on day 5 (DOCA+icvMRX vs. DOCA-WS, p = .003; DOCA+icvMRX vs. DOCA+scMRX, p = .001; DOCA+icvMRX vs. DOCA+GRX, p = .001). The same pattern as day 5 held for days 6-11 (F statistics day 6-11: 9.45, 7.98, 13.92, 8.42, 11.00, and 7.01, respectively; p ≤ .001 for all comparisons). There was no statistically significant effect of group on saline intake on day 12 (p = .079).
Figure 8.
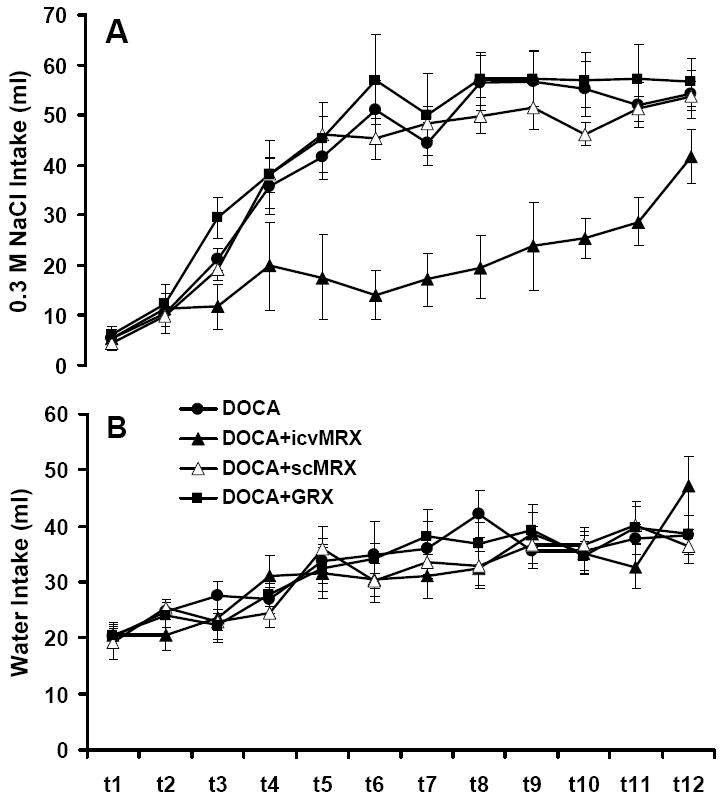
Water and 0.3 M saline intakes in rats treated with deoxycorticosterone acetate (DOCA), DOCA plus chronic intracerebroventricular RU 28318 (DOCA+icvMRX), DOCA plus chronic subcutaneous RU 28318 (DOCA+scMRX), or DOCA plus chronic icv RU 486 (DOCA+GRX) in Experiment 2b. (A) There was a significant effect of group on 0.3 M saline intake on day 3 and on days 5-11 of treatment (p < .01). DOCA+icvMRX rats had reduced intakes relative to all other groups on day 3 and days 5-11 (p < .01). (B) Water intake in the DOCA, DOCA+icvMRX, DOCA+scMRX, and DOCA+GRX groups. There was no effect of group on water intake at any time during treatment.
Discussion
Our laboratory has previously demonstrated that FURO or DOCA treatments, two procedures that normally induce sodium appetite in rats, produce a decrease in responding for rewarding stimuli if the animals are denied access to saline solutions (Grippo et al., 2006; Morris et al., 2006). The outcomes of the current studies replicate these findings, and extend our understanding of these phenomena by assessing hedonic responses of rats following FURO or DOCA under pharmacological blockade of components of the RAAS. It is important to note that, with the exception of acute treatment with RU 486, there were no differences in maximum RPM for LHSS which indicates that the animals’ capacities for making lever pressing responses were not compromised by the pharmacological treatments.
The most provocative finding of these studies is that, along with saline availability, only the drug treatments that significantly reduced sodium appetite (e.g., RU 28318, SPIRO, saline availability) prevented the hedonic deficits that followed either FURO-NS or DOCA-NS treatments. CAP, although effective at reducing ALDO secretion in Experiment 1, had no effect on FURO-NS induced anhedonia, most likely due to its inability to reduce the powerful drive on sodium-seeking behavior as a result of sodium depletion. Although our intention was to block subsequent FURO-induced sodium appetite with CAP treatment, our results with CAP are nevertheless provocative in that failure of CAP to block the appetite was also accompanied by a failure to block FURO-NS LHSS deficits. By contrast, SPIRO or RU 28318 significantly reduced saline intake while also abrogating the LHSS deficits that follow either FURO-NS or DOCA-NS treatment.
The sodium depletion produced by our treatment in Experiment 1 was relatively mild, the difference in plasma Na+ as a result of group was not statistically significant. In the previous study from our laboratory (Grippo et al., 2006) which reported even more robust hedonic deficits, a mild, statistically significant sodium depletion was observed. Even in states of marked sodium deficiency, plasma sodium concentration may not be signfiicantly reduced as a likely consequence of the reservoir of sodium residing in bone (Stricker & Wolf, 1969). In other words, reductions in operant performance were not likely due to non-specific disruption of behavior. Also there were no significant changes in plasma sodium observed in DOCA-treated rats. Plasma potassium, on the other hand was reduced in DOCA-treated animals, however we believe hypokalemia is unlikely to account for hedonic deficits as DOCA-WS and DOCA-NS both had reduced PK+, but only DOCA-NS exhibited reduced responding for LHSS. Also, no differences in PK+ were found in FURO-NS rats despite similar changes in LHSS behavior as the DOCA-NS group.
One question that remains is what accounted for the high saline intake in the FURO+CAP-WS group if CAP reduced ALDO levels and presumably decreased the formation of ANG II? In our protocol once-daily injections of high-dose CAP (100 mg/kg) were given and in the 24 hour period between injections CAP levels likely declined and CAP was eliminated from the systemic circulation thereby potentially masking any relatively acute effects it may have had on sodium appetite. CAP treatment has been shown to reduce saline intake in rats in acute tests when CAP is given relatively near to the onset of the sodium appetite test (Ruhf et al., 2001; Thunhorst & Johnson, 1994). In the current study, 24 hour water and saline intakes were assessed as 24 hour totals, leaving open the possibility that at some point during that period thirst and/or sodium appetite was indeed suppressed, but the effect was masked in our protocol. A better strategy may have been to chronically infuse CAP via osmotic minipumps. It has been shown repeatedly that low-dose CAP actually enhances water and saline intake in FURO-depleted rats, most likely by increasing the delivery of ANG I to the brain where it is converted to ANG II by a putative brain RAAS (Fitzsimons, 1998; Ruhf et al., 2001; Thunhorst & Johnson, 1994). It can be speculated that something akin to this occurs as CAP is eliminated from the circulation and plasma levels fall. That is, an initial blockade of ANG II formation due to inhibition of convering enzyme by CAP causes an increase in ANG I in the circulation which ultimately overcomes converting enzyme inhibition as systemic levels of CAP fall, thereby enhancing saline intake at some time point over the 24 hour period.
CAP-induced decreases in ALDO secretion have been shown in clinical settings, although this effect is attenuated over time and ALDO is ultimately increased as early as 1 month after starting CAP treatment (Lijnen, Staessen, Fagard, & Amery, 1982). In the current study, ALDO levels in FURO+CAP-NS rats were only slightly elevated from controls, and this increase was not statistically significant. It is expected that CAP reduces a primary stimulus for ALDO secretion (i.e., ANG II). Indirect evidence for this from this study may be the observation that the FURO+CAP-NS group showed the highest levels of PRA, suggesting that the negative feedback effect of ANG II on renin release was decreased.
In humans CAP and SPIRO have been reported to have mood-enhancing effects (Croog et al., 1986; Germain & Chouinard, 1988; Germain & Chouinard, 1989; Wang, Hammarback, Lindhe, & Backstrom, 1995; Zubenko & Nixon, 1984). However, we did not observe any changes in responding for LHSS reward as a result of either CAP or SPIRO treatments alone. There may not be a mechanistic correspondence between enhanced mood in human studies and changes in responsiveness to reward in animal studies, however we expected to observe positive effects on LHSS responding based on previous studies in rats and humans showing putative antidepressant and anxiolytic properties of CAP (Croog et al., 1986; Germain & Chouinard, 1989; Giardina & Ebert, 1989; Wang et al., 1995; Zubenko & Nixon, 1984). It is possible that a different dosing regimen (e.g., chronic, low dose) for CAP may have different effects on LHSS behavior.
Neurobiological mechanisms responsible for chronic unresolved sodium appetite-induced changes in responding for rewarding stimuli are not known. McEwen and coworkers have reported a series of studies that suggest that mesolimbic dopaminergic and opioidergic systems may be involved in sodium appetite (Lucas, Grillo, & McEwen, 2003; Lucas, Pompei, & McEwen, 1999; Lucas, Pompei, & McEwen, 2000). These investigators found that both FURO-induced sodium depletion and DOCA administration for 11 days led to distinct neurochemical and neuropeptidergic profiles in the nucleus accumbens (NAcc), a brain region important for processing rewarding stimuli that were dependent on the availability of saline for ingestion. With no access to saline, sodium-depleted rats and rats that were DOCA-treated showed a decrease in enkephalin mRNA and an increase in dopamine transporter activity throughout the ventral striatum, and particularly in the shell region of the NAcc. The authors concluded that dopaminergic and opioidergic neurotransmission within the ventral striatum associated with reward may be important for salt craving. The authors also hypothesized that animals with a prolonged sodium appetite or animals treated with DOCA without access to saline may be anhedonic due to low levels of dopamine in the NAcc. Changes in dopaminergic neurotransmission within the NAcc as a result of chronic DOCA treatment or sodium depletion without the ability to resolve the appetite via saline ingestion could diminish responding for stimuli that utilize the NAcc as a neural substrate for processing reward related information. In support of this hypothesis, we have recently reported a decrease in Fos-immunocytochemistry in the NAcc in rats made anhedonic via the chronic mild stress paradigm compared to control rats following ingestion of a fixed volume of a palatable sucrose solution suggesting that neural activity in the NAcc may indeed reflect or underlie hedonic deficits in rats (Grippo, Na, Johnson, Beltz, & Johnson, 2004).
DOCA-treated animals that were allowed access to saline showed little change in LHSS behavior, therefore DOCA treatment alone cannot explain the observed hedonic deficits. However the bulk of the evidence from the current studies strongly suggests that the MR plays an important role in the hedonic deficits. Using two models of sodium appetite induction we have shown that MR antagonism, via peripheral or central routes of administration, prevented the development of LHSS deficits. Moreover, acute treatment with RU28318 alone led to leftward shifts in responding for LHSS, and long-term blockade with RU 28318 induced a strong trend toward a reduced mean ECu50. It remains an open question whether purely MC-independent cases of sodium appetite (e.g., after adrenalectomy) induce similar hedonic deficits. Our data are consistent with the recent finding that plasma ALDO levels are increased in depressed patients and also in animal models of depression (Emanuele et al., 2005; Grippo et al., 2005; Murck et al., 2003).
A possible alternative explanation for our results could be that sodium depletion or a chronic sodium appetite acts as a significant stressor, thereby exciting the hypothalamic–pituitary-adrenal (HPA) stress axis. It is well known that the glucocorticoids [e.g., corticosterone (CORT)] bind to MRs in the brain (de Kloet, Vreugdenhil, Oitzl, & Joels, 1998), therefore it is possible that sodium depletion may alter behavior by increasing CORT release via excitation of the HPA axis. Chronic stress or high levels of CORT are associated with depression in a subset of human depressed patients (Nemeroff, 1998; Tafet & Bernardini, 2003). High doses of CORT are also known to have robust effects on behavior in animal models, including hedonic behavior and learning and memory (Barr, Brotto, & Phillips, 2000; de Kloet, Oitzl, & Joels, 1999). While CORT interactions with the MR may have relevance to our behavioral results, they are unlikely to explain the anhedonic effects we have observed, as treatment with CORT has been shown to enhance responding for LHSS, a result that is not consistent with the current study (Barr et al., 2000).
In conclusion, the present work lends further support to the idea that the chronic unresolved motivational state of a sodium appetite has deleterious effects on hedonic state as reflected by changes in reward seeking behavior. Future work should more specifically address the changes in neural systems of reward processing as a result of increased excitation of the RAAS, or chronic sodium appetite.
Acknowledgments
This work was supported in part by grants from the National Heart, Lung, and Blood Institute HL 14388 (AKJ), National Institute of Diabetes and Digestive and Kidney Diseases DK 66086 (AKJ), National Institute of Mental Health MH 80241 (AKJ), and American Heart Association 0615313Z (MJM).
Footnotes
Publisher's Disclaimer: The following manuscript is the final accepted manuscript. It has not been subjected to the final copyediting, fact-checking, and proofreading required for formal publication. It is not the definitive, publisher-authenticated version. The American Psychological Association and its Council of Editors disclaim any responsibility or liabilities for errors or omissions of this manuscript version, any version derived from this manuscript by NIH, or other third parties. The published version is available at www.apa.org/pubs/journals/bne
References
- Barr A, Brotto L, Phillips A. Chronic corticosterone enhances the rewarding effect of hypothalamic self-stimulation in rats. Brain Research. 2000;875:196–201. doi: 10.1016/s0006-8993(00)02652-4. [DOI] [PubMed] [Google Scholar]
- Burniston JG, Saini A, Tan LB, Goldspink DF. Aldosterone induces myocyte apoptosis in the heart and skeletal muscles of rats in vivo. Journal of Molecular and Cellular Cardiology. 2005a;39:395–399. doi: 10.1016/j.yjmcc.2005.04.001. [DOI] [PubMed] [Google Scholar]
- Burniston JG, Saini A, Tan LB, Goldspink DF. Angiotensin II induces apoptosis in vivo in skeletal, as well as cardiac, muscle of the rat. Experimental Physiology. 2005b;90:755–761. doi: 10.1113/expphysiol.2005.030908. [DOI] [PubMed] [Google Scholar]
- Connell JM, Fraser R, Davies E. Disorders of mineralocorticoid synthesis. Best Practice & Research Clinical Endocrinology and Metabolism. 2001;15:43–60. doi: 10.1053/beem.2000.0118. [DOI] [PubMed] [Google Scholar]
- Conover KL, Woodside B, Shizgal P. Effects of sodium depletion on competition and summation between rewarding effects of salt and lateral hypothalamic stimulation in the rat. Behavioral Neuroscience. 1994;108:549–558. doi: 10.1037//0735-7044.108.3.549. [DOI] [PubMed] [Google Scholar]
- Croog SH, Levine S, Testa MA, Brown B, Bulpitt CJ, Jenkins CD, et al. The effects of antihypertensive therapy on the quality of life. New England Journal of Medicine. 1986;314:1657–1664. doi: 10.1056/NEJM198606263142602. [DOI] [PubMed] [Google Scholar]
- de Kloet ER, Oitzl MS, Joels M. Stress and cognition: are corticosteroids good or bad guys? Trends in Neurosciences. 1999;22:422–426. doi: 10.1016/s0166-2236(99)01438-1. [DOI] [PubMed] [Google Scholar]
- de Kloet ER, Vreugdenhil E, Oitzl MS, Joels M. Brain corticosteroid receptor balance in health and disease. Endocrine Reviews. 1998;19:269–301. doi: 10.1210/edrv.19.3.0331. [DOI] [PubMed] [Google Scholar]
- Emanuele E, Geroldi D, Minoretti P, Coen E, Politi P. Increased plasma aldosterone in patients with clinical depression. Archives of Medical Research. 2005;36:544–548. doi: 10.1016/j.arcmed.2005.03.046. [DOI] [PubMed] [Google Scholar]
- Fitzsimons JT. Angiotensin, thirst, and sodium appetite. Physiological Reviews. 1998;78:583–686. doi: 10.1152/physrev.1998.78.3.583. [DOI] [PubMed] [Google Scholar]
- Germain L, Chouinard G. Treatment of recurrent unipolar major depression with captopril. Biological Psychiatry. 1988;23:637–641. doi: 10.1016/0006-3223(88)90010-8. [DOI] [PubMed] [Google Scholar]
- Germain L, Chouinard G. Captopril treatment of major depression with serial measurements of blood cortisol concentrations. Biological Psychiatry. 1989;25:489–493. doi: 10.1016/0006-3223(89)90203-5. [DOI] [PubMed] [Google Scholar]
- Giardina WJ, Ebert DM. Positive effects of captopril in the behavioral despair swim test. Biological Psychiatry. 1989;25:697–702. doi: 10.1016/0006-3223(89)90240-0. [DOI] [PubMed] [Google Scholar]
- Grippo AJ, Francis J, Beltz TG, Felder RB, Johnson AK. Neuroendocrine and cytokine profile of chronic mild stress-induced anhedonia. Physiology & Behavior. 2005;84:697–706. doi: 10.1016/j.physbeh.2005.02.011. [DOI] [PubMed] [Google Scholar]
- Grippo AJ, Moffitt JA, Beltz TG, Johnson AK. Reduced hedonic behavior and altered cardiovascular function induced by mild sodium depletion in rats. Behavioral Neuroscience. 2006;99:758–766. doi: 10.1037/0735-7044.120.5.1133. [DOI] [PubMed] [Google Scholar]
- Grippo AJ, Na ES, Johnson RF, Beltz TG, Johnson AK. Sucrose ingestion elicits reduced Fos expression in the nucleus accumbens of anhedonic rats. Brain Research. 2004;1019:259–264. doi: 10.1016/j.brainres.2004.05.019. [DOI] [PubMed] [Google Scholar]
- Jin L, Beswick RA, Yamamoto T, Palmer T, Taylor TA, Pollock JS, et al. Increased reactive oxygen species contributes to kidney injury in mineralocorticoid hypertensive rats. Journal of Physiology and Pharmacology. 2006;57:343–357. [PubMed] [Google Scholar]
- Johnson AK, Grippo AJ. Sadness and broken hearts: neurohumoral mechanisms and co-morbidity of ischemic heart disease and psychological depression. Journal of Physiology and Pharmacology. 2006;57(Suppl 11):5–29. [PubMed] [Google Scholar]
- Joynt KE, Whellan DJ, O’Connor CM. Depression and cardiovascular disease: mechanisms of interaction. Biological Psychiatry. 2003;54:248–261. doi: 10.1016/s0006-3223(03)00568-7. [DOI] [PubMed] [Google Scholar]
- Khurshid KA, Weaver ME. Conn’s syndrome presenting as depression. American Journal of Psychiatry. 2005;162:1226. doi: 10.1176/appi.ajp.162.6.1226. [DOI] [PubMed] [Google Scholar]
- Lijnen P, Staessen J, Fagard R, Amery A. Increase in plasma aldosterone during prolonged captopril treatment. American Journal of Cardiology. 1982;49:1561–1563. doi: 10.1016/0002-9149(82)90390-3. [DOI] [PubMed] [Google Scholar]
- Lucas LR, Grillo CA, McEwen BS. Involvement of mesolimbic structures in short-term sodium depletion: in situ hybridization and ligand-binding analyses. Neuroendocrinology. 2003;77:406–415. doi: 10.1159/000071312. [DOI] [PubMed] [Google Scholar]
- Lucas LR, Pompei P, McEwen BS. Correlates of deoxycorticosterone-induced salt appetite behavior and basal ganglia neurochemistry. Annals of the New York Academy of Sciences. 1999;897:423–428. doi: 10.1111/j.1749-6632.1999.tb07912.x. [DOI] [PubMed] [Google Scholar]
- Lucas LR, Pompei P, McEwen BS. Salt appetite in salt-replete rats: involvement of mesolimbic structures in deoxycorticosterone-induced salt craving behavior. Neuroendocrinology. 2000;71:386–395. doi: 10.1159/000054559. [DOI] [PubMed] [Google Scholar]
- Malinow KC, Lion JR. Hyperaldosteronism (Conn’s disease) presenting as depression. Journal of Clinical Psychiatry. 1979;40:358–359. [PubMed] [Google Scholar]
- Miliaressis E, Rompre PP, Laviolette P, Philippe L, Coulombe D. The curveshift paradigm in self-stimulation. Physiology & Behavior. 1986;37:85–91. doi: 10.1016/0031-9384(86)90388-4. [DOI] [PubMed] [Google Scholar]
- Morris MJ, Na ES, Grippo AJ, Johnson AK. The effects of deoxycorticosterone-induced sodium appetite on hedonic behaviors in the rat. Behavioral Neuroscience. 2006;120:571–579. doi: 10.1037/0735-7044.120.3.571. [DOI] [PubMed] [Google Scholar]
- Murck H, Held K, Ziegenbein M, Kunzel H, Koch K, Steiger A. The rennin-angiotensin-aldosterone system in patients with depression compared to controls--a sleep endocrine study. BMC Psychiatry. 2003;3:15. doi: 10.1186/1471-244X-3-15. [DOI] [PMC free article] [PubMed] [Google Scholar]
- Na ES, Morris MJ, Johnson RF, Beltz TG, Johnson AK. The neural substrates of enhanced salt appetite after repeated sodium depletions. Brain Research. 2007;1171:104–110. doi: 10.1016/j.brainres.2007.07.033. [DOI] [PMC free article] [PubMed] [Google Scholar]
- Nemeroff CB. The neurobiology of depression. Scientific American. 1998;278:42–49. doi: 10.1038/scientificamerican0698-42. [DOI] [PubMed] [Google Scholar]
- Oitzl MS, Fluttert M, Sutanto W, de Kloet ER. Continuous blockade of brain glucocorticoid receptors facilitates spatial learning and memory in rats. European Journal of Neuroscience. 1998;10:3759–3766. doi: 10.1046/j.1460-9568.1998.00381.x. [DOI] [PubMed] [Google Scholar]
- Olds J. Hypothalamic substrates of reward. Physiological Reviews. 1962;42:554–604. doi: 10.1152/physrev.1962.42.4.554. [DOI] [PubMed] [Google Scholar]
- Pietranera L, Saravia F, Gonzalez Deniselle MC, Roig P, Lima A, De Nicola AF. Abnormalities of the hippocampus are similar in deoxycorticosterone acetate-salt hypertensive rats and spontaneously hypertensive rats. Journal of Neuroendocrinology. 2006;18:466–474. doi: 10.1111/j.1365-2826.2006.01436.x. [DOI] [PubMed] [Google Scholar]
- Rocha R, Funder JW. The pathophysiology of aldosterone in the cardiovascular system. Annals of the New York Academy of Sciences. 2002;970:89–100. doi: 10.1111/j.1749-6632.2002.tb04415.x. [DOI] [PubMed] [Google Scholar]
- Ruhf AA, Starbuck EM, Fitts DA. Effects of SFO lesions on salt appetite during multiple sodium depletions. Physiology & Behavior. 2001;74:629–636. doi: 10.1016/s0031-9384(01)00625-4. [DOI] [PubMed] [Google Scholar]
- Sakai RR, Nicolaidis S, Epstein AN. Salt appetite is suppressed by interference with angiotensin II and aldosterone. American Journal of Physiology Regulatory Integrative Comparative Physiology. 1986;251:R762–R768. doi: 10.1152/ajpregu.1986.251.4.R762. [DOI] [PubMed] [Google Scholar]
- Stricker EM, Wolf G. Behavioral control of intravascular fluid volume: thirst and sodium appetite. Annals of the New York Academy of Sciences. 1969;157:553–568. doi: 10.1111/j.1749-6632.1969.tb12907.x. [DOI] [PubMed] [Google Scholar]
- Struthers AD, MacDonald TM. Review of aldosterone- and angiotensin II-induced target organ damage and prevention. Cardiovascular Research. 2004;61:663–670. doi: 10.1016/j.cardiores.2003.11.037. [DOI] [PubMed] [Google Scholar]
- Tafet G, Bernardini R. Psychoneuroendocrinological links between chronic stress and depression. Progress in Neuro-Psychopharmacology and Biological Psychiatry. 2003;27:893–903. doi: 10.1016/S0278-5846(03)00162-3. [DOI] [PubMed] [Google Scholar]
- Thunhorst RL, Johnson AK. Renin-angiotensin, arterial blood pressure, and salt appetite in rats. American Journal of Physiology Regulatory Integrative Comparative Physiology. 1994;266:R458–R465. doi: 10.1152/ajpregu.1994.266.2.R458. [DOI] [PubMed] [Google Scholar]
- Wang M, Hammarback S, Lindhe BA, Backstrom T. Treatment of premenstrual syndrome by spironolactone: a double-blind, placebo-controlled study. Acta Obstetricia et Gynecologica Scandinavica. 1995;74:803–808. doi: 10.3109/00016349509021201. [DOI] [PubMed] [Google Scholar]
- Wolf G. Effect of deoxycorticosterone on sodium appetite of intact and adrenalectomized rats. American Journal of Physiology. 1965;208:1281–1285. doi: 10.1152/ajplegacy.1965.208.6.1281. [DOI] [PubMed] [Google Scholar]
- Zubenko GS, Nixon RA. Mood-elevating effect of captopril in depressed patients. American Journal of Psychiatry. 1984;141:110–111. doi: 10.1176/ajp.141.1.110. [DOI] [PubMed] [Google Scholar]