Abstract
We have studied the contraction and extension of Vorticella convallaria and its mechanical properties with a microfluidic loading system. Cells of V. convallaria were injected to a microfluidic channel (500 μm in width and 100 μm in height) and loaded by flow up to ∼350 mm s−1. The flow produced a drag force on the order of nanonewton on a typical vorticellid cell body. We gradually increased the loading force on the same V. convallaria specimen and examined its mechanical property and stalk motion of V. convallaria. With greater drag forces, the contraction distance linearly decreased; the contracted length was close to around 90% of the stretched length. We estimated the drag force on Vorticella in the channel by calculating the force on a sphere in a linear shear flow.
INTRODUCTION
Miniaturization and integration of microelectromechanical systems (MEMS) and micrototal analytical systems have undergone remarkable progress in recent years. There still remain, however, some issues; the systems require an additional, comparatively large-scale, external supporting system, which makes further miniaturization difficult. Biological actuators, which are integrated into MEMS, are a promising solution to the problem because they can collect chemical energy from solution and perform a task. Several microsystems based on biological actuators1, 2, 3, 4 have been proposed. Some researchers have demonstrated micropumps driven by a cardiomyocyte cell sheet2 or bacteria.3 Here we propose another type of actuator, from a sessile peritrich ciliate, Vorticella. It has two primary actuators: spasmoneme and cilium.
Vorticella is composed of a cell body (known as the zooid, ∼30–40 μm in diameter) and a long slender stalk (∼100–200 μm in length and 2–3 μm in diameter). A ring of cilia surrounds the oral region of the cell body for feeding. One end of the stalk is tethered to a substrate by a natural adhesive that is secreted by the cell. The stalk is capable of shrinking down to 14% of its initial length5 by coiling into a helix.6 Within the stalk’s outer elastic sheath, the spasmoneme is placed helically and responsible for the contraction of the stalk. Vorticella spasmoneme is one of the fastest actuators for its size. Living Vorticella contracts extremely rapidly, either spontaneously or if stimulated mechanically; the maximum contraction velocity7, 8 is ∼5–10 cm s−1.
Fundamental actions of Vorticella actuators, such as generation of mechanical forces, must be examined for optimizing microsystems powered by Vorticella. For the application of cilium as a micromixer, the authors measured the three dimensional flow generated by cilia with micro-particle image velocimetry setup.9 Fundamental properties of spasmoneme must also be characterized for controlling spasmoneme.
Both live and glycerinated states of Vorticella have been characterized. For glycerinated cell, Moriyama et al.10 measured the traction forces of Vorticella with a glass needle. The maximum isometric tension of Vorticella convallaria is 4×10⁻⁸ N. For live cell measurement, high speed video acquisition is the primary means of characterizing the contraction because the rapid movement of Vorticella is not readily amenable to other methods of study.5, 7, 8 Jones et al.5 obtained high speed images of Vorticella difficilis and measured its contraction speed and length change. Moriyama et al.7 estimated the maximum tension as 5.58×10⁻⁸ N. Upadhyaya et al.8 measured contraction dynamics such as speed, force, and energy of live Vorticella in various viscous solutions. An external load has not been imposed upon live Vorticella due to the difficulties presented by the rapid movements and relatively large displacements Vorticella undergo. Loading a nanonewton force to live Vorticella and characterizing their mechanical properties are difficult and have not been conducted yet.
Here, we propose a method for loading Vorticella by flow in a poly(dimethylsiloxane) (PDMS) microfluidic channel. Microfluidic chips are used for real-time study of cellular activity11 and characterization of cell mechanics.12 It is (1) able to generate a high speed flow with a compact setup, (2) biocompatible, and (3) easy to fabricate. Although microscale fluid flow systems are used for inducing shear force on endothelial cells,13, 14 these loading systems have not been applied to Vorticella. We imposed an external load to cells of Vorticella by changing flow rates in the microfluidic device. We measured changes in length and motion of Vorticella under loading and estimated drag forces on the sample. We examined contraction, extension, and mechanical properties of Vorticella.
METHOD
Device fabrication
The microfluidic chip shown in Fig. 1a was fabricated using a standard replica molding method.15 A negative tone photoresist (SU-8 50, Microchem Corp., Newton, MA) was spin-coated onto a silicon wafer at 1000 rpm. The resist was patterned with a photolithography. A mixture of 10:1 PDMS prepolymer and curing agent (Dow Corning Toray, Sylgard 184, Tokyo, Japan) was poured over the SU-8 mold and cured at 80 °C in an oven. The microchannel dimensions are 500 μm in width, 100 μm in height, and 30 mm in length. We punched out holes with 1.5 mm diameter for the inlet and outlet to which silicone tubes (inner diameter of 1.0 mm and outer diameter of 2.0 mm) were connected. The PDMS chip was treated with air plasma in a plasma cleaner (PDC-001, Harrick plasma Harrick, Ithaca, NY) for 30 s. The chip was permanently bonded to a coverslip (NEO microcover glass, 24×60 mm2, No. 1: with 0.12–0.17 mm2 thickness, Matsunami, Japan). Enriched cells were prepared and injected to the device.
Figure 1.
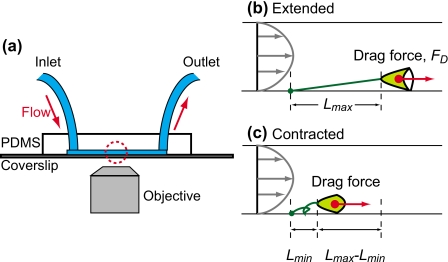
(a) A schematic of the measurement setup and the microfluidic device. V. convallaria was loaded by a generated flow. The horizontal lengths of (b) extended and (c) contracted V. convallaria were observed with the inverted microscope.
Cell preparation
Vorticella was purified and enriched based on the method developed by Vacchiano et al.16Vorticella convallaria was cultured in a one litter flask containing medium with bacteria at 20 °C. The medium was prepared by autoclaving 2.0 g l−1 of Wheat Grass Powder (Pines International, Inc., Lawrence, KS), filtering, and autoclaving again. The flask was shaken at 100 rpm for 24 h, and the cells were detached from the surface. The cell suspension was transferred to Petri dishes. We waited for 6 h until the cells of V. convallaria adhered to the Petri dishes, then exchanged the medium for spring water (Morinomizu, pH 7.0, Na is 12.5 mg l−1, Ca is 8.5 mg l−1, K is 1.0 mg l−1, and Mg is 2.9 mg l−1, Coca-Cola Japan, Japan). Subsequently the cells were shaved from the surface with a cell scraper (No. 3008, Corning, NY). The spring water containing the cells was transferred to a centrifuge tube. We centrifuged the cells at 3000 g for 10 min and discarded the supernatant. The enriched cells were injected into the flow channel through the outlet of the device, and the entire device was kept at 20 °C. 1 day after the injection, we observed the cells adhered in the microfluidic channel.
Flow rate control and cell loading
In the microfluidic channel, the cells were loaded by a generated flow at room temperature (∼25 °C), while V. convallaria spontaneously contracted and extended [Figs. 1b, 1c]. The spring water was injected to the device from a 20 ml syringe with a syringe pump (KDS210, KD Scientific, Boston, MA). Flow rate was controlled in the range of 0–1600 μl min−1. We increased flow rate in a stepwise fashion for measuring the length of the cell body and stalk.
Data acquisition
We used an inverted microscope (IX71, Olympus, Japan) with a 10× (UPlanSApo, NA=0.40, Olympus, Japan) or 40× (UPlanSApo, NA=0.95, Olympus, Japan) objective lenses for the observation. The experiments were monitored with an electron multiplying charge-coupled device (CCD) camera (Cascade II:512, 512×512 pixel, Photometrics, AZ), controlled by METAMORPH imaging software (Universal Imaging Corp., Downingtown, PA). 10 s after the syringe pump was started, we began to acquire images with an exposure time of 30 or 40 ms. We measured the lengths of stalk and zooid using IMAGEJ software. For the tensile loading experiment, we excluded samples which were located less than 100 μm away from either the channel wall or other cells. A cell on the sidewall of the PDMS microchannel was examined to study the position of its cell body against the channel surface. Results were analyzed statistically using GRAPHPAD PRISM (GRAPHPAD software Inc., CA).
RESULTS AND DISCUSSIONS
Adherence and alignment of V. convallaria in a microfluidic channel
V. convallaria spontaneously adhered to a glass or PDMS surface within 1 day after injection of floating cells. After unadhered cells were flushed away, cell densities were 3–100 cells mm−2. Note that no special protein coating was applied for adhesion of V. convallaria. The adhesion of the cells was strong enough to load the cell. We did not observe breakage of the adhesive pad during experiment.
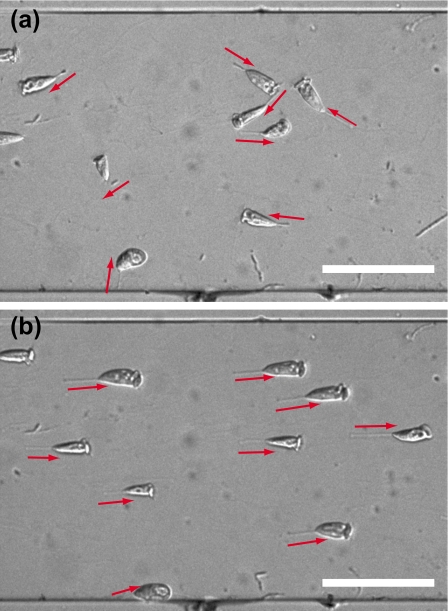
The flow aligned the cell direction and made the cells locate parallel to the flow. Without the flow, the directions of the stalks had no preferred orientation in a microfluidic channel, as shown in Fig. 2a. V. convallaria moved their cell bodies in accordance with cilia and stalk motion. The cells aligned to the flow direction for a flow rate of 100 μl min−1. An image of cells at 100 μl min−1 is shown in Fig. 2b. The apparent horizontal lengths in the microscope image became larger with flow than without flow, which represents zooids and stalks aligning parallel to the surface.
Figure 2.
Microscope images of approximately 10 cells of Vorticella in a microfluidic channel at (a) 0 and (b) Q=100 μl min−1. Red arrows denote the direction of a stalk from an adhesive pad to a zooid. The channel width is 500 μm. Scale bars: 200 μm.
Contraction, extension, and cell stretching of V. convallaria
Figure 3 shows the flow effect on contraction, extension, and shape of V. convallaria. Zooids were stretched by drag forces, and the lengths of zooids increased. The bell-shaped zooid became spherical when it contracted, as shown in Figs. 3a, 3b and videos (enhanced). The length changes of the zooid during contraction and extension gradually increased to ∼20–40 μm for flow rates between 100 and 1100 μl min−1. The zooids completed their contractions within the time frame of 30 or 40 ms. The lengths of stretched stalks appeared to stay constant. The lengths of contracted stalks, however, gradually decreased with higher flow rate. At flow rate of 100 μl min−1, the stalk became coiling when it contracted. At 500 μl min−1, the stalk only partially contracted. At 950 μl min−1, the stalk showed slight coiling.
Figure 3.
Micrographs of Vorticella contraction and extension at flow rates of (a) 100 and (b) 950 μl min−1. Videos of the movements are available. Scale bars: 50 μm. Time series of length change of a stalk and zooid at (c) 100, (d) 500, (e) 950, and (f) 1100 μl min−1. The asterisks in (c) and (d) correspond to the contractions of (a) and (b). Dashed line in (f) represents the time when breakage arises (enhanced online).
Zooid contraction became synchronized with stalk contraction, when the flow rate was relatively low and the duration between each contraction was greater than approximately 10 s, that is, less than approximately 6 times∕min. A zooid contracted six times in synchronization with the contraction of a stalk at 100 and 500 μl min−1 [Figs. 3c, 3d]. At higher flow rates, the zooid contracted, but the stalk showed only slight contraction, and these contractions were not synchronized. At 950 μl min−1, the stalk contracted four times, while the zooid contracted eight times.
Flow induced contraction of V. convallaria. The average cell contraction frequency was less than 1 contraction∕min without a generated flow. The average cell contraction frequency increased to several contractions per minute for flow rates above 100 μl min−1. The physical cause of V. convallaria contraction is the mechanical stimulus offered by fluid flow. Vorticella contracts in response to a mechanical stimulus to a zooid.17 The cellular membranes were deformed under flow, and the contractions were evoked by the mechanism.
Deformation and breakage of V. convallaria
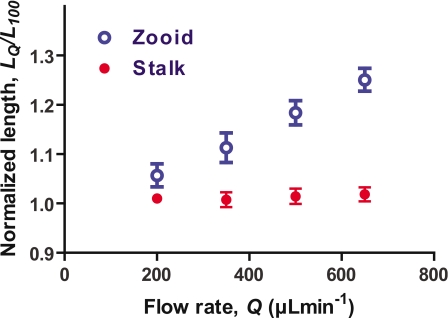
We measured the lengths of stretched zooids and stalks to characterize the mechanical properties of V. convallaria. Figure 4 depicts the effect of flow on deformation of stalks and zooids for seven samples. The lengths for each flow rate were normalized to the zooid and stalk lengths at 100 μl min−1. The zooid appears to be more flexible than the stalk. The maximum lengths of stalk remained almost constant for flow rates between 100 and 650 μl min−1, whereas the maximum lengths of the zooids gradually increased with higher flow rate. The average length at 650 μl min−1 was 1.25 times larger than the length at 100 μl min−1. The maximum length of the stretched zooid increased from 64 μm at 100 μl min−1 to 76 μm at 500 μl min−1 in the case of Fig. 3. The length of the stretched stalk changed slightly from 66 μm at 100 μl min−1 to 68 μm at 500 μl min−1. Our results correspond to the fact that cells change the shape and size due to a flow rate imposed in a microfluidic channel.18
Figure 4.
Change in length of vorticellid zooid and stalk by flow. Normalized length (n=7) at different flow rates are plotted (average±SEM). Lengths are normalized to the length at 100 μl min−1. The average and standard deviation of lengths of zooids and stalks at 100 μl min−1 are 52±12 and 68±8 μm, respectively.
Breakage of a stalk occurred at the junction of zooid and stalk (n=20). Spasmoneme inside a stalk was ruptured by flow at the start of breakage. Then the outer sheath of the stalk broke off. The zooid was subsequently flushed away from the stalk by the flow. Both the stalk and adhesive pad remained anchored to the surface. The adhesive strength of the pad was stronger than the strength of the stalk. The breakage probability depended on both of flow rate and loading time. The breakage began to occur in the flow rate ranges of 500 and 600 μl min−1, and the number of breakages increased with higher flow rates. Longer loading increased breakage probability. We assume that the breakage by flow is induced by mechanical force rather than spontaneous excision of V. convallaria because we did not observe morphological changes such as partial resorption of oral cilia and generation of aboral ciliary wreath. These morphological changes typically occur when environmental conditions deteriorate drastically.19 The occurrence of breakage at the junction between stalk and zooid can be explained by the elasticity of the stalk and the propagation time difference of contraction. Contraction begins at the body and travels down the stalk.5, 8 Therefore the part of the stalk nearest the zooid is the first to receive the strongest force before breakage of other parts can arise.
Decrease in stalk contraction
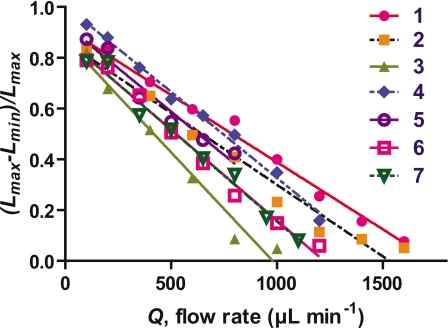
Figure 5 shows a decrease in stalk contractions as loading flow increases. Here we define a normalized contraction ratio, (Lmax−Lmin)∕Lmax, where Lmax is the horizontal length of a stalk just before contraction and Lmin is the horizontal length of the stalk just after the contraction [Figs. 1b, 1c]. With higher flow rate, normalized contraction ratios decrease almost linearly and become almost zero. Data collected for the Vorticella studied in Fig. 3 are plotted as (7) in Fig. 5. We calculated estimates of the drag forces on V. covallaria with the dimensions and parameters of the ambient flow.
Figure 5.
Flow rate vs normalized contraction ratio, (Lmax−Lmin)∕Lmax. The lengths of each stretched stalk at 100 μl min−1 are (1) 68 μm, (2) 34 μm, (3) 63 μm, (4) 51 μm, (5) 47 μm, (6) 95 μm, and (7) 66 μm.
Ambient flow around V. convallaria in the microfluidic channel
We characterized the ambient flow around V. convallaria to estimate the drag force on V. convallaria. In our experiment, the cells of V. convallaria were placed in a parabolic flow profile, because (1) the Reynolds number for the channel is less than 2300, (2) flow is driven by pressure, and (3) the fluid is a noncompressive Newtonian fluid. For the flow velocity of parallel plate channels, the longitudinal velocity component, u(y), is given as
| (1) |
where y is the height of the channel, h is the height of the channel, w is the width of the channel, and Q is the flow rate.
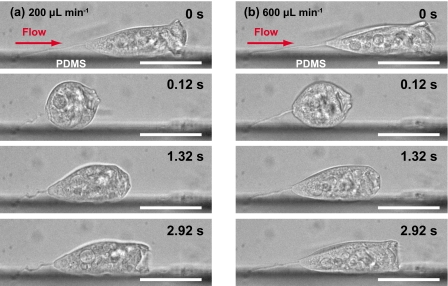
Since flow speed is determined by the height of a cell from the wall, we observed Vorticella on a sidewall of the PDMS channel. The observation of this specimen on the sidewall is similar to V. convallaria on a coverslip because physical condition is similar, that is, flow speed is slower near the sidewall than in the middle part of a channel. The cell did not touch the wall without flow. When flow started, the cell approached the wall and touched it. Figure 6 shows the position of V. convallaria whose stalk adhered to a PDMS surface during a contraction and extension at different flow rates. V. convallaria was pressed against the wall. We defined the height of the center of zooid from the channel as a half of zooid diameter, d∕2.
Figure 6.
Micrographs of V. convallaria contraction and extension for a specimen whose stalk adhered to a sidewall at (a) 200 and (b) 600 μl min−1. Scale bars: 50 μm.
We calculated flow speed using Eq. 1 and obtained the Reynolds number of V. convallaria, which is given by Re=ρUcd∕μ, where ρ is the density of the water at 25 °C, 997 kg m3, Uc is the undisturbed shear flow velocity at the center of zooid, μ is the dynamic viscosity of water at 25 °C, 8.90×10⁻⁴ Pa s, Uc is the flow speed at the center of the cell, and d is the diameter of cell. When d is 25 μm, Uc and Re range 20–350 mm s−1 and 0.6–10, respectively.
Estimation of drag force on V. convallaria
The drag force on Vorticella in the channel was estimated by calculating the force on a sphere in a linear shear flow. We assumed that (1) a parabolic flow can be approximated by a linear shear flow around V. convallaria and (2) a zooid can be represented by a sphere. Then, the drag force is given by , where ρ is the density of the fluid, Uc is the undisturbed shear flow velocity at the sphere’s center, CD is the drag coefficient as explained below, and A is the cross-sectional area of the sphere normal to the flow. For Vorticella, we obtain A=πd2∕4, where d is the maximum diameter of a zooid.
The problem of calculating a drag force on a sphere close to a wall in a linear shear flow in the zero Reynolds number Stokes limit was solved analytically by Goldman et al.20 For a sphere touching the wall, an asymptotic solution of the Stokes equation predicts the drag coefficient, CD, to be 24(1+0.7005)∕Re, where Re is based on sphere diameter and undisturbed shear flow velocity at the sphere’s center. That means the combined effect of shear and the wall is to increase the drag by about 70%. Their result is only applicable when the Reynolds number is sufficiently small. Therefore, we used CD that the wall effect was accounted by Zeng et al.21 They extended the results of Goldman et al. to Re<250, and obtained the following fitting equation:
| (2) |
Based on Eq. 2, we calculated typical values of each parameter (Table 1). At Q=1600 μl min−1, Uc and FD are 350 mm∕s and 198 nN, respectively.
Table 1.
Estimation of characteristic parameters and drag forces for a zooid 25 μm in diameter: flow rate Q, velocity through the center of the sphere Uc, Reynolds number Re, drag coefficient CD, and drag force FD.
| Q (μl min−1) | Uc (mm s−1) | Re | CD | FD (nN) |
|---|---|---|---|---|
| 100 | 22 | 0.6 | 71.4 | 8 |
| 200 | 44 | 1.2 | 37.4 | 18 |
| 300 | 66 | 1.8 | 25.9 | 27 |
| 500 | 109 | 3.1 | 16.5 | 49 |
| 600 | 131 | 3.7 | 14.2 | 60 |
| 900 | 197 | 5.5 | 10.2 | 97 |
| 1200 | 263 | 7.3 | 8.1 | 138 |
| 1600 | 350 | 9.8 | 6.6 | 198 |
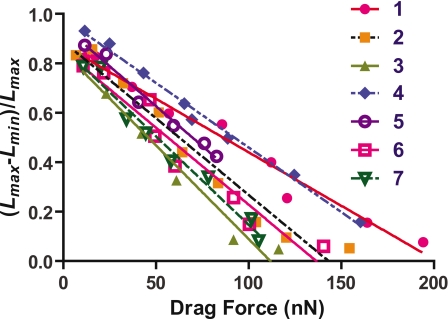
We related the flow rates of in our experiments to the estimated drag forces. The flow of 100 μl min−1 aligned the cell bodies of Vorticella parallel to the flow in Fig. 2. The drag force is ∼10 nN at this flow rate. For the flow rate ranges of 100 and 650 μl min−1, as shown in Fig. 4, correspond to ∼10–70 nN. In the flow rate range in which breakage was first observed, 500–600 μl min−1, the drag force is ∼50 nN.
Changes in stalk contraction due to drag force
We calculated drag forces based on the cell diameter just before contraction at each flow rate (Fig. 7). Normalized stalk length versus flow rate (Fig. 5) and drag force (Fig. 7) have the same trend. The stalk was coiled and packed into 10% of the initial length in the absence of a flow. As the flow rate and therefore drag force increase, normalized length linearly decreases and became 90% of the initial length. Stalk length data exhibit more variability at higher flow rates. Regression lines for the data sets are given by y=y0(1−x∕x0), where x is the drag force, y is the stalk length normalized to its maximum length, and x0 and y0 are coefficient values; x0=(1.5±0.3)×102 nN and y0=0.89±0.05 (average±S.D.; n=7). Here, x0 corresponds to the isometric tension of the stalk. y0 represents the maximum shortening ratio. According to the results of Upadhyaya et al.,8V. convallaria produced the maximum instantaneous force of ∼100 nN at ∼30 cP during contraction. Our results indicate that V. convallaria generates the contractile force above 100 nN during and after contraction.
Figure 7.
Drag force vs normalized contraction ratio, Lmax−Lmin∕Lmax. The lengths of each stretched stalk at 100 μl min−1 are (1) 68 μm, (2) 34 μm, (3) 63 μm, (4) 51 μm, (5) 47 μm, (6) 95 μm, and (7) 66 μm.
The drag forces on V. convallaria at higher flow rates are almost identical to the force exerted by the stalk. The flow speed of 30 cm s−1 is higher than the maximum contraction speed up to 10 cm s−1.7, 8 This maximum speed was obtained while Vorticella fully contracted without an external load. Therefore, the speed associated with the stalk motion is smaller than ∼30% of the flow speed.
These results suggest that FD×ΔL=const., where ΔL is the length change of a stalk, and Vorticella contraction is the constant for each sample, and Vorticella contraction is an energy limited contraction. The stored energy is on the order of ∼103 nN μm, which is of the same order as the time integral of the power dissipated during contraction.8
CONCLUSIONS
We examined the contraction, extension, and mechanical properties of V. convallaria in a microfluidic channel under loading by flow. The loads induced by flow were estimated. Contraction, extension, and shape of V. convallaria changed in the presence of a generated flow. The zooid appears to be more flexible than the stalk. The average length of zooids at 650 μl min−1 (∼70 nN) was 1.25 times longer than the length at 100 μl min−1 (∼10 nN), while the average relative length of stalks was 1.0 in the range of 100–650 μl min−1. The contraction force of V. convallaria was characterized by the application of drag force upon the cell. The maximum shortening length of a stalk is 11±5% of the initial length at 100 μl min−1 (∼10 nN). As drag force increases, normalized length linearly decreases and reaches 90% of the initial length. The zooid contracted, but the stalk showed slight contraction. The isometric tension is (1.5±0.3)×102 nN. These results suggest that Vorticella contraction is limited by its stored energy, which is on the order of ∼103 nN μm. The stalk and zooid junction started to rupture in the ranges of 500 and 600 μl min−1 (∼50 nN).
We plan to design a microsystem driven by a Vorticella stalk based on this study. The force necessary to drive a microsystem should be less than the contraction force of stalks. The loading force on a single stalk to achieve a displacement of 50% of the initial length of a stretched stalk is ∼70 nN. A microsystem powered by Vorticella will be realized by a biointegration technique we developed22 and microfabrication processes.
ACKNOWLEDGMENTS
M. Nagai acknowledges the financial support from the University of Tokyo, under the Global COE Program “Secure-Life Electronics.” We wish to thank Dr. Sangjin Ryu at the Brown University for useful discussion. We would also like to thank Paul Matsudaira and his research group for kindly supplying the Vorticella convallaria. The authors acknowledge Dr. Albert Liau for critical reading of the manuscript. We would also like to acknowledge Mr. Oishi Masamichi for hydrodynamic analysis. The photomask was fabricated using the electron beam lithography apparatus of the VLSI Design and Education Center (VDEC) of the University of Tokyo.
References
- Hiratsuka Y., Miyata M., Tada T., and Uyeda T. Q., Proc. Natl. Acad. Sci. U.S.A. 103, 13618 (2006). 10.1073/pnas.0604122103 [DOI] [PMC free article] [PubMed] [Google Scholar]
- Tanaka Y., Morishima K., Shimizu T., Kikuchi A., Yamato M., Okano T., and Kitamori T., Lab Chip 6, 362 (2006). 10.1039/b515149j [DOI] [PubMed] [Google Scholar]
- Kim M. J. and Breuer K. S., Small 4, 111 (2008). 10.1002/smll.200700641 [DOI] [PubMed] [Google Scholar]
- Weibel D. B., Garstecki P., Ryan D., Diluzio W. R., Mayer M., Seto J. E., and Whitesides G. M., Proc. Natl. Acad. Sci. U.S.A. 102, 11963 (2005). 10.1073/pnas.0505481102 [DOI] [PMC free article] [PubMed] [Google Scholar]
- Jones A. R., Jahn T. L., and Fonseca J. R., J. Cell. Comp. Physiol. 75, 9 (1970). 10.1002/jcp.1040750103 [DOI] [Google Scholar]
- Amos W. B., Nature (London) 229, 127 (1971). 10.1038/229127a0 [DOI] [PubMed] [Google Scholar]
- Moriyama Y., Hiyama S., and Asai H., Biophys. J. 74, 487 (1998). 10.1016/S0006-3495(98)77806-3 [DOI] [PMC free article] [PubMed] [Google Scholar]
- Upadhyaya A., Baraban M., Wong J., Matsudaira P., van Oudenaarden A., and Mahadevan L., Biophys. J. 94, 265 (2008). 10.1529/biophysj.107.108852 [DOI] [PMC free article] [PubMed] [Google Scholar]
- Nagai M., Oishi M., Oshima M., Asai H., and Fujita H., Biomicrofluidics 3, 014105 (2009). 10.1063/1.3105106 [DOI] [PMC free article] [PubMed] [Google Scholar]
- Moriyama Y., Yasuda K., Ishiwata S., and Asai H., Cell Motil. Cytoskeleton 34, 271 (1996). [DOI] [PubMed] [Google Scholar]
- Dai W., Zheng Y., Luo K. Q., and Wu H., Biomicrofluidics 4, 024101 (2010). 10.1063/1.3398319 [DOI] [PMC free article] [PubMed] [Google Scholar]
- Vanapalli S. A., Duits M. H. G., and Mugele F., Biomicrofluidics 3, 012006 (2009). 10.1063/1.3067820 [DOI] [PMC free article] [PubMed] [Google Scholar]
- Young E. W. K. and Simmons C. A., Lab Chip 10, 143 (2010). 10.1039/b913390a [DOI] [PubMed] [Google Scholar]
- van der Meer A. D., Poot A. A., Feijen J., and Vermes I., Biomicrofluidics 4, 011103 (2010). 10.1063/1.3366720 [DOI] [PMC free article] [PubMed] [Google Scholar]
- Xia Y. N. and Whitesides G. M., Annu. Rev. Mater. Sci. 28, 153 (1998). 10.1146/annurev.matsci.28.1.153 [DOI] [Google Scholar]
- Vacchiano E. J., Kut J. L., Wyatt M. L., and Buhse H. E., J. Protozool 38, 608 (1991). [Google Scholar]
- Katoh K. and Naitoh Y., J. Exp. Biol. 168, 253 (1992). [Google Scholar]
- Chiavaroli S., Newport D., and Woulfe B., Biomicrofluidics 4, 024110 (2010). 10.1063/1.3380598 [DOI] [PMC free article] [PubMed] [Google Scholar]
- De Baufer P. J., Amin A. A., Pak S. C., and H. E.Buhse, Jr., J. Eukaryot Microbiol. 46, 12 (1999). 10.1111/j.1550-7408.1999.tb04574.x [DOI] [Google Scholar]
- Goldman A. J., Cox R. G., and Brenner H., Chem. Eng. Sci. 22, 653 (1967). 10.1016/0009-2509(67)80048-4 [DOI] [Google Scholar]
- Zeng L., Najjar F., Balachandar S., and Fischer P., Phys. Fluids 21, 033302 (2009). 10.1063/1.3082232 [DOI] [Google Scholar]
- Nagai M., Kumemura M., Asai H., and Fujita H., e-J. Surf. Sci. Nanotechnol. 7, 673 (2009). 10.1380/ejssnt.2009.673 [DOI] [Google Scholar]


