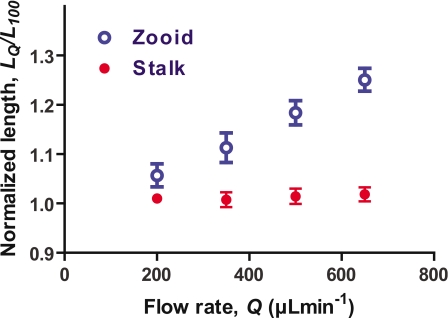
Figure 4.
Change in length of vorticellid zooid and stalk by flow. Normalized length (n=7) at different flow rates are plotted (average±SEM). Lengths are normalized to the length at 100 μl min−1. The average and standard deviation of lengths of zooids and stalks at 100 μl min−1 are 52±12 and 68±8 μm, respectively.

