Abstract
Purpose: The purposes of this study were to validate a discrete spot scanning proton beam nozzle using the Monte Carlo (MC) code MCNPX and use the MC validated model to investigate the effects of a low-dose envelope, which surrounds the beam’s central axis, on measurements of integral depth dose (IDD) profiles.
Methods: An accurate model of the discrete spot scanning beam nozzle from The University of Texas M. D. Anderson Cancer Center (Houston, Texas) was developed on the basis of blueprints provided by the manufacturer of the nozzle. The authors performed simulations of single proton pencil beams of various energies using the standard multiple Coulomb scattering (MCS) algorithm within the MCNPX source code and a new MCS algorithm, which was implemented in the MCNPX source code. The MC models were validated by comparing calculated in-air and in-water lateral profiles and percentage depth dose profiles for single pencil beams with their corresponding measured values. The models were then further tested by comparing the calculated and measured three-dimensional (3-D) dose distributions. Finally, an IDD profile was calculated with different scoring radii to determine the limitations on the use of commercially available plane-parallel ionization chambers to measure IDD.
Results: The distance to agreement, defined as the distance between the nearest positions of two equivalent distributions with the same value of dose, between measured and simulated ranges was within 0.13 cm for both MCS algorithms. For low and intermediate pencil beam energies, the MC simulations using the standard MCS algorithm were in better agreement with measurements. Conversely, the new MCS algorithm produced better results for high-energy single pencil beams. The IDD profile calculated with cylindrical tallies with an area equivalent to the area of the largest commercially available ionization chamber showed up to 7.8% underestimation of the integral dose in certain depths of the IDD profile.
Conclusions: The authors conclude that a combination of MCS algorithms is required to accurately reproduce experimental data of single pencil beams and 3-D dose distributions for the scanning beam nozzle. In addition, the MC simulations showed that because of the low-dose envelope, ionization chambers with radii as large as 4.08 cm are insufficient to accurately measure IDD profiles for a 221.8 MeV pencil beam in the scanning beam nozzle.
Keywords: proton therapy, scanning beam, low-dose envelope, Monte Carlo, MCNPX, validation
INTRODUCTION
Scanning beam techniques using protons and heavier charged particles are becoming increasingly popular because they promise better conformation of dose to the target volume and no need for collimators and compensators, and hence lower neutron contamination compared to the passive scattering beam technique.1, 2, 3, 4, 5, 6, 7, 8
The University of Texas M. D. Anderson Cancer Center Proton Therapy Center, Houston (PTCH) (Houston, Texas) started treating cancer patients with the discrete spot scanning proton beam technique in May 2008.9 In this technique, a narrow proton beam, a so-called “pencil beam,” is scanned laterally by magnetic steering and modulated in depth by manipulating the proton’s kinetic energy to deliver a conformal three-dimensional (3-D) dose to the target volume. 3-D dose distributions are created in a discrete fashion by delivering the dose spot-by-spot. Thus, a single pencil beam is the building block for the creation of 3-D dose distributions. Therefore, for dose calculation purposes, the accuracy of point doses within a 3-D volume is determined by how precisely the model predicts the single pencil beam dose distribution. In this work, the longitudinal position or range of the spot is defined as the point where the integral depth dose (IDD) of a pencil beam falls 90% of the Bragg peak dose. Its location within the target volume is determined by the energy of the pencil beam and the magnetic field strength of the x and y steering magnets.
The scanning beam technique has been used clinically by five other proton and heavier charged-particle treatment facilities, including the Gesellschaft für Schwerionenforschung (GSI), Darmstadt, Germany;10 the Paul Scherrer Institute (PSI), Villigen, Switzerland;11 the Rinecker Proton Therapy Center (RPTC), Munich, Germany; the Francis H. Burr Proton Therapy Center at Massachusetts General Hospital (MGH), Boston, MA and the Heidelberg Ion-Beam Therapy Center (HIT), Heidelberg, Germany. To date, many other proton or heavier charged-particle radiation therapy centers worldwide are under construction or are in the planning stages and many will provide scanning beam capabilities.12 The PTCH uses the Hitachi PROBEAT Delivery System (Hitachi, Ltd., Tokyo, Japan), which delivers doses on a discrete spot-by-spot basis. PSI, RPTC, MGH, and HIT also use the discrete spot scanning technique and the GSI uses the raster scanning technique.
Dose measurements of scanning pencil beams are challenging. Researchers at the PSI found that a low-dose envelope extends far beyond the center of the beam. For a single pencil beam, this dose envelope has a much lower value than the central axis dose and is therefore difficult to measure with standard dosimetric equipment. However, when several pencil beams are scanned over a large volume, the low-dose envelope contributes significantly to the total dose on the central axis, which can be precisely measured. Pedroni et al.13 indirectly assessed the low-dose envelope contribution in the PSI scanning beam nozzle by measuring the local dose in the center of flat-concentric-squared frames as function of depth in water of monoenergetic proton fields. Because of the low-dose envelope, the point dose measured at the central axis depends on the field size (i.e., the number of pencil beams delivered); they concluded that in the PSI nozzle, the low-dose envelope can contribute up to 15% of the total treatment dose.13 Measurements obtained at the PTCH revealed similar dependencies.14
A Monte Carlo (MC) investigation performed by us indicated that the low-dose envelope in the PTCH scanning beam line depends on the energy of the beam. For low-energy pencil beams, the low-dose envelope is mainly due to particles elastically scattered in the beam line components and in the water phantom, accounting for up to 10% of central axis dose for field sizes larger than 10×10 cm2. Conversely, for high-energy pencil beams, the low-dose envelope is mainly dictated by secondary particles produced by inelastic nuclear interactions in the water phantom, accounting for up to 13% of central axis doses for field sizes larger than 10×10 cm2.15
The MC technique provides the necessary physics models to simulate the interaction between radiation and matter. Multipurpose MC systems, including MCNPX,16GEANT4,17 and FLUKA (Ref. 18) have the flexibility to allow the user to use different physics models for a particular interaction. Validated MC models of proton beam lines have demonstrated that these systems are useful for commissioning proton beam lines,19 configuring and validating treatment planning systems (TPSs),20, 21, 22, 23 investigating dosimetric effects such as collimator scattering24, 25 and secondary particle contamination,26, 27, 28 planning treatments,29 and designing new beam lines and beam-modifying devices.20, 30, 31, 32
Contrary to MC simulations, conventional TPSs use analytical expressions to model dose deposition. To address the low-dose envelope in analytical TPSs, developers have used empirical models based on nozzle-specific experimental13 or MC data.33
Treatment fields developed with a TPS consist of the superposition of many spots (up to several thousands) to provide a dose that conforms to the target volume. Because the small differences in a single pencil beam can add up to significant contributions at a point of measurement, the accuracy of TPSs ultimately depends on how well single spots are modeled.
A previous study validated a MC model of the PTCH scanning beam nozzle using GEANT4; this validation using GEANT4 focused on the magnetic steering of the beam and was limited to three pencil beam energies.34 In the current study, we performed a comprehensive validation of a MC model of the PTCH scanning beam nozzle using MCNPX, with emphasis on the low-dose envelope. Our model was validated for various monoenergetic therapeutic pencil beam energies and included validation of 15 pristine Bragg peaks, 17 in-air lateral profiles, and 14 in-water lateral profiles. We assessed the limitations of our MC model by comparing its results to measurements of typical 3-D clinical dose distributions, delivered to a water phantom. Finally, we used our MC model to determine the effect of the low-dose envelope on the measurements of IDD profiles using standard ionization chambers.
METHODS AND MATERIALS
Experimental details
Measurements were performed in a MP3 Phantom (type L981010, PTW-Freiburg, Freiburg, Germany) at a gantry angle of 0°, with the water surface located at the isocenter plane. This standard setup was used throughout this study unless specified otherwise. All measurements were performed in the scanning beam gantry at the PTCH.
Percentage depth dose (PDD) profiles of pencil beams were measured using an ionization chamber with a 4.08 cm radius×0.2 cm long sensitive cylindrical volume (type 34070, PTW-Freiburg). Lateral profiles of pencil beams were measured with PinPoint ionization chambers (type 31014 and 31006, PTW-Freiburg). Note that the ionization chamber type 31006 is discontinued. The new type is now type 31014, which has the same specifications as type 31006. One ionization chamber was used as the reference signal (type 31006) and the other was scanned in steps throughout the lateral profiles. The scanning step sizes were 0.1 cm in the region close to the central axis and 1 cm in the low-dose envelope region. In each step, the integration time of charge collection was 4 s. A more detailed description of the method used to measure lateral profiles of pencil beams can be found elsewhere.14 We used the full widths at half maximum (FWHM), 1% of the maximum (FW0.01M), and 0.1% of the maximum (FW0.001M) to quantify the lateral profiles of the pencil beams. Throughout this study, FWHM, FW0.01M, and FW0.001M experimental data were represented with error bars (one standard deviation of the data) of ±0.14, ±0.5, and ±1 cm, respectively. These uncertainties were derived from ten repeated measurements of in-air lateral profiles of a 221.8 MeV pencil beam.
We also measured PDD and lateral profiles of various 3-D dose distributions, which were composed of stacked layers of quasimonoenergetic square radiation fields. Each energy layer had appropriate weights to generate uniform dose distributions. Because the widths of Bragg peaks in the beam direction are a function of the beam’s energy, different numbers of energy layers were required to uniformly cover the entire volumes in depth. PDD and lateral profiles were measured in four volumes of different sizes but same lateral extent of 10×10 cm2, where the number of energy layers and proximal (dprox, defined as the 90% proximal dose level relative to the Bragg peak dose) and distal (ddis, defined as the 90% distal dose level relative to the Bragg peak dose) depths of each volume is given in Table 1. Together, uniform dose distributions in these volumes required the use of all 94 energies available at the PTCH. At the isocenter plane, these fields used 0.5 cm of lateral spacing between the centers of adjacent spots. Each energy layer encompassed 441 spots. The lateral profiles were measured using PinPoint ionization chambers or Gafchromic EBT film (International Specialty Products, Wayne, NJ) in a plane located at the center between the proximal and distal edges of the volumes. PDD profiles were measured on the central axis using a Markus ionization chamber (type 34045, PTW-Freiburg) and PDD profile data were normalized at the center position between the proximal and distal edges of the dose volumes.
Table 1.
Fields used to create the 3-D dose distributions used in this study. The lateral extent of the fields was 10×10 cm2 and the lateral spacing between the centers of adjacent spots at the isocenter plane was 0.5 cm. dprox: Location of the 90% proximal dose level relative to the Bragg peak dose; ddis: Location of the 90% distal dose level relative to the Bragg peak dose; Eprox: Lowest pencil beam energy; and Edis: Highest pencil beam energy.
| Field | Energy layers | dprox (cm) | ddis (cm) | Eprox (MeV) | Edis (MeV) |
|---|---|---|---|---|---|
| F1 | 36 | 4.0 | 8.1 | 72.5 | 105.2 |
| F2 | 19 | 8.1 | 12.1 | 105.2 | 131.0 |
| F3 | 29 | 10.5 | 20.5 | 121.2 | 176.2 |
| F4 | 19 | 20.5 | 30.6 | 176.2 | 221.8 |
MC model
MC system and transport parameters
The MC system used in this work was MCNPX version 2.7a. The following particles were transported: Protons, neutrons, deuterons, tritons, helium-3 ions, alpha particles, heavy ions, pions, electrons, positrons, and photons. The cutoff energies were 1 MeV for hadrons and 1 keV for electrons, positrons, and photons. As soon as a particle reached the cutoff energy, the transport simulation was terminated and all its remaining kinetic energy was deposited locally. These cutoff energies are justified because 1 MeV protons, which are the most relevant particles in our study, have a residual range in water of approximately 25 μm. Electrons of 1 keV have a residual range in water of approximately 0.1 μm. Thus, because our study is in the millimeter scale, these cutoff energies did not affect the results except that the computation time was decreased.
Multiple Coulomb scattering (MCS) was treated with two algorithms: (i) The MCS algorithm that is implemented in the standard version of MCNPX,35 which we refer as “standard MCS algorithm,” and (ii) a MCS algorithm that incorporates large-angle single scattering events of Molière’s theory,36, 37 which we refer as “new MCS algorithm.” The standard MCS algorithm considers only small angular deflections and neglects higher order terms of Molière’s theory.35, 38, 39 The direction of the particle after each step is sampled from a Gaussian distribution with standard deviation given by the scattering angle32, 36, 37
| (1) |
where β is the speed of the particle relative to the speed of light c, p is the momentum of the particle, ρ is the mass density of the medium, Δ is the step size of the particle, and X0 is the radiation length.
The new MCS algorithm was implemented in the source code of MCNPX, and the code was recompiled to produce the in-house version 2.7a_mcs that was used in this study. The new MCS algorithm was developed by Kuhn and Dodge32, 36, 37 and has previously been implemented in to the MCNPX source code and tested by Stankovskiy et al.32, 36, 37 Details of the implementation of the new MCS algorithm and further discussions can be found in the referred publications. For completeness, we summarize the main features of the new MCS algorithm. In the new MCS algorithm the direction of the particle is sampled from a Gaussian with Rutherford-like tail distribution. Molière’s theory is valid if the true path length Δt of the particle is in the interval
| (2) |
where e is the base of the natural logarithm, χa is the screening angle, v is the velocity of the primary particle, is the mean atomic weight of the material, NA is the Avogadro’s number, α is the fine structure constant, ℏ is Planck’s constant divided by 2π, zp is the charge of the primary particle, fi and Zi are the fraction and charge of isotope i in the material, respectively, and B is a scaling parameter sometimes called the reduced target thickness, interpreted as the effective number of collisions in the scattering medium. Detailed definitions and expressions of B and χa can be found elsewhere.40, 41, 42
If Δt is in the interval given by Eq. 2 and the direction of the particle after each step is sampled from a Gaussian distribution with standard deviation,
| (3) |
where ξ is a random number that satisfies the condition ξ=<1−0.827∕B, , and χc is the characteristic angle.40, 41, 42 In case Δt is smaller than the lower boundary of Eq. 2, then the standard MCS algorithm of MCNPX is used [Eq. 1]. If Δt is larger than the upper boundary of Eq. 2, then the direction of the particle after each step is sampled from a Rutherford-like tail distribution with
| (4) |
where ξ′ is a random number defined as ξ′=P(π)−ξ. P(π) is the total probability of a particle scattering in an angle between 0 and π and is given by
| (5) |
The new MCS algorithm is valid for targets thicker than 1 μm.32, 36, 37
The Vavilov model43 for charged-particle energy straggling was used. Inelastic nuclear interactions were treated with the default option of MCNPX, which includes the pre-equilibrium model after Bertini intranuclear cascade treatment.44, 45
Geometry
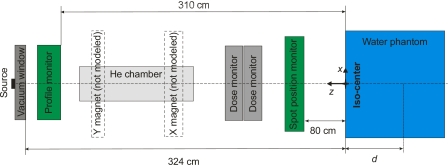
An accurate model of the PTCH discrete spot scanning beam nozzle was implemented using the MC system MCNPX version 2.7a_mcs, according to the blueprints provided by Hitachi, Ltd. (Tokyo, Japan), the manufacturer of the synchrotron and beam delivery system. The model contained a beam pipe titanium vacuum window, a beam profile monitor that consisted of a multiwire ionization chamber, a helium drift chamber, two plane-parallel ionization chambers (main and subdose monitors), and a spot-position monitor that also consisted of a multiwire ionization chamber. This was the same model used by Peterson et al.34 and Sawakuchi et al.,15 except that Peterson et al.34 also modeled the steering magnets in their GEANT4 implementation. The details of the design of each component are the property of Hitachi, Ltd. and cannot be disclosed here. A water phantom was located with its upstream surface at the isocenter plane, 324 cm downstream of the vacuum window of the beam pipe (see Fig. 1). For in-air simulations, an air phantom was used. The origin of our coordinate system is represented in Fig. 1.
Figure 1.
Components of the PTCH proton scanning beam nozzle. The x and y magnets were not used in the MC model described in this study. The beam direction was parallel to the z axis, propagating from positive to negative z axis values. For simulations in water, the position in the beam direction was specified in terms of depth d in the water phantom.
Particle source
The PTCH proton beam is extracted from a synchrotron accelerator, which is capable of accelerating protons with 94 different energies from 72.5 up to 221.8 MeV. Each of the beam energies defines a proton source with certain angular, spatial, and energy distributions on the upstream surface of the titanium vacuum window. Experimentally determining all 94 proton sources’ input parameters for the MC model would be too cumbersome and impractical because it would require disassembling the nozzle, which would interrupt clinical activities. Thus, we used measure in-air lateral profiles for a subset of eight energies and information provided by the manufacturer of the synchrotron to establish input parameters for the 94 sources by interpolation. This interpolation method is justified because course measurements, performed by the manufacture of the accelerator, showed a smooth change in the size of the pencil beam (at the FWHM level) as function of energy.
The initial proton beam energy was modeled using a Gaussian distribution. The FWHM of the Gaussian distribution was 0.25% of the beam’s nominal energy. This value was provided by the manufacturer of the accelerator and was evaluated based on beam size measurements in the beam transport line.
Because of the long drift space of 324 cm that protons travel along the nozzle, from the titanium vacuum window to the isocenter plane, the angular divergence of the proton source is a critical parameter. It is reasonable to assume that the angular divergence introduced by MCS scattering of the primary beam in the titanium vacuum window is much larger than that of the source upstream of the titanium vacuum window. Therefore, we modeled the source upstream of the vacuum window without angular divergence. By assuming a parallel source just upstream of the vacuum window and that scattering in the vacuum window was the main component of the angular divergence of the beam downstream of the vacuum window, we reduced the number of source parameters to be adjusted in our model from four (angular and spatial distributions in x and y) to two (spatial distributions in x and y).
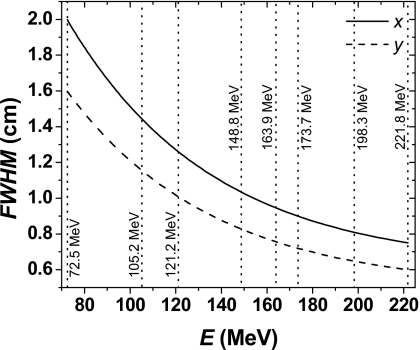
The proton source’s spatial extent was modeled using two orthogonal 1-D Gaussian distributions in the x and y directions. For each of the eight energies, we adjusted the dimensions of the source so that the simulated and measured in-air lateral profiles at the isocenter plane and in different positions downstream and upstream of the isocenter plane matched. We then interpolated the data to determine the dimensions of the sources for the remaining energies. Figure 2 shows the FWHM of the x and y spatial Gaussian distributions of the model sources for our MC simulation with the new MCS algorithm. We also illustrated in Fig. 2 the eight pencil beam energies that we used to adjust the dimensions of the source. The MC model using the standard MCS algorithm required different source parameters to reproduce in-air lateral profile experimental data. Note that the dimensions of the sources used in our MC simulations are free parameters and may not represent the true proton sources. The use of the sources as free parameters is justified because of large uncertainties in our knowledge of the sources and additional uncertainties introduced by the MCS algorithms.
Figure 2.
FWHM of Gaussian distributions used to simulate the spatial distribution of the proton sources using the new MCS algorithm. The full and dashed lines represent the x and y FWHM, respectively. The dotted lines represent the pencil beam energies used to adjust the size of the sources.
3-D dose distributions
The MC models were tested for various 3-D dose distributions consisting of numerous energy layers, as described above. Two files provide the accelerator control system instructions to deliver the spots. These instructions included the energy, weights, and x and y coordinates (in the isocenter coordinate system) of each pencil beam. For pencil beams displaced from the central axis, the strength of the x and y magnetic fields were set to steer the pencil beams accordingly. MCNPX is not capable of transporting particles in magnetic fields; thus, to simulate the delivery of 3-D dose distributions, we used our MC model to obtain the phase space of the pencil beams at the central axis on a virtual surface located at z=253 cm upstream of the isocenter plane, which is at the center between the two magnets. This single focal model is an approximation justified by the convenience to implement it in our MC code, compared to a double focal model. We then used the x and y coordinates available in the beam parameter files to determine the deflection angles of each pencil beam. Finally, we used the translation card provided by MCNPX to rotate the surface of the single-beam phase space so that the beams would be deflected to the x and y coordinates at the isocenter plane, as defined by the beam parameter files. Based on the weights of each pencil beam in a given x and y coordinate, we established a probability distribution of the translation cards to simulate many pencil beams within one energy layer in one run. To simulate entire 3-D dose distributions, the same process was repeated for all energy layers and the results were combined with the appropriated weights.
Tallies
Cylindrical energy deposition tallies of radius 4.08 cm and thickness 0.1 cm were used to score PDD profiles of pencil beams in water. The tallies were located such that their central axes coincided with the z axis (beam axis), from z=0 cm to z=−35 cm (depth of 35 cm in the water phantom). To score in-air and in-water lateral profiles of pencil beams, we used cuboid energy deposition tallies of 0.1×0.5×1 and 0.1×0.5×0.1 cm3 resolutions, respectively. Central axis PDD and lateral profiles of 3-D dose distributions were scored with cylindrical energy deposition tallies of radius 0.25 cm, thickness 0.1 cm, and cuboid energy deposition tallies of 0.1×0.5×0.1 cm3 resolutions, respectively. The sizes of the tallies were selected to match the sensitive area of the ionization chambers used in the measurements as closely as possible.
For pencil beam simulations, the statistical uncertainties in the simulated PDD profiles were below 0.03% up to the 10% dose location in the distal fall-off region of the Bragg peak. For lateral profiles, the statistical uncertainties at FWHM, FW0.01M, and FW0.001M were below 0.4%, 2.8%, and 7.0%, respectively. The statistical uncertainties of energy deposition on the central axis for the 3-D dose distributions simulations were below 0.1% in each energy layer.
To study low doses far from the center of the beam, we used a variance reduction technique called importance sampling in the water phantom volume. The implementation of this technique was thoroughly tested in a previous study by us where we compared the results obtained with and without the technique. We concluded that importance sampling in the water phantom did not affect the results15 except that statistical uncertainties were reduced. Energy deposition was scored in units of energy per volume per source particle (MeV cm−3 p−1) but we represented the results relative to a reference value, thus the units cancelled out.
IDD profiles
We used the MC model with the new MCS algorithm to investigate the effect of the low-dose envelope on measurements of IDD profiles of a 221.8 MeV pencil beam. The IDD profiles were scored using (i) cylindrical tallies that reproduce the sensitive area of the largest commercially available ionization chamber, which has a radius of 4.08 cm; (ii) cylindrical tallies with radius of 10 cm; and (iii) large cuboid tallies with 40×40×0.1 cm3 resolution to assure that all the contribution of the low-dose envelope was scored.
RESULTS
Pencil beam PDD profiles
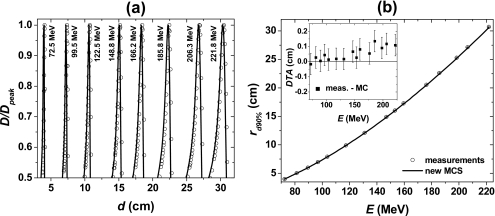
Figure 3a shows the comparison between measured and simulated PDD profiles for pencil beams with energies ranging from 72.5 to 221.8 MeV. The circles and solid lines represent measured and simulated data, respectively. Figure 3b shows the range as a function of pencil beam energy. For low-energy and intermediate-energy pencil beams the distance to agreement (DTA), defined as the distance between the nearest positions of two equivalent distributions with the same value of dose, between measured and simulated ranges was within the experimental uncertainties (±0.07 cm). For pencil beams with energies higher than 159.5 MeV, the DTA was larger than the experimental uncertainties. However, the largest DTA was 0.13 cm. The MC data shown in Fig. 3 were obtained using the new MCS algorithm. Simulations performed with the standard MCS algorithm produced similar results.
Figure 3.
(a) PDD profiles of pencil beams with energies ranging from 72.5 to 221.8 MeV. Simulations were performed using the new MCS algorithm. (b) Range as a function of pencil beam energy. The inset represents the DTA between the measured and simulated ranges (measured-MC). The error bars represent the experimental systematic uncertainty associated with the size of the sensitive volume of the ionization chamber. The circles and solid lines represent measured and simulated data, respectively. D: Dose at depth in water d; Dpeak: Dose at the Bragg peak; rd90%: Range; and E: Beam energy.
Pencil beam in-air lateral profiles
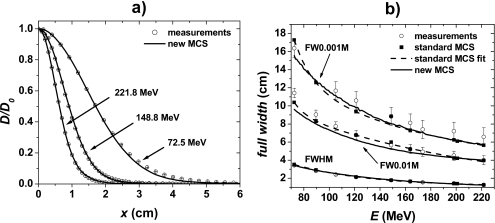
Figure 4a shows in-air half-lateral x profiles at the isocenter plane of pencil beams for the lowest (72.5 MeV), an intermediate (148.8 MeV), and the highest (221.8 MeV) available energies (y lateral profiles showed similar results and are not shown). To quantify the agreement between measured and simulated data, we determined the FWHM, FW0.01M, and FW0.001M as functions of the pencil beam’s energy [Fig. 4b]. Table 2 summarizes the differences (Meas.-MC) between measured and simulated FWHM, FW0.01M and FW0.001M data. Note that the proton sources were adjusted so that simulated in-air lateral profiles reproduced experimental data. Thus, a good agreement between measured and simulated in-air lateral profile data is expected.
Figure 4.
(a) In-air lateral profiles of pencil beams at the isocenter plane for 72.5, 148.8, and 221.8 MeV. The circles and solid lines represent measured and simulated data, respectively. The lateral profiles are normalized to dose at the central axis D0. (b) FWHM, FW0.01M, and FW0.001M of in-air lateral profiles of pencil beams at the isocenter plane as a function of the pencil beam’s energy. The circles represent measured data, the squares and solid line represent simulated data, and the dashed lines represent fits of the standard MCS algorithm simulated data.
Table 2.
Differences between measure and simulated FWHM, FW0.01M, and FW0.001M for in-air lateral profiles at the isocenter plane.
| Width and energy | Meas.-MC (standard MCS) (cm) | Meas.-MC (new MCS) (cm) |
|---|---|---|
| FWHM | <0.1 | <0.1 |
| FW0.01M, E<105.8 MeV | <1.0 | <1.8 |
| FW0.01M, E>105.8 MeV | <0.3 | <0.7 |
| FW0.001M, E<105.8 MeV | <1.0 | <2.8 |
| FW0.001M, E>105.8 MeV | <0.8 | <0.9 |
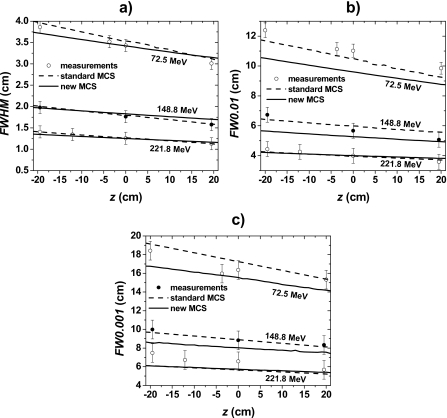
We compared the measured and simulated lateral profiles of pencil beams at various positions z downstream and upstream of the isocenter plane for three different energies. We observed that measured and simulated FWHM data [Fig. 5a] agreed within the experimental uncertainties for both standard and new MCS algorithms. However, the standard MCS algorithm produced better overall agreement than the new MCS algorithm for the FW0.01M [Fig. 5b] and FW0.001M [Fig. 5c]. Table 3 summarizes the differences between measured and simulated data.
Figure 5.
(a) In-air FWHM, FW0.01M, and FW0.001M of pencil beams at positions z upstream and downstream of the isocenter plane for 72.5 MeV (z=19.5, 0.0, −3.7, and −19.5 cm), 148.8 MeV (z=19.5, 0.0, and −19.5 cm), and 221.8 MeV (z=19.5, 0.0, −12.5, and −19.5 cm). The circles and lines represent measured and simulated data, respectively.
Table 3.
Differences between measured and simulated FWHM, FW0.01M, and FW0.001M for in-air lateral profiles at positions z downstream and upstream of the isocenter plane. The differences were obtained from the data represented in Fig. 5. See caption of Fig. 5 for z positions.
| Energy (MeV) | Meas.-MC (standard MCS) (cm) | Meas.-MC (new MCS) (cm) | ||||
|---|---|---|---|---|---|---|
| FWHM | FW0.01M | FW0.001M | FWHM | FW0.01M | FW0.001M | |
| 72.5 | <0.10 | <0.7 | <0.9 | <0.14 | <1.9 | <0.24 |
| 148.8 | <0.03 | <0.5 | <0.3 | <0.12 | <1.0 | <1.4 |
| 221.8 | <0.06 | <0.19 | <1.4 | <0.04 | <0.24 | <1.4 |
Pencil beam in-water lateral profiles as a function of depth
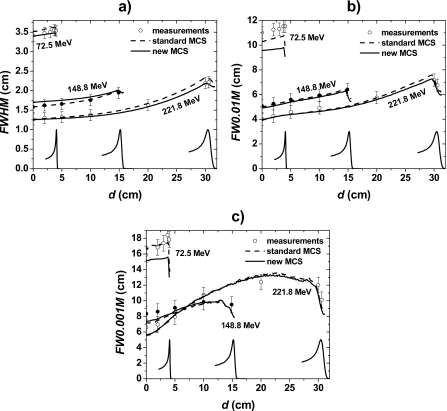
Figure 6 shows FWHM, FW0.01M, and FW0.001M as a function of depth in water for three energies. Table 4 summarizes the differences between measured and simulated data. The MC model with the standard MCS algorithm produced better results for the 72.5 and 148.8 MeV lateral profiles as a function of depth. Conversely, the MC model with the new MCS algorithm produced better results for the 221.8 MeV lateral profiles as a function of depth.
Figure 6.
(a) FWHM, (b) FW0.01M, and (c) FW0.001M for in-water lateral profiles of single pencil beams as a function of depth. The circles and lines represent measured and simulated data, respectively. For 148.8 MeV, the isocenter plane was at a depth of 20 cm in the water phantom, and for 72.5 and 221.8 MeV, the surface of the water phantom was located at the isocenter plane.
Table 4.
Differences between measured and simulated FWHM, FW0.01M, and FW0.001M for in-water lateral profiles at five depths for 72.5 and 148.8 MeV pencil beams and seven depths for the 221.8 MeV pencil beam. The differences were obtained from the data represented in Fig. 6.
| Energy (MeV) | Meas.-MC (standard MCS) (cm) | Meas.-MC (new MCS) (cm) | ||||
|---|---|---|---|---|---|---|
| FWHM | FW0.01M | FW0.001M | FWHM | FW0.01M | FW0.001M | |
| 72.5 | <0.10 | <1.7 | <3.0 | <0.11 | <2.4 | <4.8 |
| 148.8 | <0.05 | <0.31 | <1.2 | <0.12 | <0.46 | <1.0 |
| 221.8 | <0.15 | <0.24 | <1.1 | <0.05 | <0.44 | <1.3 |
In-water 3-D dose distributions
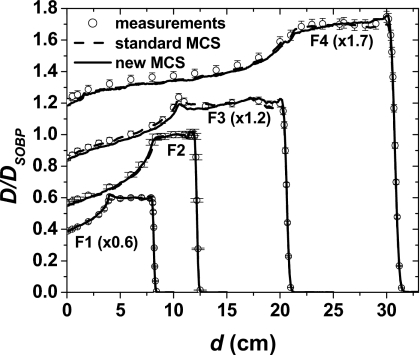
Figure 7 shows PDD profiles at the central axis. For both the standard and new MCS algorithms, the percentage deviation between measured and simulated data at the spread-out Bragg peak region was less than 3%, and the DTA in the distal fall-off region was within 0.05 cm.
Figure 7.
PDD profiles of 3-D dose distributions with 10×10 cm2 field sizes. The fields F1, F2, F3, and F4 used to create the dose distributions are given in Table 1. The circles and lines represent measured and simulated data, respectively. The PDD profiles are normalized to the dose at the middle of the spread-out Bragg peak DSOBP.
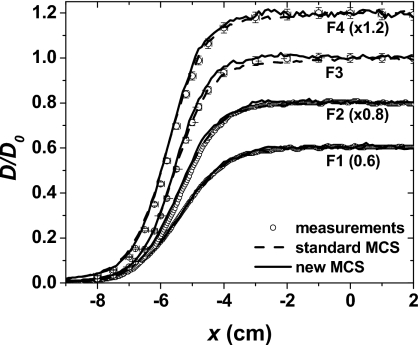
Figure 8 shows the lateral profiles at the center of the 3-D dose distributions. Differences between measured and simulated data at the FWHM dose level were within 0.1 cm for both standard and new MCS algorithms.
Figure 8.
Normalized in-water lateral profiles of 3-D dose distributions. The fields F1, F2, F3, and F4 used to create the 3-D dose distributions, with PDD profiles shown in Fig. 7, are given in Table 1. The lateral profiles were measured and simulated at depths corresponding to the center of the volumes. F1: Depth of 6.0 cm; F2: Depth of 10.0 cm; F3: Depth of 15.5 cm; and F4: Depth of 25.6 cm. The circles and lines represent measured and simulated data, respectively. The measurements in F1 and F2 were obtained from EBT films and in F3 and F4 from ionization chambers.
Pencil beam IDD profiles
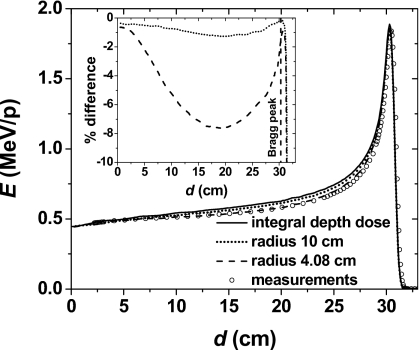
Figure 9 shows simulated IDD profiles for a 221.8 MeV pencil beam. Note that the cylindrical tallies of 4.08 cm radius underestimate IDD profiles up to 7.8% in certain regions of the Bragg curve for a 221.8 MeV pencil beam. Simulations with tallies of 10 cm radius showed that IDD profiles are underestimated by up to 1.4%. In Fig. 9, we also included measurements using an ionization chamber with 4.08 cm radius to show the agreement with the simulations. These measurements were normalized to the simulations results with tallies of 4.08 cm radius at a depth of 2.2 cm.
Figure 9.
Energy deposition per particle as a function of depth in water simulated using the new MCS algorithm for the 221.8 MeV pencil beam. The solid, dashed, and dotted lines represent the integral energy deposition and the energy deposition in cylindrical tallies with radii 4.08 and 10 cm, respectively. The circles represent measurements using a commercially available ionization chamber with radius 4.08 cm. The inset represents the percentage deviation between the integral energy deposition and the energy deposition in the cylindrical tallies with radii 4.08 and 10 cm, respectively.
DISCUSSION
We have validated MCNPX models of the PTCH spot scanning beam nozzle. We showed that our models accurately reproduce experimental data. However, we emphasize that the spatial distribution and angular divergence of the proton sources were free parameters in our MC models. They were adjusted so that our simulated in-air lateral profiles coincided with the measured ones. The use of the sources as free parameters was necessary because we lacked experimental data on the phase space of the proton beams at the nozzle entrance. Considering that our accelerator provides 94 different energies, measuring these parameters for all energies would be a major undertaking, which would require access to the beam line pipe and interruption of clinical activities. Thus, the proton sources used in the simulations may not represent the true proton sources. This is a limitation of our MC model.
We observed that for in-water lateral profiles of single pencil beams, the results of the standard MCS algorithm for the energies 72.5 and 148.8 MeV were in better agreement with experimental data than the results from the simulations with the new MCS algorithm. For the 221.8 MeV pencil beam, the in-water lateral profiles were in better agreement with the experimental data for the new MCS algorithm than for the standard one. Note that for high-energy beams, the simulations of in-air lateral profiles with both MCS algorithms well agreed with experimental data. However, when the high-energy beams were propagated in water, the standard MCS algorithm overestimated the width of the FWHM for lateral profiles at depths close to the Bragg peak. This overestimation is because the standard MCS algorithm has been shown to overestimate the scattering angle.37
An extensive validation of the new MCS algorithm has not been performed yet for the energies and materials relevant to proton therapy. Investigations of the effect of the step length on the scattering angle distribution and validation of scattering angles for simple target experiments in the therapeutic proton energies would be important to test the validity of this model. Indeed, we observed that both MCS algorithms (standard and new) failed to predict a different configuration of the nozzle in which energy absorbers were in the path of the beam, upstream of the isocenter plane. In this situation, different sources were required to reproduce measured in-air lateral profile data of single pencil beams. Thus, the unknown parameters (proton sources) and inaccuracy of the MCS algorithms may limit the predictive power of our model. Thus, phase-space experimental data of the proton sources would be valuable to tune the MCS algorithms and therefore improve the predictive power of our MC model to cases beyond the limited cases presented in this work.
We have shown that the results obtained with both MCS algorithms were in agreement with experimental data of PDD and relative lateral profiles for 3-D dose distributions. However, the dose distributions that were presented in this work were limited to a single field size of 10×10 cm2. Differences in the predictions of the MCS algorithms will be shown in a field size dependence study. In a different publication,15 we have investigated the field size dependence in the PTCH scanning beam nozzle using the MCS algorithms presented in this work. Our previous findings support the findings of this study in which the standard MCS algorithm produces better results for low and intermediate-energy pencil beams and the new MCS algorithm produces better results for high-energy pencil beams. Overall, the combination of the two MCS algorithms predicted the field size dependence within the experimental uncertainties.15
We used our MC model to determine the effect of the low-dose envelope on measurements of IDD profiles using standard ionization chambers. IDD profiles are input data required to configure analytical models of the proton beam in TPSs. It is difficult to accurately measure IDD profiles with standard dosimetric equipment because they may not be large enough to include the contribution of the low-dose envelope. We performed simulations with tallies that were of the same size as the sensitive area of the largest ionization chamber commercially available and observed that in the PTCH scanning beam nozzle, ionization chambers with a radius of 4.08 cm would underestimate IDD profiles up to 7.8% in certain regions of the Bragg curve for a 221.8 MeV pencil beam. Even detectors with a radius as large as 10 cm would underestimate the IDD profiles by up to 1.4%. This finding demonstrates the importance of using validated MC simulations to provide input data for analytical semiempirical dose calculation algorithms used by conventional TPSs.
CONCLUSIONS
In this study, we implemented the PTCH discrete spot scanning nozzle in the MC code MCNPX. We used the MCS algorithm from the standard version of MCNPX and a new MCS algorithm based on the work of Stankovskiy et al.32, 37 We validated our simulations using measured PDD profiles and in-air and in-water lateral profiles of single pencil beams. We then tested our MC models using clinically relevant dose distributions. For low-energy and intermediate-energy pencil beams, the standard MCS algorithm provided more accurate results. Conversely, for high-energy pencil beams, we obtained more accurate results using the new MCS algorithm. Using our validated MC models, we showed that the finite size of detectors underestimated up to 7.8% of the IDD profile at certain depths for the 221.8 MeV beam of the PTCH scanning nozzle. This finding emphasizes the usefulness and justifies the application of validated MC calculations to guide the configuration of proton beams in TPSs. The pencil beam IDD profile data produced by the validated MC models presented in this work were used for configuration of proton beams in our clinically used TPS.
There is still room for improvement in our MC models, including improved modeling of the proton sources and possibly better MCS algorithms. Use of the full capability of the scanning beam technique will be possible only with careful dosimetric characterization of the beam and a better understanding of the causes of the low-dose envelope.
ACKNOWLEDGMENTS
The authors kindly thank Dr. Falk Poenisch and Dr. Martin Bues, M. D. Anderson Cancer Center for discussions; the staff of the information technology section of the Department of Radiation Physics, M. D. Anderson for technical support on issues related to the computer cluster; and Ann Sutton, Scientific Publications, M. D. Anderson for editing the manuscript. The authors also really appreciate the thorough review and recommendations provided by the referees and associate editor of this paper, which have helped the authors to significantly improve the presentation and quality of this work. This research was partially supported by Varian Medical Systems, Inc. Grant No. CS2005-00012856SP and National Institutes of Health Grant No. P01-CA21239.
References
- Koehler A. M., Schneider R. J., and Sisterson M., “Range modulators for protons and heavy ions,” Nucl. Instrum. Methods 131, 437–440 (1975). 10.1016/0029-554X(75)90430-9 [DOI] [Google Scholar]
- Paganetti H., Bortfeld T., and Delaney T. F., “Neutron dose in proton radiation therapy: In regard to Eric J. Hall (Int J Radiat Oncol Biol Phys 2006;65:1–7),” Int. J. Radiat. Oncol., Biol., Phys. 66, 1594–1595 (2006). 10.1016/j.ijrobp.2006.08.005 [DOI] [PubMed] [Google Scholar]
- Gottschalk B., “Neutron dose in scattered and scanned proton beams: In regard to Eric J. Hall (Int J Radiat Oncol Biol Phys 2006;65:1–7),” Int. J. Radiat. Oncol., Biol., Phys. 66, 1594 (2006). 10.1016/j.ijrobp.2006.08.014 [DOI] [PubMed] [Google Scholar]
- Yan X., Titt U., Koehler A. M., and Newhauser W. D., “Measurement of neutron dose equivalent to proton therapy patients outside of the proton radiation field,” Nucl. Instrum. Methods Phys. Res. A 476, 429–434 (2002). 10.1016/S0168-9002(01)01483-8 [DOI] [Google Scholar]
- Zheng Y., Fontenot J., Taddei P., Mirkovic D., and Newhauser W. D., “Monte Carlo simulations of neutron spectral fluence, radiation weighting factor and ambient dose equivalent for a passively scattered proton therapy unit,” Phys. Med. Biol. 53, 187–201 (2008). 10.1088/0031-9155/53/1/013 [DOI] [PubMed] [Google Scholar]
- Zheng Y., Newhauser W. D., Fontenot J., Taddei P., and Mohan R., “Monte Carlo study of neutron dose equivalent during passive scattering proton therapy,” Phys. Med. Biol. 52, 4481–4496 (2007). 10.1088/0031-9155/52/15/008 [DOI] [PubMed] [Google Scholar]
- Polf J. C. and Newhauser W. D., “Calculations of neutron dose equivalent exposures from range-modulated proton therapy beams,” Phys. Med. Biol. 50, 3859–3873 (2005). 10.1088/0031-9155/50/16/014 [DOI] [PubMed] [Google Scholar]
- Polf J. C., Newhauser W. D., and Titt U., “Patient neutron dose equivalent exposures outside of the proton therapy treatment field,” Radiat. Prot. Dosim. 115, 154–158 (2005). 10.1093/rpd/nci264 [DOI] [PubMed] [Google Scholar]
- Gillin M. T., Sahoo N., Bues M., Ciangaru G., Sawakuchi G. O., Poenisch F., Arjomandy B., Martin C., Titt U., Suzuki K., Smith A. R., and Zhu X. R., “Commissioning of the discrete spot scanning proton beam delivery system at the University of Texas M. D. Anderson Cancer Center, Proton Therapy Center, Houston,” Med. Phys. 37, 154–163 (2010). 10.1118/1.3259742 [DOI] [PMC free article] [PubMed] [Google Scholar]
- Haberer T., Becher W., Schardt D., and Kraft G., “Magnetic scanning system for heavy ion therapy,” Nucl. Instrum. Methods Phys. Res. A 330, 296–305 (1993). 10.1016/0168-9002(93)91335-K [DOI] [Google Scholar]
- Pedroni E., Bacher R., Blattmann H., Böhringer T., Coray A., Lomax A. J., Lin S., Munkel G., Scheib S., Schneider U., and Tourovsky A., “The 200-MeV proton therapy project at the Paul Scherrer Institute: Conceptual design and practical realization,” Med. Phys. 22, 37–53 (1995). 10.1118/1.597522 [DOI] [PubMed] [Google Scholar]
- PTCOG, “Particle therapy facilities in a planning stage or under construction,” in http://ptcog.web.psi.ch/newptcentres.html (Particle Therapy Co-Operative Group, 2010).
- Pedroni E., Scheib S., Böhringer T., Coray A., Grossmann M., Lin S., and Lomax A. J., “Experimental characterization and physical modeling of the dose distribution of scanned proton pencil beams,” Phys. Med. Biol. 50, 541–561 (2005). 10.1088/0031-9155/50/3/011 [DOI] [PubMed] [Google Scholar]
- Sawakuchi G. O., Zhu X. R., Poenisch F., Suzuki K., Ciangaru G., Titt U., Anand A., Mohan R., Gillin M. T., and Sahoo N., “Experimental characterization of the low-dose envelope of spot scanning proton beams,” Phys. Med. Biol. 55, 3467–3478 (2010). 10.1088/0031-9155/55/12/013 [DOI] [PubMed] [Google Scholar]
- Sawakuchi G. O., Titt U., Mirkovic D., Ciangaru G., Zhu X. R., Sahoo N., Gillin M. T., and Mohan R., “Monte Carlo investigation of the low-dose envelope from scanned proton pencil beams,” Phys. Med. Biol. 55, 711–721 (2010). 10.1088/0031-9155/55/3/011 [DOI] [PubMed] [Google Scholar]
- Waters L. S., Hendricks J., and McKinney G., “Monte Carlo N-Particle Transport Code system for Multiparticle and High Energy Applications” (Los Alamos, NM: Los Alamos National Laboratory, 2002).
- Allison J. et al. , “Geant4 developments and applications,” IEEE Trans. Nucl. Sci. 53, 270–278 (2006). 10.1109/TNS.2006.869826 [DOI] [Google Scholar]
- Battistoni G., Muraro S., Sala P. R., Cerutti F., Ferrari A., and Roesler S., in Hadronic Shower Simulation Workshop, edited by Albrow M. and Raja R. (American Institute of Physics, Batavia, 2006), Vol. 896, pp. 31–49. [Google Scholar]
- Paganetti H., Jiang H., Lee S. Y., and Kooy H. M., “Accurate Monte Carlo simulations for nozzle design, commissioning and quality assurance for a proton radiation therapy facility,” Med. Phys. 31, 2107–2118 (2004). 10.1118/1.1762792 [DOI] [PubMed] [Google Scholar]
- Paganetti H., “Monte Carlo method to study the proton fluence for treatment planning,” Med. Phys. 25, 2370–2375 (1998). 10.1118/1.598447 [DOI] [PubMed] [Google Scholar]
- Newhauser W. D., Fontenot J. D., Zheng Y., Polf J., Titt U., Koch N., Zhang X., and Mohan R., “Monte Carlo simulations for configuring and testing an analytical proton dose-calculation algorithm,” Phys. Med. Biol. 52, 4569–4584 (2007). 10.1088/0031-9155/52/15/014 [DOI] [PubMed] [Google Scholar]
- Cirrone G. A. P., Cuttone G., Rosa F. D., Russo G., and Salamone V., “Monte Carlo validation of EYEPLAN proton therapy treatment planning,” Nucl. Phys. B, Proc. Suppl. 172, 273–276 (2007). 10.1016/j.nuclphysbps.2007.08.011 [DOI] [Google Scholar]
- Titt U., Sahoo N., Ding X., Zheng Y., Newhauser W. D., Zhu X. R., Polf J. C., Gillin M. T., and Mohan R., “Assessment of the accuracy of an MCNPX-based Monte Carlo simulation model for predicting three-dimensional absorbed dose distributions,” Phys. Med. Biol. 53, 4455–4470 (2008). 10.1088/0031-9155/53/16/016 [DOI] [PMC free article] [PubMed] [Google Scholar]
- Paganetti H., “Monte Carlo calculations for absolute dosimetry to determine machine outputs for proton therapy fields,” Phys. Med. Biol. 51, 2801–2812 (2006). 10.1088/0031-9155/51/11/008 [DOI] [PMC free article] [PubMed] [Google Scholar]
- Titt U., Zheng Y., Vassiliev O. N., and Newhauser W. D., “Monte Carlo investigation of collimator scatter of proton-therapy beams produced using the passive scattering method,” Phys. Med. Biol. 53, 487–504 (2008). 10.1088/0031-9155/53/2/014 [DOI] [PubMed] [Google Scholar]
- Paganetti H., “Nuclear interactions in proton therapy: Dose and relative biological effect distributions originating from primary and secondary particles,” Phys. Med. Biol. 47, 747–764 (2002). 10.1088/0031-9155/47/5/305 [DOI] [PubMed] [Google Scholar]
- Newhauser W. D., Titt U., Dexheimer D., Yan X., and Nill S., “Neutron shielding verification measurements and simulations for a 235-MeV proton therapy center,” Nucl. Instrum. Methods Phys. Res. A 476, 80–84 (2002). 10.1016/S0168-9002(01)01400-0 [DOI] [Google Scholar]
- Stankovskiy A., Kerhoas-Cavata S., Ferrand R., and Nauraye C., “Monte Carlo simulation of a CPO beam line: Modeling the nuclear interactions,” in International Conference on Nuclear Data for Science and Technology, 2007, pp. 1387–1390.
- Paganetti H., Jiang H., Parodi K., Slopsema R., and Engelsman M., “Clinical implementation of full Monte Carlo dose calculation in proton beam therapy,” Phys. Med. Biol. 53, 4825–4853 (2008). 10.1088/0031-9155/53/17/023 [DOI] [PubMed] [Google Scholar]
- Hérault J., Iborra N., Serrano B., and Chauvel P., “Monte Carlo simulation of a proton therapy platform devoted to ocular melanoma,” Med. Phys. 32, 910–919 (2005). 10.1118/1.1871392 [DOI] [PubMed] [Google Scholar]
- Cirrone G. A. P., Cuttone G., Di Rosa F., Raffaele L., Russo G., Guatelli S., and Pia M. G., “The GEANT4 toolkit capability in the hadron therapy field: simulation of a transport beam line,” Nucl. Phys. B, Proc. Suppl. 150, 54–57 (2006). 10.1016/j.nuclphysbps.2005.04.061 [DOI] [Google Scholar]
- Stankovskiy A., Kerhoas-Cavata S., Ferrand R., Nauraye C., and Demarzi L., “Monte Carlo modeling of the treatment line of the Proton Therapy Center in Orsay,” Phys. Med. Biol. 54, 2377–2394 (2009). 10.1088/0031-9155/54/8/008 [DOI] [PubMed] [Google Scholar]
- Soukup M., Fippel M., and Alber M., “A pencil beam algorithm for intensity modulated proton therapy derived from Monte Carlo simulations,” Phys. Med. Biol. 50, 5089–5104 (2005). 10.1088/0031-9155/50/21/010 [DOI] [PubMed] [Google Scholar]
- Peterson S. W., Polf J., Bues M., Ciangaru G., Archambault L., Beddar S., and Smith A., “Experimental validation of a Monte Carlo proton therapy nozzle model incorporating magnetically steered protons,” Phys. Med. Biol. 54, 3217–3229 (2009). 10.1088/0031-9155/54/10/017 [DOI] [PubMed] [Google Scholar]
- Rossi B., High-Energy Particles (Prentice Hall, New York, 1952). [Google Scholar]
- Kuhn S. E. and Dodge G. E., “A fast algorithm for Monte Carlo simulations of multiple Coulomb scattering,” Nucl. Instrum. Methods Phys. Res. A 322, 88–92 (1992). 10.1016/0168-9002(92)90361-7 [DOI] [Google Scholar]
- Stankovskiy A., Kerhoas-Cavata S., Ferrand R., and Nauraye C., “Monte Carlo simulation of a proton therapy beam line for head and neck tumor treatment,” in Proceedings of the Eighth International Topical Meeting on Nuclear Applications and Utilization of Accelerators, AccApp ’07, Pocatello, ID, 2007, pp. 349–356.
- Wong M., Schimmerling W., Phillips M. H., Ludewigt B. A., Landis D. A., Walton J. T., and Curtis S. B., “The multiple Coulomb scattering of very heavy charged particles,” Med. Phys. 17, 163–171 (1990). 10.1118/1.596538 [DOI] [PubMed] [Google Scholar]
- Hagiwara K. et al. , “Review of Particle Physics,” Phys. Rev. D 66, 010001 (2002). 10.1103/PhysRevD.66.010001 [DOI] [Google Scholar]
- Gottschalk B., Koehler A. M., Schneider R. J., Sisterson J. M., and Wagnera M. S., “Multiple Coulomb scattering of 160 MeV protons,” Med. Phys. 74, 467–490 (1993). [Google Scholar]
- Deasy J. O., “A proton dose calculation algorithm for conformal therapy simulations based on Molière’s theory of lateral deflections,” Med. Phys. 25, 476–483 (1998). 10.1118/1.598222 [DOI] [PubMed] [Google Scholar]
- Gottschalk B., “On the scattering power of radiotherapy protons,” Med. Phys. 37, 352–367 (2010). 10.1118/1.3264177 [DOI] [PubMed] [Google Scholar]
- Vavilov P. V., “Ionization losses of high-energy heavy particles,” Sov. Phys. JETP 5, 749–751 (1957). [Google Scholar]
- Bertini H. W., “Low-energy intranuclear cascade calculation,” Phys. Rev. 131, 1801–1821 (1963). 10.1103/PhysRev.131.1801 [DOI] [Google Scholar]
- Bertini H. W., “Intranuclear-cascade calculation of the secondary nucleon spectra from nucleon-nucleus interactions in the energy range 340 to 2900 MeV and comparisons with experiment,” Phys. Rev. 188, 1711–1730 (1969). 10.1103/PhysRev.188.1711 [DOI] [Google Scholar]


