

Summary
The search for longevity-determining genes in human has largely neglected the operation of genetic interactions. We have identified a novel combination of common variants of three genes that has a marked association with human lifespan and healthy aging. Subjects were recruited and stratified according to their genetically-inferred ethnic affiliation to account for population structure. Haplotype analysis was performed in three candidate genes, and the haplotype combinations were tested for association with exceptional longevity. An HRAS1 haplotype enhanced the effect of an APOE haplotype on exceptional survival, and a LASS1 haplotype further augmented its magnitude. These results were replicated in a second population. A profile of healthy aging was developed using a deficit accumulation index, which showed that this combination of gene variants is associated with healthy aging. The variation in LASS1 is functional, causing enhanced expression of the gene, and it contributes to healthy aging and greater survival in the tenth decade of life. Thus, rare gene variants need not be invoked to explain complex traits such as aging; instead rare congruence of common gene variants readily fulfills this role. The interaction between the three genes described here suggests new models for cellular and molecular mechanisms underlying exceptional survival and healthy aging that involve lipotoxicity.
Keywords: Longevity genes, haplotypes, lipotoxicity, healthy aging profile, population stratification
Introduction
Exceptional longevity has genetic and environmental components, but in humans they have often been difficult to identify (Christensen et al, 2006). Most of the research on the genetics of human aging has focused on the genetic risk factors associated with age-related diseases and disorders, with APOE being one prime candidate (Christensen et al, 2006). This is not surprising given the impact of variation in this gene on cardiovascular and neuropathological aspects of aging (Christensen et al, 2006; Schächter et al., 1994; Song et al., 2004; Strittmatter et al., 1993). Studies in model systems have also recently guided the search for genetic determinants of human longevity, pointing to several pathways and processes contributing to enhanced lifespan (Jazwinski, 1996; Finch & Ruvkun, 2001; Kenyon, 2005). However, this approach has largely been limited to components of the insulin/IGF-1 pathway (Suh et al., 2008; Hong et al., 2008; Willcox et al., 2008). We decided to expand on this approach by examining the Ras and ceramide signaling pathways. The involvement of Ras signaling in lifespan determination has been adduced in studies in yeast (Chen et al., 1990; Sun et al., 1994) and in mice (Migliaccio et al., 1999), while the role of ceramide signaling emerges from research in yeast (D’mello et al., 1994; Jazwinski & Conzelmann, 2002; Guillas et al., 2003) and in Caenorhabditis elegans (Tedesco et al., 2008; Menuz et al., 2009; Mehta et al., 2009).
The APOE ε4 allele is a risk factor for early mortality, while the alleles ε2 and ε3 are enriched in exceptionally old individuals in some studies (Christensen et al, 2006). Apolipoprotein E (APOE) is important in chylomicron and VLDL metabolism (Mahley & Rall, 2000). Thus, it is one of the factors responsible for maintenance of circulating lipid homeostasis. This balance can break down with age, and it is clearly disrupted in some individuals resulting in an increase in the risk for cardiovascular disease and other disorders (Mahley & Rall, 2000). The rise in circulating cholesterol and triglycerides results in vascular damage and can be a cause of lipotoxicity, a potential trigger of insulin resistance and diabetes (Kusminski et al., 2009). This lipotoxicity may trigger responses that are mediated by HRAS1, a small G-protein involved in signal transduction (Ramos, 1999). Furthermore, some of the pathways that are induced are modulated by ceramide, a product of the ceramide synthase LASS1 (Jazwinski & Conzelmann, 2002; Ogretmen & Hannun, 2004). Ceramide synthase responds to growth and to stress signals via Tor complex TORC2 and calcineurin, respectively (Dickson, 2008). Lipotoxicity stimulates ceramide synthesis (Kusminski et al., 2009), and the resulting ceramide can signal apoptosis, resulting in the removal of damaged cells (Koybasi et al., 2004). It can also facilitate the transfer of cholesterol from cells to HDL (Witting et al., 2003). Therefore, we postulate that the HRAS1 and LASS1 genes interact genetically with the APOE gene to reduce age-related increase in lipotoxic events, and that a combination of variants or haplotypes in these three genes is associated with exceptional survival.
Results
Gene combination associated with exceptional longevity
We have initiated a genetic analysis of exceptional longevity in the Georgia and Louisiana populations. Our attention in this study was exclusively directed to APOE, HRAS1, and LASS1 in a candidate gene approach. As noted earlier, variants of APOE are associated with longevity. This pattern is also found in the Georgia and Louisiana populations, for centenarians and nonagenarians respectively (Table S1). Both the Georgia and Louisiana populations are admixed with the two major strata being of European and African origin. To address this problem, we stratified each population by ethnic affiliation using an identical-by-descent (IBD) genetic system (Figure 1). We placed the subjects in each population into two major groups of African and European origin. Together, these two groups constituted 81% and 83% of subjects 20 to 59 years-old and 72% and 77% of centenarians and nonagenarians in the Georgia and Louisiana samples, respectively. The ability to stratify is markedly enhanced by the Alu system used here, which can trace genealogy within the primate lineage. The mean correct prediction rates with the 100 Alu used here are 95 to 99% (Bamshad et al., 2003). After stratification the association of APOE with longevity persisted (Table S2). However, no such association was detected for HRAS1 or LASS1 here (Table S3).
Fig. 1.
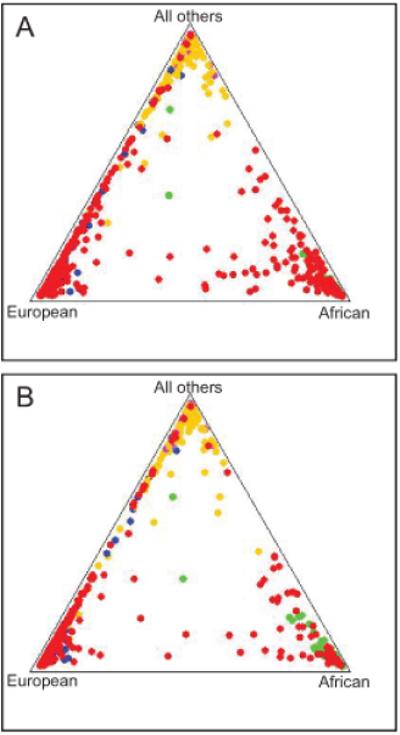
Stratification of the populations by ethnic affiliation. Alu genotypes and Structure analysis were employed to assign subjects to two major strata, European and African, in the Georgia (A) and Louisiana (B) populations. The Structure analysis was carried out in two batches for Louisiana consisting of 434 and 435 samples to speed computation, the latter of which is shown, while all 650 samples from Georgia were analyzed in one batch. Dots: red (Georgia or Louisiana samples), green (African control samples), blue (European control samples), pink (Asian control samples), orange (Indian control samples). Indian refers to the Indian subcontinent. Not all samples are evident due to superposition of dots.
To test the hypothesis that the genetic interaction postulated above is associated with longevity, we genotyped the Georgia sample at the three relevant genomic regions. None of the 15 SNP examined showed significance for departure from Hardy-Weinberg proportions in either the African or European origin populations in Georgia. (The same was found separately for the Louisiana population.) We searched for combinations of haplotypes in the three genes (15 SNP) in the Georgia population present at ~0.01 or greater frequency, using expectation maximization. We then tested them for association with exceptional longevity (Table S4). Such associations were detected in the subpopulation of European origin in Georgia, stratified with an assignment probability of 0.9 (Table 1), but not in the subpopulation of African origin. They involve the ε3 containing APOE haplotype (ATTTC) and the HRAS1 (CGCGCGT) haplotype in combination with the LASS1 (CCT) or (CGT) haplotypes, in which the SNP are listed starting with the furthest upstream SNP for each gene. The odds ratios (OR) of 7.68 and 2.56 were obtained for the APOE, HRAS1, and LASS1 (CCT) or (CGT) haplotype combinations, respectively. The stratification of the population at the 0.9 assignment probability level was sufficient for this analysis because no significant differences were observed in the frequencies of the ethnic affiliation markers between the control and centenarian groups in the European subpopulation.
Table 1.
Association of haplotypes with exceptional longevity and healthy aging
| Population | Haplotype |
Case (N; frequency) Control (N; frequency) |
OR (CI) |
Exact P (adjusted P) |
|---|---|---|---|---|
| Georgia |
APOE·HRAS1· LASS1 (CCT) |
≥98 yr-old (147; 0.073) 20-59 yr-old (188; 0.010) |
7.68 (2.55-23.10) |
4.1×10⁻⁵ (2.88×10⁻⁴) |
| Georgia |
APOE·HRAS1· LASS1 (CGT) |
≥98 yr-old (147; 0.191) 20-59 yr-old (188; 0.084) |
2.56 (1.61-4.08) |
7.8×10⁻⁵ (4.66×10⁻⁴) |
| Louisiana |
APOE·HRAS1· LASS1 (CCT) |
≥90 yr-old (204; 0.105) 20-59 yr-old (251; 0.039) |
2.93 (1.68-5.09) |
9.5×10⁻⁵ (5.68×10⁻⁴) |
| Louisiana |
APOE·HRAS1· LASS1 (CGT) |
≥90 yr-old (204; 0.175) 20-59 yr-old (251; 0.067) |
2.97 (1.92-4.58) |
6.91×10⁻⁷ (5×10⁻⁶) |
| Georgia |
APOE·HRAS1· LASS1 (CCT) |
≥98 yr-old female (128; 0.099) 20-59 yr-old female (115; 0.009) |
12.52 (2.93-53.57) |
1×10⁻⁵ (2×10⁻⁵) |
| Georgia |
APOE·HRAS1· LASS1 (CGT) |
≥98 yr-old male (19; 0.251) 20-59 yr-old male (73; 0.026) |
12.40 (3.55-43.29) |
9×10⁻⁶ (9×10⁻⁶) |
| Louisiana |
APOE·HRAS1· LASS1 (CCT) |
≥90 yr-old female (125; 0.092) 20-59 yr-old female (163; 0.032) |
3.12 (1.47-6.63) |
1.97×10⁻³ (3.93×10⁻³) |
| Louisiana |
APOE·HRAS1· LASS1 (CGT) |
≥90 yr-old male (79; 0.279) 20-59 yr-old male (88; 0.074) |
4.86 (2.50-9.45) |
1×10⁻⁶ (2×10⁻⁶) |
| Louisiana |
APOE·HRAS1· LASS1 (CCT) |
≥90 yr-old healthy (68; 0.023) ≥90 yr-old unhealthy (68; 0.076) |
0.29 (0.08-1.04) |
*5.11×10⁻² (5.11×10⁻²) |
| Louisiana |
APOE·HRAS1· LASS1 (CGT) |
≥90 yr-old healthy (68; 0.295) ≥90 yr-old unhealthy (68; 0.026) |
15.48 (5.08-47.15) |
1.06×10⁻⁹ (2.11×10⁻⁹) |
European subpopulations (0.9 assignment probability) were examined. The haplotypes are ATTTC and CGCGCGT for APOE and HRAS1, respectively. Healthy and unhealthy were classified as described in Experimental procedures. OR, odds ratio; CI, 95% confidence interval.
Not significant.
To determine whether these associations are present in the Louisiana population, we carried out the same analyses independently. The results obtained in the Georgia sample replicated in the Louisiana sample (Table 1). The same haplotype combinations were associated with exceptional longevity in the subpopulation of European origin in Louisiana, stratified with an assignment probability of 0.9, and no significant association was found in the African origin subpopulation. The OR were 2.93 and 2.97 for the APOE, HRAS1, and LASS1 (CCT) or (CGT) haplotype combinations, respectively. The lower OR of the LASS1 (CCT)-containing haplotype combination in the Louisiana population is likely due to the greater demographic selection for centenarians than for nonagenarians in the Georgia and Louisiana samples, respectively, but this does not appear to apply to the LASS1 (CGT).
The lack of an association with longevity in the African-American subpopulation from both Georgia and Louisiana could be due to the relatively lower numbers of subjects from this group. However, it is likely that this may be an intrinsic difference in the subpopulation. Analysis of the frequency of the haplotypes in the individual genes supports the notion that there is an intrinsic difference between the European and African subpopulations in both Georgia and Louisiana (Table 2). The major difference is in the APOE haplotype frequency, with a smaller difference in LASS1. The European populations in Georgia and Louisiana also differ, as an examination of the haplotype blocks in the three genes suggests (Figure S1).
Table 2.
Haplotype frequencies in the general population
| European | ||||
|---|---|---|---|---|
| Haplotype | APOE | HRAS1 | LASS1 (CCT) | LASS1 (CGT) |
| Georgia (N=220) | 0.237 | 0.634 | 0.289 | 0.504 |
| Louisiana (N=293) | 0.237 | 0.664 | 0.253 | 0.561 |
| African | ||||
|---|---|---|---|---|
| Haplotype | APOE | HRAS1 | LASS1 (CCT) | LASS1 (CGT) |
| Georgia (N=145) | 0.041 | 0.633 | 0.200 | 0.333 |
| Louisiana (N=52) | 0.08 | 0.60 | 0.15 | 0.28 |
A Structure assignment probability of 0.8 was used for this analysis in order to provide a conservative evaluation of any differences. The 20-59 year-old age groups were used here, as representative of the general population. APOE (ATTTC) and HRAS1 (CGCGCGT) haplotypes are shown.
Haplotype frequencies differ with age
To ascertain the potential role of the three-gene interaction in promoting exceptional survival, we examined the differences in various age groups in the frequency of the two haplotype combinations identified above in the European subpopulation. The results are shown for the combinations containing the LASS1 (CCT) and (CGT) haplotypes in Figure 2A and B, respectively. The monotonic increase in the frequencies of the haplotype combinations of APOE·HRAS1·LASS1 with age indicates a positive association with longevity, although a plateau appears for the combination containing the LASS1 (CGT) haplotype for the oldest age group. These positive associations with longevity indicate that these are longevity haplotypes.
Fig. 2.
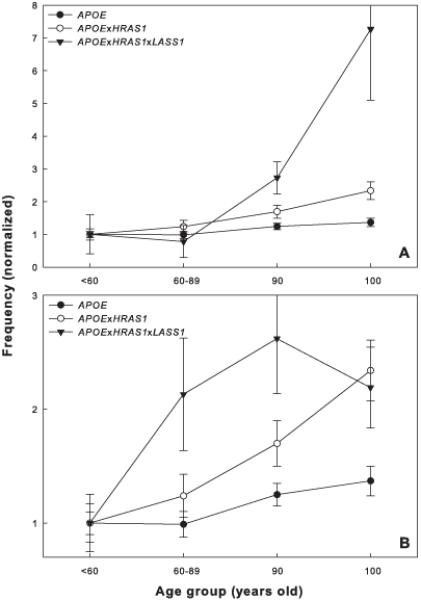
Haplotype frequencies in different age groups. The frequencies for each haplotype or haplotype combination determined for the European subpopulation (0.9 assignment probability) were normalized to the frequencies in the <60 years-old age group from Georgia or Louisiana, respectively, to facilitate comparison. Error bars denote the SD (100 bootstraps). The age groups labeled “90” and “100” are the nonagenarians and centenarians in Georgia and Louisiana, respectively. For clarity, only the haplotypes or haplotype combinations that differ significantly in frequency between age groups are shown: APOE (ATTTC), HRAS1 (CGCGCGT), and LASS1 (CCT) in A and APOE (ATTTC), HRAS1 (CGCGCGT), and LASS1 (CGT) in B. Note the difference in scale of the ordinates in A and B. The APOE and APOE·HRAS1 frequencies are identical in the two panels.
We next determined the frequencies of the APOE (ATTTC) haplotype and its combination with HRAS1 (CGCGCGT) from the three-gene haplotype combination in the various age groups. Figure 2 shows that in both cases there is a monotonic increase with age. None of the other haplotypes in the individual genes or haplotype combinations changed in frequency with age. The patterns seen indicate that HRAS1 has a synergistic (epistatic) effect with APOE and this effect is further enhanced by either of the two LASS1 haplotypes (Figure 2 and Table 1).
Consistent with the increase in haplotype frequencies with age, the APOE haplotype is associated with exceptional survival in the European origin subpopulations from both Georgia and Louisiana, with OR of 1.53 (CI =1.08-2.17; Exact P=2.12×10⁻²; adjusted P=2.12×10⁻²) and 1.37 (CI=1.02-1.83; Exact P=4.37×10⁻²; adjusted P=4.37×10⁻²) respectively. The APOE·HRAS1 haplotype combination is also associated with longevity in both of these subpopulations, with OR of 2.83 (CI=1.88-4.26; Exact P=5.68×10⁻⁷; adjusted P=1.14×10⁻⁶) and 1.89 (CI=1.35-2.65; Exact P=2.27×10⁻⁴; adjusted P=4.54×10⁻⁴) respectively. The greater OR for the two-gene combination supports the epistatic effect of HRAS1. None of the other haplotypes in the individual genes or their combinations were associated with longevity (Table S5).
Haplotype combinations in females and males
The plateau in the frequency of the three-gene haplotype combination containing LASS1 (CGT) in centenarians was puzzling. One possibility is that this reflects the lack of a role for this haplotype in survival at that late age. However, there is an alternate explanation. With advanced age, the ratio of females to males increases. Thus, the plateau we see could be the result of gender bias in the oldest age groups. We therefore examined the haplotype association in the Georgia sample for females and males separately, in the European subpopulation. The results suggest that such a bias indeed exists (Table 1). The association with exceptional survival in female centenarians was found solely for the combined haplotypes of the three genes that included LASS1 (CCT), showing an OR of 12.52. For male centenarians it was instead the LASS1 (CGT) haplotype with an OR of 12.40. The results in the Georgia sample were replicated in the Louisiana population (Table 1). For female nonagenarians the combined haplotypes that included LASS1 (CCT) were associated with exceptional longevity with an OR of 3.12. For male nonagenarians this combination included LASS1 (CGT) and an OR of 4.86.
Gene combination associated with healthy aging
We next examined the question whether the genetic combination that contributes to exceptional longevity is also associated with “healthy aging.” Healthy aging is a concept that is difficult to define adequately. We elected to quantify healthy aging using the frequency of self-reported deficits (Rockwood & Mitnitski, 2007) in the Louisiana nonagenarians (Table S6). For this purpose, we surveyed subjects for the presence of 42 medical conditions or functional limitations and summed them for each nonagenarian. We then partitioned the subjects into tertiles based on the number of deficits reported; tertile 1 had the fewest deficits, while tertile 3 had the greatest number of deficits. A Kaplan-Meier survival analysis was performed for each of the tertiles (Figure 3). Examining the entire sample of nonagenarians from Louisiana, the survival curves are significantly different (Wilcoxon χ2(2)=20.06, P<0.0001).
Fig. 3.
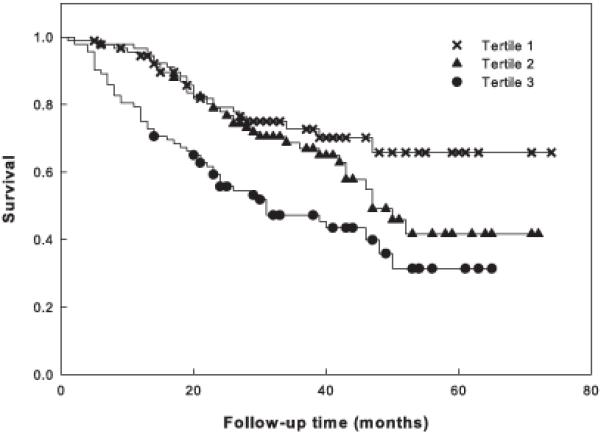
Survival of nonagenarians as a function of their healthy aging profile. Kaplan-Meier survival of all nonagenarians in the Louisiana sample is plotted after partitioning individuals into tertiles of deficit accumulation. Deficit count increases from tertile 1 to 3. Mortality was assessed on follow up after enrollment. Censoring is indicated by the symbols.
We then searched for genetic associations with healthy aging by examining the haplotypes in the three genes in the tertile with the fewest deficits versus that with the most (Table 1). The results indicate that the combination of the same haplotypes in the three genes is associated with healthy aging but only for the combination including LASS1 (CGT). The OR for this association was 15.48 for the European subpopulation in Louisiana.
Functional impact of gene variants
The marked difference in the effects of the two LASS1 haplotypes suggests that they could have functional consequences. Variants in the APOE promoter at −491 and −219 are known to affect the expression of this gene at the transcription level (Artiga et al., 1998a, b). The combination we have found in the haplotype associated with exceptional survival elicits a moderate level of expression, approximately one-half of maximal. Because LASS1 only has an effect when a combination of haplotypes in APOE and HRAS1 is present and this effect differs depending on the particular LASS1 haplotype, we examined the variants in the LASS1 gene for their potential role in transcription of the gene, using a luciferase reporter assay. The results indicate that compared to the AGC haplotype the CCT- and CGT-containing promoters were 48% and 29% more active, respectively (Figure 4). Thus, the variation observed in our study appears to be functional in determining mRNA expression levels. Perhaps, the more moderate expression of LASS1 in males promotes healthier aging. It is noteworthy that varying expression of the LASS1 homolog in yeast, LAG1, affects the observed life extension (Jiang et al., 2004).
Fig. 4.

Impact of polymorphisms in LASS1 on gene expression. A luciferase reporter assay was used for determining the promoter activity in transfected HeLa cells. Error bars denote SEM for six independent experiments with at least six replicates for each of the four promoter constructs shown. The LASS1 promoter variants CCT and CGT associated with exceptional longevity were compared to an AGC variant. The control is a reporter lacking inserted promoter sequences.
Discussion
We have found a combination of variants in three genes that is associated not only with exceptional longevity but also with healthy aging. This is a novel finding. An association of HRAS1 with longevity was found before, and an interaction with the mitochondrial genome was demonstrated (Bonafé et al., 2002). A compensatory effect in late life of variants in one gene for the deleterious effects of variants in a second gene has also been described (Bergman et al., 2007). The combined effect described here involves three genes and extends the association with exceptional survival to the functional outcome of health in old age. Genetic interactions play an important role in complex traits, but they can be difficult to find unless a hypothesis driven approach such as we use here is employed that reduces the scale of the search and affects the prior probabilities involved (Thornton-Wells et al., 2004; Flint & Mackay, 2009). Unmasking the interactions of common variants mitigates the necessity of invoking the wide involvement of rare variants in complex traits.
The association with healthy aging and the profile of increasing frequencies of the haplotypes with age indicates that the three genes studied here are not frailty genes or haplotypes but instead genetic determinants of longevity. The foundation for the genetic interaction is laid by the haplotype in APOE. HRAS1 has a synergistic effect, and this combined effect is further enhanced by either of the two LASS1 haplotypes in a synergistic manner. Our results point to the importance of accounting for population heterogeneity in association studies (Dai et al., 2007). The African-origin subpopulation displays a very low frequency of the crucial APOE haplotype, as well as a reduced frequency of the LASS1 haplotypes. Thus, intrinsic genetic differences between the European and African subpopulations can explain the lack of observation of the three-gene interaction in the latter group. On the other hand, the associations we have discovered in the European-origin sample from Georgia are replicated in the corresponding Louisiana sample, though the haplotype structures in the two samples differ. It will be important to examine samples from additional populations for these associations to further generalize our findings and to explore potential nuances in the haplotypic effects.
There are two different haplotypes in LASS1 that play a role in the three-gene combination described here. One appears to operate in females and the other in males to determine exceptional longevity. Furthermore, it is only the latter that is associated with healthy aging. Thus, similar but distinct mechanisms of aging are at play. Differences in genetic associations with exceptional longevity between the genders have been noted previously (De Benedictis et al., 2001). Interestingly, the cognition and physical function ability of male centenarians is often greater than for their female counterparts, even though they are outnumbered by them (Terry et al., 2008). Survival to exceptional old age, however, can occur due to delay or escape from morbidity, as well as survival in its presence, regardless of gender (Terry et al., 2008; Evert et al., 2003). The promoter analyses suggest that an enhanced LASS1 activity is conducive to longevity. They further suggest that healthy aging in nonagenarians depends on a somewhat lower enhancement of this promoter activity. This could, for example, be related to moderation in apoptosis-promoting activity coupled to sufficient enhancement of cholesterol clearance by ceramide. Our results support a model (Figure 5) postulating that metabolic (lipid) stress induces protective responses. However, at some point, removal of damaged cells is needed. Confirmation of this model will require the longitudinal study of appropriate endophenotypes.
Fig. 5.
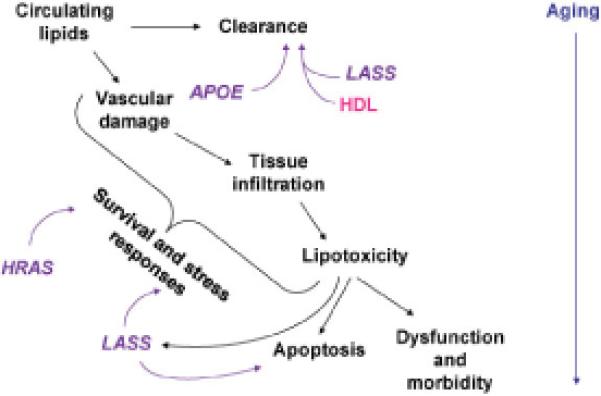
Hypothetical model of the role of APOE, HRAS1, and LASS1 interactions. Circulating lipids are cleared by APOE and by HDL, which is aided by LASS1-generated ceramide. Metabolic (lipid) stress induces protective survival and stress responses, which are mediated/modulated by HRAS1 and LASS1. Lipotoxicity enhances LASS1 production of ceramide, which signals apoptosis removing damaged cells. These mechanisms become overwhelmed with age resulting in dysfunction and morbidity.
The haplotypes in the three genes are all present at high frequency in the European subpopulation in both Georgia and Louisiana (Table 2). However, the congruence of the respective haplotypes in all three genes is relatively infrequent in the population at large, although it increases in frequency dramatically with age (Table 1 and Figure 2). Thus, we have uncovered an individual path to exceptional longevity and healthy aging, and others remain to be found.
Experimental procedures
Study subjects
The Georgia sample (N=650) was recruited in the Georgia Centenarian Study from 44 counties in Northern Georgia. The sampling frame consisted of voter’s registration files and lists prepared from a survey of nursing homes and personal care homes in the catchment area for centenarians and random digit dialing for younger subjects. The Louisiana sample (N=869) was recruited in the Louisiana Healthy Aging Study from 8 parishes within a 40-mile radius of Baton Rouge. The sampling frame consisted of the Center for Medicare and Medicaid Services enrollment database for subjects 65 and older and voter’s registration files for younger individuals. Age of subjects was verified using both demographic questionnaires and documentary evidence. Mortality data were collected using Social Security Death Index search. Subjects provided informed consent according to protocols approved by the respective Institutional Review Boards. The demographic characteristics of the samples are tabulated (Table S7).
Genotyping
Small subsets of samples from Georgia and Louisiana were first independently genotyped to identify all detectable variation in the selected genomic regions. Only polymorphisms present at ≥0.09 frequency were chosen for subsequent analysis in all samples. This provided sufficient power (>0.95) to detect associations with exceptional longevity (Dai et al., 2007). Genomic regions of interest were then amplified by the polymerase chain reaction (PCR). The primers, forward and reverse respectively, used to amplify the DNA regions of interest by the PCR were as follows: (1) the promoter region of the APOE gene, 5′-GCGTCTGAGCGTTCACTGT-3′ and 5′-GTCCCAGTCTCGCATTCCT-3′; (2) exon 4 of APOE, 5′-CTTGGGTCTCTCTGGCTCATC-3′ and 5′-GCAGCCTGCACCTTCTCC-3′; (3) promoter of LASS1, 5′-CAGCAAGTGACCCTCAGAG A-3′ and 5′-GACCTGGACCCCGAGAGA-3′; (4) exon1 of LASS1, 5′-GCCTGGGTTTCTCTGCTG-3′ and 5′-GCCCGAGAGACCTTATCCTG-3′; (5) promoter of HRAS1, 5′-ATCCCAGCCTTTCCCCAG-3′ and 5′-TTCGCCCCGCGCATGGGCT-3′; (6) exon 1 of HRAS1, 5′-CAGGAGACCCTGTAGGAGGA-3′ and 5′-CCTATCCTGGCTGTGTCCTG-3′.
Amplicons were verified by agarose gel electrophoresis, and cleaned DNA was subjected to cycle-sequencing using the Big-Dye Terminator Reagent version 3.1 (Applied Biosystems) and the same primers, and the 3130xl DNA sequencing system (Applied Biosystems). Identification of alleles was aided by the SNP detection and base-calling software Seqscape v2.5 (Applied Biosystems). To minimize errors, both strands of DNA were sequenced twice independently. The genotyped loci included SNP: rs449647, rs769446, rs405509, rs429358, rs7412, rs8176330, rs8176331, rs8176332, rs8176333, rs8176334, rs8176335, rs12628, rs60774903, rs3746263, and a SNP in exon 1 (+234) in LASS1 that is not found in dbSNP. The genotyped loci are tabulated (Table S8).
Some of the Louisiana samples were genotyped using the SNPlex technology (Applied Biosystems), which is based on the oligonucleotide ligation assay combined with multiplex PCR amplification. Primers were designed according to the SNPlex Design Pipeline for the following SNP: rs449647, rs769446, rs405509, rs440446, rs8176330, rs2229765, rs3746263, rs1801282, rs3856806, and rs17848595. Size fractionation of genotype-specific products was performed by capillary electrophoresis using the 3130xl DNA Analyzer, and genotype calls were made using the GeneMapper v4.0 software (Applied Biosystems). The SNPlex genotyping was repeated twice independently.
The two polymorphisms in the coding region (rs429358 and rs7412) account for the occurrence of three alleles, ε2, ε3, and ε4, which result in the three major isoforms, E2, E3, and E4 of APOE, respectively. The E2, E3, and E4 isoforms differ in amino acid sequence at site A (residue number 112) and site B (residue number 158) in exon 4. For HRAS1 and LASS1 SNP, their locations are relative to the first nucleotide of the translation start codon, whereas the transcription start site was used for the APOE SNP.
Population stratification using Structure
Identification of ethnic origins of individuals using Alu insertion polymorphisms was performed as described (Ray et al., 2005; Bamshad et al., 2003; Watkins et al., 2003). DNA samples were genotyped at 100 separate Alu loci located throughout the genome. The Alu sequences were amplified by PCR using locus specific primers. The PCR fragments were separated by agarose gel electrophoresis. The primers and methods used have been described (Ray et al., 2005; Bamshad et al., 2003; Watkins et al., 2003). Subjects were classified as one or the other of the possible homozygotes based on the presence of a particular Alu sequence at a given locus or as heterozygotes. The Alu genotypes thus obtained were analyzed to assign ethnic affiliation using Structure (Pritchard et al., 2000). For this purpose, the same Alu genotypes from 715 independent DNA samples from subjects from around the world were used (Ray et al., 2005; Bamshad et al., 2003; Watkins et al., 2003). These samples spanned the geographic regions of Europe, Africa, Asia, and India and included sampling of individuals from many populations in each region (31 total). Subjects were then assigned to populations of origin corresponding to these geographic regions using an assignment probability of 0.9.
Plot of pairwise linkage disequilibrium (LD) comparison
Haplotype blocks for the three genes were examined using Haploview. The standard color scheme is used for D’/LOD values: bright red (D’ = 1, LOD ≥ 2); blue (D’ = 1, LOD < 2); shades of pink/red (D’ < 1, LOD ≥ 2); white (D’ < 1, LOD < 2). The numbers shown inside the boxes are D’ values x 100 (empty boxes represent the D’ value of 1). Haplotype blocks are defined based on confidence bounds on D’. If the one-sided upper 95% confidence bound on D’ lies between 0.7 and 0.98, the SNP pairs involved are considered to be in strong LD (Gabriel et al., 2002). Haploview was also used to examine the Hardy-Weinberg equilibrium. None of the 15 SNP examined in this study showed significance for departure from Hardy-Weinberg proportions in the Georgia and Louisiana samples stratified by Structure at 0.9 assignment probability. Haploview is available at: www.broad.mit.edu/mpg/haploview.
Promoter analysis of LASS1 haplotypes
A 1,755-bp DNA fragment containing the putative promoter region and part of the coding region of LASS1 was PCR-amplified from appropriate genomic DNA samples using EcoRV and BglII-tagged primers and cloned into the Pgl4.10 vector (Promega). The cloned sequence is in frame with the firefly luciferase coding sequence in the vector. Then, an additional 1,040-bp fragment tagged with XhoI and EcoRV was added upstream of the original clone. The translational start codon of LASS1 was changed to TAG by site-directed mutagenesis. The correctness of the final constructs was verified by sequencing. The only sequence differences between the constructs were at the polymorphic sites of interest specified below.
Transfection of HeLa cells was performed using the PolyFect transfection reagent (Qiagen) per the protocol provided. Co-transfection was done with mixtures of one of the experimental constructs (0.4 μg) with a control vector, Pgl4.73 (10 ng), which carries a Renilla luciferase coding sequence under the SV40 promoter. The experimental constructs were either Pgl4.10 without LASS1 promoter sequences or Pgl4.10 with one of three different LASS1 sequences. These had the following bases at positions −718, +216, and +234, respectively: AGC, CCT, or CGT. Following 24-hr incubation, luciferase activities were measured using the Dual-Glo Luciferase Assay (Promega) per the protocol provided, using a Modulus Microplate Luminometer (Turner BioSystems). The firefly luminescence readings were normalized to the Renilla luminescence readings. There were at least 6 replicates of each assay per experiment.
Deficit index
Following previously published reports (Kulminski et al., 2008; Searle et al., 2008), our deficit index was derived as the un-weighted count of the number of deficits divided by the total number of possible deficits for an individual. The self-reported medical history questionnaire was administered to all study participants, and its components were used to construct the deficit index. This was supplemented with items from an activities of daily living (ADL) questionnaire. Responses were grouped to create broader categories where similar ailments were defined more than once. After applying the above criteria, 42 deficits were included in the compilation of the index.
Statistical analysis
There is substantial evidence supporting the hypothesis of association with exceptional longevity of variants in the three candidate genes chosen here for analysis. This information is presented in this paper. APOE has been replicated as a longevity-determining gene in numerous studies (Christensen et al., 2006). This gene anchors the interaction described in this report (Figure 5). The hypothesis we test is related to the role of the apolipoprotein APOE in lipid and lipoprotein metabolism. The BioSystems Database (NCBI) lists 228 genes under the entry “Metabolism of Lipids and Lipoproteins.” APOE and LASS1 are among them. Thus, we assume the prior probability of an interaction of these genes to be ~1.0. It is likely that there are genes involved in lipid and lipoprotein metabolism in addition to the 228, and we conservatively propose there to be 300. We therefore assume the prior probability of identifying another interacting gene, such as HRAS1, to be ~300/30,000 or ~0.01. We set the posterior probability for identification of such a gene at 0.95. Applying Bayes’ theorem, we obtain the likelihood ratio Pr(Data | Association) / Pr(Data | NoAssociation) of 1,881. These considerations are applicable to the initial test of the association with longevity of the combination of the haplotypes in the three genes in both the Georgia and Louisiana populations. The prior probability increases dramatically in subsequent tests, once the initial association is identified.
APOE allele frequencies and genotype frequencies were compared between centenarians/nonagenarians and young controls with a 2 × 3 contingency table (for alleles) or with a 2 × 6 contingency table (for genotypes). The contingency tables were evaluated by Fisher’s exact probability test (Sanchez et al., 2006), using SAS v9.13 software (SAS Institute Inc., Cary, NC). A P-value <0.05 was considered statistically significant. All statistical tests of significance reported in this study are two-sided.
Structure v2.2 (Pritchard et al., 2000) was used to infer population structure for the 650 Georgia subjects and the 869 Louisiana subjects, respectively. Seven hundred and fifteen subjects of known geographic ancestry (European, African, Asian, or Indian) were used as reference. For each individual, Structure 2.2 estimates the proportion of ancestry from each of four populations. We used a burn-in of 15,000 iterations and a run of 20,000 replications. Three replicate runs were performed on each dataset. The largest proportion values in each run were used to calculate the average ancestry proportion for each individual. Individuals were either assigned to a specific geographic origin if the average was larger than a predetermined assignment probability (0.9 in this study) or considered admixed if the average was less. All haplotype analyses were performed on samples stratified for ethnic affiliation, as described here.
Linkage disequilibrium (LD) approaches to the analysis of gene-gene interactions have been proposed (Zhao et al., 2006), and the modeling of gene-gene interactions using association analysis of noncontiguous haplotypes has been implemented (Woo et al., 2006). We took a similar approach. The haplotype frequencies for the combination of SNP in APOE, HRAS1, and LASS1 were estimated by an Expectation-Maximization (EM) algorithm implemented in Arlequin (Excoffier et al., 2005). The SD was determined by the parametric bootstrap procedure in Arlequin (100 bootstraps). Those haplotype combinations present at a frequency of ~0.01 or greater in the 20-59 year-old group in Georgia and in Louisiana were analyzed further. This cutoff was taken based on the considerations from comparison of statistical and molecular haplotyping for sample sizes as small as 17 (Tishkoff et al., 2000). The frequency estimates in case and control groups were used to generate 2 × 2 contingency tables to test significance of associations of the respective haplotype combinations with exceptional longevity. Fisher’s exact test was used to assess significance. The sequential Dunn-Sidak procedure was used to adjust the exact P-values for multiple comparisons of haplotype combinations. The adjustment included seven such combinations independently identified in the Georgia and Louisiana samples in the subpopulations of European origin (Table S4). In the African-origin subpopulations, there were seven and three such combinations in these samples, respectively. A stringent criterion of adjusted P<0.01 (two-sided) was used to identify the potentially-interacting combination of haplotypes in the three genes.
The two significant haplotype combinations found to be associated with exceptional longevity in the independent analyses in the Georgia and Louisiana samples were then evaluated in males and females in these two samples, as well as for the tertiles of deficit accumulation in the Louisiana population. The same ~0.01 frequency cutoff was applied. This involved adjustment for up to two comparisons, using the sequential Dunn-Sidak procedure. The haplotype combination frequencies differed significantly in the various samples examined. These haplotype combinations are common in the relevant samples characterized by longevity and/or healthy aging. The three-gene haplotype combinations reported here are associated with certain additional healthy-aging phenotypes but not with others (in preparation).
The APOE and APOE·HRAS1 haplotypes derived from the significant haplotype combinations in the three genes were also evaluated independently for association with exceptional longevity, using the above procedures.
Nonagenarians were classified by tertile according to their deficit accumulation, as described above. The Kaplan-Meier survival was plotted for each tertile. The differences between tertiles were evaluated by the Wilcoxon test (a two-sided P<0.05 was considered significant). SAS v9.13 software was used for Kaplan-Meier survival analysis.
The significance of differences in promoter strength determined using the luciferase reporter assay was evaluated for six independent experiments in which the control (no LASS1 promoter sequences) and the three LASS1 promoter haplotypes were compared. One-way ANOVA was used to first test for any differences, using a criterion of P<0.05 (two-sided). Then all pair-wise combinations were evaluated in a two-tailed Newman-Keuls test, implemented in StatMost (DataMost Corp.). A P-value of <0.05 was considered significant.
Supplementary Material
Fig. S1 Haplotype blocks in APOE, HRAS1, and LASS1. Haplotype blocks for the three genes were examined using Haploview after stratifying the populations using Structure assignment probabilities of 0.8 and 0.9 (in parentheses below) for European origin. A – Georgia (0.9), B – Georgia (0.8), C – Louisiana (0.9), and D – Louisiana (0.8). Among the differences between the two populations, the large haplotype block in HRAS1 that is evident in the Louisiana population at 0.9 and 0.8 assignment probabilities is only apparent in Georgia at 0.9 assignment probability, and the haplotype block seen in LASS1 in the Louisiana population is not apparent in the Georgia population. No tag SNP in the haplotype blocks were identified.
Acknowledgments
Supported by grants from the National Institute on Aging of the National Institutes of Health (P01 AG017553 and P01 AG022064) and by the Louisiana Board of Regents through the Millennium Trust Health Excellence Fund [HEF(2001-06)-02]. We thank the people of Georgia and Louisiana for participation in our study. We acknowledge the valuable recruitment, data acquisition, data management, and fiscal management efforts of M. Burgess, K. Grier, E. Jackson, E. McCarthy, K. Shaw, L. Strong, S. Reynolds, S. Anderson, E. Cassidy, M. Janke, T. Savla, M. Durden, M. Cervantes, D. Rouzan, and T. Beard.
Additional authors include for The Georgia Centenarian Study: R.C. Green, M. Gearing, W.R. Markesbery, J.L. Woodard, M.A. Johnson, J.S. Tenover, I.C. Siegler, P. Martin, M. MacDonald, C. Rott, W.L. Rodgers, and A. Davey; for The Louisiana Healthy Aging Study: M. Allen, I.E. Antikainen, A.M. Arce, J. Arceneaux, E.O. Boudreaux, L. Byerley, P.A. Callinan, C.M. Champagne, H. Cheng, Y.-w. Chiu, L. Cosenza, M.E. Cress, M. Czarny-Ratajczak, J.P. DeLany, J. Denver, A. Deutsch, M.J. deVeer, D.A. Dobrosielski, R. Ellis, A. Ermolao, M. Erwin, M. Erwin, J. Fabre, E. Fontham, M. Frisard, P. Geiselman, L. Goodwin, V. Greco, S. Hadie, T. Hall, M. Hamilton, S.W. Herke, K. Hawley, J. Hayden, K. Hebert, F. Holton, H.-C. Hsu, D. Johannsen, L. Kawasaki, B. Kimball, C. King-Rowley, M. Konkel, R. Kuhn, K. Landry, C. Lavie, D. LaVie, M. Leblanc, H.-Y. Lin, K. Lopez, B. McEvoy-Hein, J.D. Mountz, E. Olinde, J. Owens, K. Pedersen, A. Pellett, P. Remedios, Y. Robertson, J. Rood, H. Rothschild, R.A. Russell, E. Sandifer, B. Schmidt, R. Schwartz, D.K. Scott, J. Silva, F.N. Standberry, J. Thomson, A. Tiwari, V. Toups, C. Traylor, C. Velasco-Gonzalez, C. Waguespack, X.-Y. Wang, R.H. Wood, Q. Yu, S. Zehr, and P. Zhang.
References
- Artiga MJ, Bullido MJ, Sastre I, Recuero M, Garcia MA, Aldudo J, Vázquez J, Valdivieso F. Allelic polymorphisms in the transcriptional regulatory region of apolipoprotein E gene. FEBS Lett. 1998a;421:105–108. doi: 10.1016/s0014-5793(97)01543-3. [DOI] [PubMed] [Google Scholar]
- Artiga MJ, Bullido MJ, Frank A, Sastre I, Recuero M, Garcia MA, Lendon CL, Han SW, Morris JC, Vázquez J, Goate A, Valdivieso F. Risk of Alzheimer’s disease correlates with transcriptional activity of the APOE gene. Hum. Molec. Genet. 1998b;7:1887–1892. doi: 10.1093/hmg/7.12.1887. [DOI] [PubMed] [Google Scholar]
- Bamshad MJ, Wooding S, Watkins WS, Ostler CT, Batzer MA, Jorde LB. Human population genetic structure and inference of group membership. Am. J. Hum. Genet. 2003;72:578–589. doi: 10.1086/368061. [DOI] [PMC free article] [PubMed] [Google Scholar]
- Bergman A, Atzmon G, Ye K, MacCarthy T, Barzilai N. Buffering mechanisms in aging: a systems approach toward uncovering the genetic component of aging. PLoS Comput. Biol. 2007;3:e170. doi: 10.1371/journal.pcbi.0030170. [DOI] [PMC free article] [PubMed] [Google Scholar]
- Bonafé M, Barbi C, Olivieri F, Yashin A, Andreev KF, Vaupel JW, De Benedictis G, Rose G, Carrieri G, Jazwinski SM, Franceschi C. An allele of HRAS1 3′variable number of tandem repeats is a frailty allele: Implication for an evolutionarily-conserved pathway involved in longevity. Gene. 2002;286:121–126. doi: 10.1016/s0378-1119(01)00812-5. [DOI] [PubMed] [Google Scholar]
- Chen JB, Sun J, Jazwinski SM. Prolongation of the yeast life span by the v-Ha-Ras oncogene. Molec. Microbiol. 1990;4:2081–2086. doi: 10.1111/j.1365-2958.1990.tb00568.x. [DOI] [PubMed] [Google Scholar]
- Christensen K, Johnson TE, Vaupel JW. The quest for genetic determinants of human longevity: Challenges and insights. Nature Rev. Genet. 2006;7:436–448. doi: 10.1038/nrg1871. [DOI] [PMC free article] [PubMed] [Google Scholar]
- D’mello NP, Childress AM, Franklin DS, Kale SP, Pinswasdi C, Jazwinski SM. Cloning and characterization of LAG1, a longevity gene in yeast. J. Biol. Chem. 1994;269:15451–15459. [PubMed] [Google Scholar]
- Dai J, Li L, Kim S, Kimball B, Jazwinski SM, Arnold J, the Georgia Centenarian Study Exact sample size needed to detect dependence in 2 × 2 × 2 tables. Biometrics. 2007;63:1245–1253. doi: 10.1111/j.1541-0420.2007.00801.x. [DOI] [PMC free article] [PubMed] [Google Scholar]
- De Benedictis G, Tan Q, Jeune B, Christensen K, Ukraintseva SV, Bonafè M, Franceschi C, Vaupel JW, Yashin AI. Recent advances in human gene-longevity association studies. Mech. Ageing Dev. 2001;122:909–920. doi: 10.1016/s0047-6374(01)00247-0. [DOI] [PubMed] [Google Scholar]
- Dickson RC. More chores for TOR: De novo ceramide synthesis. Cell Metabolism. 2008;7:99–100. doi: 10.1016/j.cmet.2008.01.002. [DOI] [PubMed] [Google Scholar]
- Evert J, Lawler E, Bogan H, Perls T. Morbidity profiles of centenarians: survivors, delayers, and escapers. J. Gerontol. A Biol. Sci. Med. Sci. 2003;58:232–237. doi: 10.1093/gerona/58.3.m232. [DOI] [PubMed] [Google Scholar]
- Excoffier L, Laval G, Schneider S. Arlequin ver. 3.0: An integrated software package for population genetics data analysis. Evolutionary Bioinformatics Online. 2005;1:47–50. [PMC free article] [PubMed] [Google Scholar]
- Finch CE, Ruvkun G. The genetics of aging. Ann. Rev. Genomics Hum. Genet. 2001;2:435–462. doi: 10.1146/annurev.genom.2.1.435. [DOI] [PubMed] [Google Scholar]
- Flint J, Mackay TF. Genetic architecture of quantitative traits in mice, flies, and humans. Genome Res. 2009;19:723–733. doi: 10.1101/gr.086660.108. [DOI] [PMC free article] [PubMed] [Google Scholar]
- Gabriel SB, Schaffner SF, Nguyen H, Moore JM, Roy J, Blumenstiel B, Higgins J, DeFelice M, Lochner A, Faggart M, Liu-Cordero SN, Rotimi C, Adeyemo A, Cooper R, Ward R, Lander ES, Daly MJ, Altshuler D. The structure of haplotype blocks in the human genome. Science. 2002;296:2225–2229. doi: 10.1126/science.1069424. [DOI] [PubMed] [Google Scholar]
- Guillas I, Jiang JC, Vionnet C, Roubaty C, Uldry D, Chuard R, Wang J, Jazwinski SM, Conzelmann A. Human homologues of LAG1 reconstitute Acyl-CoA-dependent ceramide synthesis in yeast. J. Biol. Chem. 2003;278:37083–37091. doi: 10.1074/jbc.M307554200. [DOI] [PubMed] [Google Scholar]
- Hong MG, Reynolds C, Gatz M, Johansson B, Palmer JC, Gu HF, Blennow K, Kehoe PG, de Faire U, Pedersen NL, Prince JA. Evidence that the gene encoding insulin degrading enzyme influences human lifespan. Hum. Molec. Genet. 2008;17:2370–2378. doi: 10.1093/hmg/ddn137. [DOI] [PMC free article] [PubMed] [Google Scholar]
- Jazwinski SM. Longevity, genes, and aging. Science. 1996;273:54–59. doi: 10.1126/science.273.5271.54. [DOI] [PubMed] [Google Scholar]
- Jazwinski SM, Conzelmann A. LAG1 puts the focus on ceramide signaling. Int. J. Biochem. Cell Biol. 2002;34:1491–1495. doi: 10.1016/s1357-2725(02)00044-4. [DOI] [PubMed] [Google Scholar]
- Jiang JC, Kirchman PA, Allen M, Jazwinski SM. Suppressor analysis points to the subtle role of the LAG1 ceramide synthase gene in determining yeast longevity. Exp. Gerontol. 2004;39:999–1009. doi: 10.1016/j.exger.2004.03.026. [DOI] [PubMed] [Google Scholar]
- Kenyon C. The plasticity of aging: Insights from long-lived mutants. Cell. 2005;120:449–460. doi: 10.1016/j.cell.2005.02.002. [DOI] [PubMed] [Google Scholar]
- Koybasi S, Senkal CE, Sundararaj K, Spassieva S, Bielawski J, Osta W, Day TA, Jiang JC, Jazwinski SM, Hannun YA, Obeid LM, Ogretmen B. Defects in cell growth regulation by C18:0-ceramide and longevity assurance gene 1 in human head and neck squamous cell carcinomas. J. Biol. Chem. 2004;279:44311–44319. doi: 10.1074/jbc.M406920200. [DOI] [PubMed] [Google Scholar]
- Kulminski AM, Ukraintseva SV, Culminskaya IV, Arbeev KG, Land KC, Akushevich L, Yashin AI. Cumulative deficits and physiological indices as predictors of mortality and long life. J. Gerontol. A Biol. Sci. Med. Sci. 2008;63:1053–1059. doi: 10.1093/gerona/63.10.1053. [DOI] [PMC free article] [PubMed] [Google Scholar]
- Kusminski CM, Shetty S, Orci L, Unger RH, Scherer PE. Diabetes and apoptosis: lipotoxicity. Apoptosis. 2009;14:1484–1495. doi: 10.1007/s10495-009-0352-8. [DOI] [PubMed] [Google Scholar]
- Mahley RW, Rall SJ. Apolipoprotein E: Far more than a lipid transport protein. Ann. Rev. Genomics Hum. Genet. 2000;1:507–537. doi: 10.1146/annurev.genom.1.1.507. [DOI] [PubMed] [Google Scholar]
- Mehta R, Steinkraus KA, Sutphin GL, Ramos FJ, Shamieh LS, Huh A, Davis C, Chandler-Brown D, Kaeberlein M. Proteasomal regulation of the hypoxic response modulates aging in C. elegans. Science. 2009;324:1196–1198. doi: 10.1126/science.1173507. [DOI] [PMC free article] [PubMed] [Google Scholar]
- Menuz V, Howell KS, Gentina S, Epstein S, Riezman I, Fornallaz-Mulhauser M, Hengartner MO, Gomez M, Riezman H, Martinou JC. Protection of C. elegans from anoxia by HYL-2 ceramide synthase. Science. 2009;324:381–384. doi: 10.1126/science.1168532. [DOI] [PubMed] [Google Scholar]
- Migliaccio E, Giorgio M, Mele S, Pelicci G, Reboldi P, Pandolfi PP, Lanfrancone L, Pelicci PG. The p66shc adaptor protein controls oxidative stress response and life span in mammals. Nature. 1999;402:309–313. doi: 10.1038/46311. [DOI] [PubMed] [Google Scholar]
- Ogretmen B, Hannun Y. Biologically active sphingolipids in cancer pathogenesis and treatment. Nature Rev. Cancer. 2004;4:604–616. doi: 10.1038/nrc1411. [DOI] [PubMed] [Google Scholar]
- Pritchard JK, Stephens M, Donnelly P. Inference of population structure using multilocus genotype data. Genetics. 2000;155:945–959. doi: 10.1093/genetics/155.2.945. [DOI] [PMC free article] [PubMed] [Google Scholar]
- Ramos KS. Redox regulation of c-Ha-ras and osteopontin signaling in vascular smooth muscle cells: Implications in chemical atherogenesis. Ann. Rev. Pharmacol. Toxicol. 1999;39:243–265. doi: 10.1146/annurev.pharmtox.39.1.243. [DOI] [PubMed] [Google Scholar]
- Ray DA, Walker JA, Hall A, Llewellyn B, Ballantyne J, Christian AT, Turteltaub K, Batzer MA. Inference of human geographic origins using Alu insertion polymorphisms. Forensic Sci. Int. 2005;153:117–124. doi: 10.1016/j.forsciint.2004.10.017. [DOI] [PubMed] [Google Scholar]
- Rockwood K, Mitnitski A. Frailty in relation to the accumulation of deficits. J. Gerontol. A Biol. Sci. Med. Sci. 2007;62:722–727. doi: 10.1093/gerona/62.7.722. [DOI] [PubMed] [Google Scholar]
- Sanchez MS, Basten CJ, Ferrenberg AM, Asmussen MA, Arnold J. Exact sample sizes needed to detect dependence in 2 × 3 tables. Theor. Pop. Biol. 2006;69:111–120. doi: 10.1016/j.tpb.2005.11.001. [DOI] [PubMed] [Google Scholar]
- Schächter F, Faure-Delanef L, Guénot F, Rouger H, Froguel P, Lesueur-Ginot L, Cohen D. Genetic associations with human longevity at the APOE and ACE loci. Nature Genet. 1994;6:29–32. doi: 10.1038/ng0194-29. [DOI] [PubMed] [Google Scholar]
- Searle SD, Mitnitski A, Gahbauer EA, Gill TM, Rockwood K. A standard procedure for creating a frailty index. BMC Geriatr. 2008 doi: 10.1186/1471-2318-8-24. http://www.biomedcentral.com/1471-2318/8/24. [DOI] [PMC free article] [PubMed] [Google Scholar]
- Song Y, Stampfer MJ, Liu S. Meta-analysis: Apolipoprotein E genotypes and risk for coronary heart disease. Ann. Intern. Med. 2004;141:137–147. doi: 10.7326/0003-4819-141-2-200407200-00013. [DOI] [PubMed] [Google Scholar]
- Strittmatter WJ, Saunders AM, Schmechel D, Pericak-Vance M, Enghild J, Salvesen GS, Roses AD. Apolipoprotein E: High-avidity binding to beta-amyloid and increased frequency of type 4 allele in late-onset Alzheimer disease. Proc. Natl. Acad. Sci. USA. 1993;90:1977–1981. doi: 10.1073/pnas.90.5.1977. [DOI] [PMC free article] [PubMed] [Google Scholar]
- Suh Y, Atzmon G, Cho MO, Hwang D, Liu B, Leahy DJ, Barzilai N, Cohen P. Functionally significant insulin-like growth factor I receptor mutations in centenarians. Proc. Natl. Acad. Sci. USA. 2008;105:3438–3442. doi: 10.1073/pnas.0705467105. [DOI] [PMC free article] [PubMed] [Google Scholar]
- Sun J, Kale SP, Childress AM, Pinswasdi C, Jazwinski SM. Divergent roles of RAS1 and RAS2 in yeast longevity. J. Biol. Chem. 1994;269:18638–18645. [PubMed] [Google Scholar]
- Tedesco P, Jiang J, Wang J, Jazwinski SM, Johnson TE. Genetic analysis of hyl-1, the C. elegans homolog of LAG1/LASS1. Age. 2008;30:43–52. doi: 10.1007/s11357-008-9046-3. [DOI] [PMC free article] [PubMed] [Google Scholar]
- Terry DF, Sebastiani P, Andersen SL, Perls TT. Disentangling the roles of disability and morbidity in survival to exceptional old age. Arch. Intern. Med. 2008;168:277–283. doi: 10.1001/archinternmed.2007.75. [DOI] [PMC free article] [PubMed] [Google Scholar]
- Thornton-Wells TA, Moore JJ, Haines JL. Genetics, statistics and human disease: Analytical retooling for complexity. Trends Genet. 2004;20:640–647. doi: 10.1016/j.tig.2004.09.007. [DOI] [PubMed] [Google Scholar]
- Tishkoff SA, Pakstis AJ, Ruano G, Kidd KK. The accuracy of statistical methods for estimation of haplotype frequencies: An example from the CD4 locus. Am. J. Hum. Genet. 2000;67:518–522. doi: 10.1086/303000. [DOI] [PMC free article] [PubMed] [Google Scholar]
- Watkins WS, Rogers AR, Ostler CT, Wooding S, Bamshad MJ, Brassington AM, Carroll ML, Nguyen SV, Walker JA, Prasad BV, Reddy PG, Das PK, Batzer MA, Jorde LB. Genetic variation among world populations: Inferences from 100 Alu insertion polymorphisms. Genome Res. 2003;13:1607–1618. doi: 10.1101/gr.894603. [DOI] [PMC free article] [PubMed] [Google Scholar]
- Willcox BJ, Donlon TA, He Q, Chen R, Grove JS, Yano K, Masaki KH, Willcox DC, Rodriguez B, Curb JD. FOXO3A genotype is strongly associated with human longevity. Proc. Natl. Acad. Sci. USA. 2008;105:13987–13992. doi: 10.1073/pnas.0801030105. [DOI] [PMC free article] [PubMed] [Google Scholar]
- Witting SR, Maiorano JN, Davidson WS. Ceramide enhances cholesterol efflux to apolipoprotein A-I by increasing the cell surface presence of ATP-binding cassette transporter A1. J. Biol. Chem. 2003;278:40121–40127. doi: 10.1074/jbc.M305193200. [DOI] [PubMed] [Google Scholar]
- Woo JG, Dolan LM, Deka R, Kaushal RD, Shen Y, Pal P, Daniels SR, Martin LJ. Interactions between noncontiguous haplotypes in the adiponectin gene ACDC are associated with plasma adiponectin. Diabetes. 2006;55:523–529. doi: 10.2337/diabetes.55.02.06.db05-0446. [DOI] [PubMed] [Google Scholar]
- Zhao J, Jin L, Xiong M. Test for interaction between two unlinked loci. Am. J. Hum. Genet. 2006;79:831–845. doi: 10.1086/508571. [DOI] [PMC free article] [PubMed] [Google Scholar]
Associated Data
This section collects any data citations, data availability statements, or supplementary materials included in this article.
Supplementary Materials
Fig. S1 Haplotype blocks in APOE, HRAS1, and LASS1. Haplotype blocks for the three genes were examined using Haploview after stratifying the populations using Structure assignment probabilities of 0.8 and 0.9 (in parentheses below) for European origin. A – Georgia (0.9), B – Georgia (0.8), C – Louisiana (0.9), and D – Louisiana (0.8). Among the differences between the two populations, the large haplotype block in HRAS1 that is evident in the Louisiana population at 0.9 and 0.8 assignment probabilities is only apparent in Georgia at 0.9 assignment probability, and the haplotype block seen in LASS1 in the Louisiana population is not apparent in the Georgia population. No tag SNP in the haplotype blocks were identified.