

Abstract
Objectives
To evaluate the effect of urbanization and ethnicity on correlations between waist circumference (WC) and obesity related cardiovascular risk factors.
Methods
1471 rural and urban Cameroonians, and 4185 French, from community based studies, aged ≥25 years, not treated for hypertension, diabetes and dyslipidemia participated to this study. Slopes of obesity related abnormalities with WC were compared using an interaction term between place of residence and WC.
Results
Women in urban Cameroon and men in France had significantly higher WC and BMI relative to their gender counterparts. Urban Cameroonians had higher abdominal adiposity, but lower BP and better metabolic profile than the French. WC was positively associated to all the obesity related abnormalities in the three sites except to FPG (both genders) and blood lipids (women) in rural Cameroon. A 5cm larger WC was associated with a higher increment among urban than rural Cameroonians for diastolic blood pressure (DBP) (women, 1.95/0.63mmHg; men, 2.56/1.44mmHg), HOMA-IR (women, 0.11/0.05), fasting plasma glucose (FPG) (men, 0.09/−0.01mmol/l) and triglycerides (women, 0.06/0.01mmol/l; men, 0.09/0.03mmol/l), all p<0.05. A 5cm larger WC was associated with a higher increment among urban Cameroon than French people for DBP (women, 1.95/1.28mmHg, p<0.01; men, 2.56/1.49mmHg, p<0.01), but with a lower increment for HOMA-IR (women, 0.11/0.14, p<0.05), FPG (women, 0.05/0.09mmol/l), total cholesterol (women, 0.07/0.11mmol/l; men, 0.10/0.13mmol/l) and triglycerides (women, 0.06/0.11mmol/l; men, 0.09/0.13mmol/l) all p<0.05.
Conclusion
Ethnicity and urbanization modify the association of WC with obesity related metabolic abnormalities. WC cut-off points derived from Caucasians may not be appropriate for black Sub-Saharan Africans.
Keywords: Abdominal obesity, cardiovascular risk factors, ethnicity, urbanization, Sub-Saharan Africa
Introduction
Fat accumulation is associated with numerous co-morbidities such as cardiovascular diseases (CVD), sleep disorders and gall bladder diseases.1–4 For CVD, fat accumulation affects the risk of major outcomes, both directly and indirectly through its links with risk factors such as hypertension, type 2 diabetes, insulin resistance, lipid disorders and other metabolic and haematologic abnormalities.3, 5–8 Because of this association, surrogate measures of fat accumulation, including body mass index (BMI), waist circumference (WC) and waist-to-hip ratio (WHR) have been used to predict related CVD risk in populations. Studies have suggested that WC may be a better anthropometric predictor of CVD risk than either BMI or WHR.9–11 Indeed, WC is a surrogate measure of total body and abdominal fat accumulation, not accounted for by either BMI or WHR.8, 12 WC is better correlated with visceral adipose tissue than are BMI or WHR, and is thus used as surrogate.13 However, this correlation with WC varies significantly across ethnicities.14
Reports on ethnic differences in the association of WC with obesity related abnormalities are available for Caucasians, Asians and Black Americans, but not for Africans.15–17 In spite of the high prevalence of obesity among populations from Sub-Saharan Africa,18–20 obesity related metabolic abnormalities are reported at much lower frequencies than among populations from developed countries.21 Genetic and environmental factors could explain these differences. Using data from Cameroon and France, we tested the hypothesis that the association of central obesity with a number of obesity related abnormalities is influenced by urbanization and ethnicity.
Methods and procedures
Study populations
The Cameroon study22, 23 and the French D.E.S.I.R. (Données Epidémiologiques sur le Syndrome d’Insulino-Résistance) study24, 25 are respectively population based and community based studies of type 2 diabetes and CVD risk factors, both initiated in 1994. The Cameroon 1994 study included 1986 Black African adults, 786 rural and 1160 urban subjects. The French study included 5212 adults, recruited from volunteers insured by the French Social Security System, which offers periodic health examinations free of charge to all affiliates.
Because the relationship between the studied risk factors of CVD and WC may be influenced by the duration of the factor existence and its treatment, subjects with physician diagnosis or specific treatment for hypertension, diabetes and dyslipidaemia were excluded from the analyses. Data on variables of interest were available for 1471 participants in Cameroon and 4185 in France. All individuals gave informed consent to participate. The studies were approved by relevant ethics committees in Cameroon and in France, and conformed to the principles outlined in the declaration of Helsinki.
Data collection and definition of variables
Height, weight, waist and hip circumferences were measured by trained personnel as previously described.22–25 BMI was computed as weight (kg)/height2 (m)2. Waist to hip ratio (WHR) was the waist circumference divided by the hip circumference. Diastolic and systolic blood pressures (DBP and SBP) were measured on the right arm after at least 5 minutes of rest, with subjects in supine position, using a standard mercury sphygmomanometer and appropriate cuff sizes. Mean arterial pressure (MAP) was calculated as DBP + (SBP − DBP)/3. Venous blood samples were collected after an overnight fast of at least 12 hours for the determination of plasma glucose, insulin, total cholesterol and triglycerides. In Cameroon, samples for insulin determination were collected on ice, centrifuged immediately, separated and stored at −70° C until assayed. Fasting plasma glucose (FPG) was determined by the glucose-oxidase method using a spectrophotometer with external quality control on every 4th sample by a Cobas bio hexokinase fluorometric method. Plasma insulin was assayed at the Welcome Laboratories, University of Newcastle Upon Tyne, by ELISA method using DAKO kits (Hersteller, UK). Serum cholesterol and triglycerides were measured by enzymatic colorimetric methods in the same laboratory. In France, samples were analyzed in laboratories participating in a national quality control program. Plasma glucose was assayed by the glucose oxidase method applied to fluoro-oxalated plasma using a Technicon RA 1000 (Bayer Diagnostics, France) or a KONA (Konelab, Evry, France). Serum insulin was centrally assayed at the Institut inter Régional pour la Santé by MIEA (Micro Particle Enzyme Immunoassay) with the IMX automated analyzer (Abbot, France). Serum cholesterol and triglycerides were determined with a DAX24 technique (Bayer Diagnostics, France) or with KONE (Konelab, Evry, France). Homeostasis assessment model for insulin resistance (HOMA-IR) was calculated as: Fasting plasma glucose (mmol/l) × Fasting plasma insulin (μU/ml)/22.5.
Statistical analyses
STATA 8.02 (Statacorp., Texas, USA) was used for statistical analyses. All tests were two-sided and the significance level was p<0.05. Data are presented as mean (standard deviation) and beta coefficients. HOMA-IR and fasting triglycerides were not normally distributed and were logarithmically transformed.
As there was not significant evidence of non linearity between WC and obesity related abnormalities, comparison of variables across places of residence used linear regression analyses, with and without adjustment for age. Regression analyses were used to characterize the associations between WC and SBP, DBP, MAP, fasting plasma glucose, HOMA-IR, total cholesterol and fasting triglycerides for the three places of residence. An interaction term between gender and WC was used to test whether the effect of WC on obesity related abnormalities varied with gender. Comparison of slopes for obesity related abnormalities with WC across places of residence used appropriate contrasts for places of residence and an interaction term between place of residence and WC. The effect of urbanization was tested by comparing rural and urban Cameroon and the effect of ethnicity by comparing urban Cameroon and France. Adjustments were made for age to take into account the effect of age differences across places of residence on the studied parameters. To account for the effect of differences in hip circumference distribution according to gender and place of residence, the same analyses were performed using WHR instead of WC.
Results
Characteristics of the study population
For both genders, urban Cameroonians were younger than rural Cameroonians and the French people, and rural Cameroonian population is more heterogeneous for age (Table 1). Urban Cameroonian women had the highest mean values of weight, BMI, WC and hip circumference. Rural Cameroonian women had higher values of WHR than their urban Cameroonian counterpart or French women. In men, the lowest value of WHR was found in urban Cameroonians. Weight and WC of men increased from the rural to urban Cameroon and to France. Height and BMI of men was not significantly different in urban Cameroon and France. DBP, fasting total cholesterol and HOMA-IR increased in both genders from rural to urban Cameroon to France (Table 1).
Table 1.
Clinical and biological characteristics [means (standard deviation)] of the study population across place of residence, stratified on gender:
| Women |
Men |
|||||||
|---|---|---|---|---|---|---|---|---|
| Rural | Urban | France | P* | Rural | Urban | France | P* | |
| N | 362 | 472 | 2101 | 245 | 392 | 2084 | ||
| Age (years) | 45.8 (12.9)a | 36.8 (8.9)a,b | 45.3 (9.7)b | 0.001 | 45.7 (13.8)a | 37.4 (9.0)a,b | 45.2 (9.6)b | 0.001 |
| Weight (kg) | 57.2 (9.2)a,b | 67.6 (10.9)a,c | 60.0 (9.3)b,c | 0.001 | 63.7 (10.2)a,b | 73.7 (11.9)a,c | 74.9 (10.1)b,c | 0.001 |
| Height (cm) | 160.5 (6.5)a | 161.4 (5.7)a,b | 160.0 (6.0)b | 0.004 | 170.4 (7.6)a,b | 172.4 (6.9)a | 173.1 (6.4)b | 0.001 |
| Body mass Index (kg/m2) | 22.1 (3.0)a,b | 26.0 (3.9)a,c | 23.4 (3.5)b,c | 0.001 | 21.8 (2.7)a,b | 24.8 (3.5)a | 25.0 (3.0)b | 0.001 |
| Waist circumference (cm) | 82.0 (8.5)a,b | 83.2 (8.9)a,c | 75.6 (9.3)b,c | 0.001 | 80.7 (8.4)a,b | 81.3 (8.6)a,c | 88.4 (8.8)b,c | 0.001 |
| Hip circumference (cm) | 91.5 (8.1)a,b | 102.7 (8.4)a,c | 96.3 (7.6)b,c | 0.001 | 89.7 (7.1)a,b | 98.1 (7.7)a,c | 96.9 (6.0)b,c | 0.001 |
| Waist to hip ratio | 0.90 (0.1)a,b | 0.78 (0.06)a | 0.78 (0.06)b | 0.001 | 0.90 (0.09)a | 0.85 (0.05)a,b | 0.91 (0.06)b | 0.001 |
| Systolic blood pressure (mmHg) | 114.5 (19.0)a,b | 111.8 (12.9)a,c | 124.1 (14.3)b,c | 0.001 | 120.1 (16.7)a | 120.2 (16.1)b | 131.0 (13.4)a,b | 0.001 |
| Diastolic blood pressure (mmHg) | 70.8 (11.5)a,b | 73.2 (10.0)a,c | 76.2 (8.9)b,c | 0.001 | 73.3 (11.2)a,b | 79.3 (11.0)a,c | 80.8 (9.0)b,c | 0.001 |
| Mean arterial pressure (mmHg) | 85.4 (13.0)a | 86.0 (10.2)b | 92.2 (10.0)a,b | 0.001 | 88.9 (11.9)a,b | 93.0 (11.9)a,c | 97.5 (9.6)b,c | 0.001 |
| Fasting plasma glucose (mmol/l) | 4.4 (1.1)a | 4.2 (0.8)b | 5.0 (0.7)a,b | 0.001 | 4.1 (1.5)a | 4.2 (1.4)b | 5.4 (0.7)a,b | 0.001 |
| Fasting triglycerides (mmol/l) | 0.5 (1.4)a,b | 0.4 (1.5)a,c | 0.8 (1.6)b,c | 0.001 | 0.5 (1.5)a | 0.5 (1.6)b | 1.1 (1.7)a,b | 0.001 |
| Fasting total cholesterol (mmol/l) | 2.6 (0.7)a,b | 3.6 (0.8)a,c | 5.6 (1.0)b,c | 0.001 | 2.5 (0.6)a,b | 3.4 (0.9)a,c | 5.8 (1.0)b,c | 0.001 |
| HOMA-IR | 0.5 (2.2)a,b | 1.0 (2.0)a,c | 1.2 (1.7)b,c | 0.001 | 0.3 (2.0)a,b | 0.8 (2.2)a,c | 1.3 (1.8)b,c | 0.001 |
HOMA-IR and fasting triglycerides where logarithmically transformed before computing the statistical tests.
in each gender, pairs with the same alphabetic letter in each gender are significantly different with significance level p < 0.01.
P for ANOVA.
After adjusting for age, the height of women was no longer significantly different across places of residence, and their WC was no longer significantly different in rural and urban Cameroon (data not shown); also, the DBP of men was no longer different in urban Cameroon and France.
Gender differences in anthropometry
WC and BMI of women and men were not different in rural Cameroon (WC: p=0.056; BMI: p=0.25), were higher for women than for men in urban Cameroon (WC: p<0.03; BMI: p<0.001), and were lower for women than for men in France (WC: p<0.001; BMI: p<0.001). Hip circumference was higher for women compared to men in Cameroon (both sites, p < 0.001) and lower in women compared to men in France (p<0.001) (Table 1). Men had higher WHR in urban Cameroon and in France in comparison to women.
Interaction between gender and WC for obesity related abnormalities
The association between WC and blood pressure, fasting blood glucose and total cholesterol did not vary according to gender, for each place of residence. The same increase in WC led to a higher increase of HOMA-IR in men compared to women in rural Cameroon (p<0.01), urban Cameroon (p<0.006) and France (p<0.001), and to a higher increase of fasting triglycerides in men compared to women in urban Cameroon (p<0.03) and France (p<0.001).
Association of WC with obesity related abnormalities, and effects of urbanization and ethnicity
In univariate analysis, all the obesity related abnormalities significantly increased with WC irrespective of gender and place of residence, except, in rural Cameroon, for fasting plasma glucose (both genders) and blood lipids (women) (Table 2). After adjustment for age, DBP and MAP (rural Cameroonian women), fasting plasma glucose (urban Cameroonian women), fasting total cholesterol (Cameroonian women and men) and fasting triglycerides (rural Cameroonian women) no longer varied significantly with WC (Figure 1).
Table 2.
Changes in obesity related abnormalities (beta coefficients, univariate analysis) for a 5 cm increase in waist circumference, by place of residence and gender:
| Rural Cameroon |
Urban Cameroon |
France |
P for difference of slopes |
|
|---|---|---|---|---|
| Women |
||||
| Systolic blood pressure (mmHg) | 1.65*** | 2.62*** | 2.43*** | 0.2 |
| Diastolic blood pressure (mmHg) | 0.63** | 1.95***C | 1.28***Y | 0.001 |
| Mean arterial pressure (mmHg) | 0.97** | 2.17*** | 1.65*** | 0.10 |
| HOMA-IR | 0.05** | 0.11***A | 0.14***X | 0.001 |
| Fasting plasma glucose (mmol/l) | −0.02 | 0.05* | 0.09***Y | 0.001 |
| Fasting cholesterol (mmol/l) | 0.04 | 0.07** | 0.11***Z | 0.04 |
| Fasting triglycerides (mmol/l) | 0.01 | 0.06***B | 0.11***Z | 0.001 |
| Men |
||||
| Systolic blood pressure (mmHg) | 2.95*** | 3.61*** | 2.39***Y | 0.01 |
| Diastolic blood pressure (mmHg) | 1.44*** | 2.56***C | 1.49***Y | 0.001 |
| Mean arterial pressure (mmHg) | 1.94*** | 2.91*** | 1.79*** | 0.08 |
| HOMA-IR | 0.14*** | 0.18*** | 0.17*** | 0.2 |
| Fasting plasma glucose (mmol/l) | −0.01 | 0.09***B | 0.10*** | 0.01 |
| Fasting cholesterol (mmol/l) | 0.06** | 0.10*** | 0.13***Z | 0.001 |
| Fasting triglycerides (mmol/l) | 0.03* | 0.09***B | 0.13***Z | 0.001 |
Results are from regression models for each of SBP, DBP, HOMA-IR, logarithm of fasting plasma glucose, total cholesterol and logarithm fasting triglycerides with waist circumference.
For the significance of each slope compared to zero slope in each model,
p<0.05;
p<0.01;
p < 0.001.
For the comparison of slopes between urban and rural Cameroon,
A = p<0.05;
B = p<0.01;
C = p < 0.001.
For the comparison of slopes between urban Cameroon and France,
X = p<0.05;
Y = p<0.01;
Z = p < 0.001.
Figure 1.
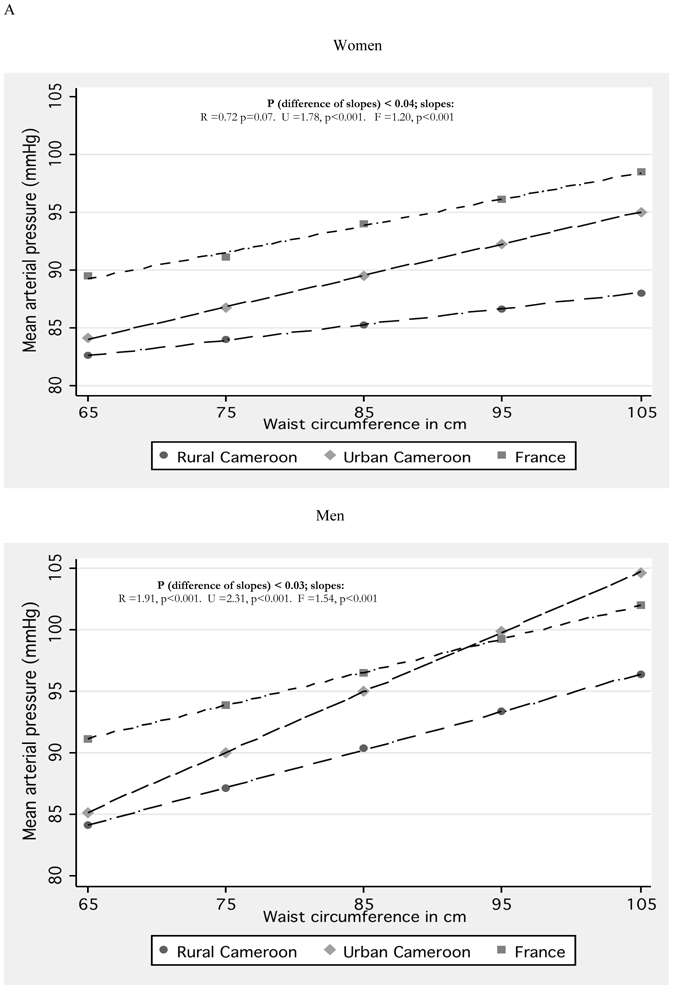
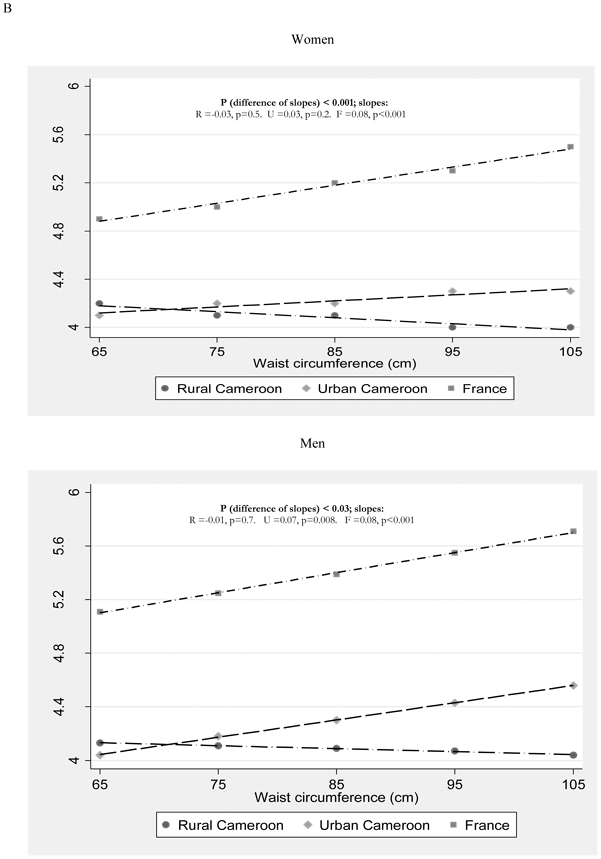
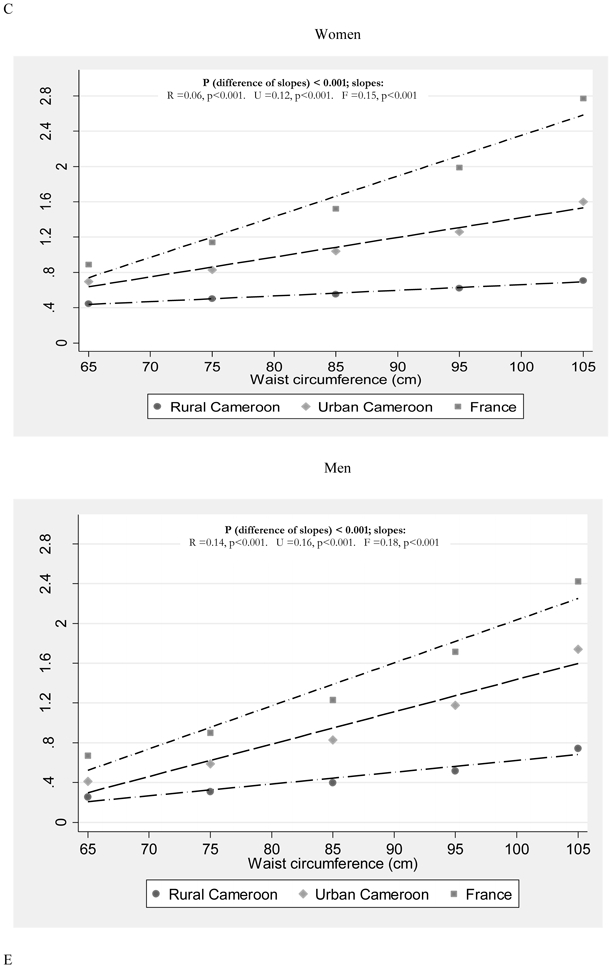
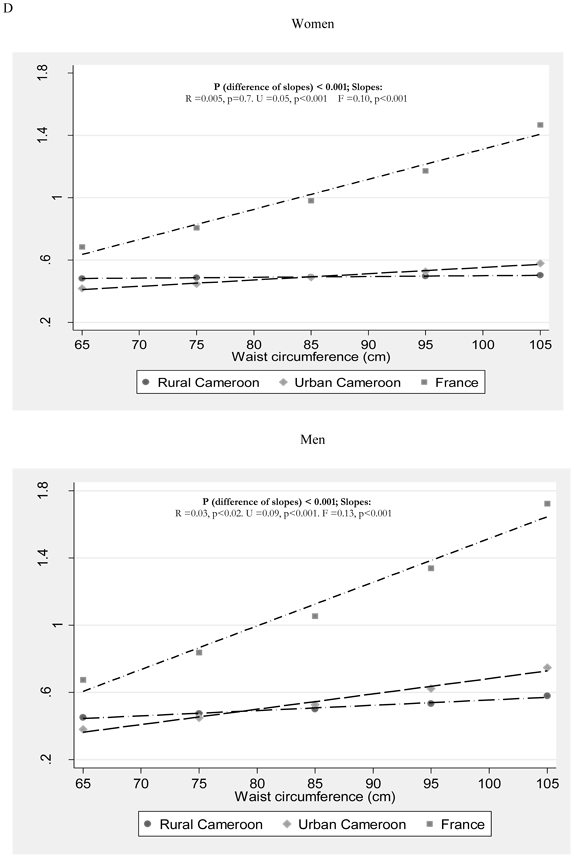
Age-adjusted mean arterial pressure (MAP) (A), fasting plasma glucose (B), HOMA-IR (C), and triglycerides (D) according to waist circumference, by place of residence and gender. R (rural), U (urban) and F (French) represent the increase in each parameter for a 5 cm increase in waist circumference.
The p for slope tests whether the slope differs from zero.
In univariate analysis, for a 5 cm increase in WC, there was a higher increase in urban compared to rural Cameroonians for DBP (3 fold in women and 1.8 fold in men), HOMA-IR (2.2 fold in women), FPG (9 fold in men) and fasting triglycerides (6 fold in women and 3 fold in men) of urban compared to rural Cameroonians (Table 2). These trends persisted after adjusting for age (Figure 1).
In urban Cameroonians compared to the French, a 5 cm increase in WC was associated with a higher increase of SBP (significant only in men) and DBP but with a lower increase of HOMA-IR (1.3 fold in women), FPG (1.8 fold in men), fasting total cholesterol (1.6 fold in women and 1.3 fold in men) and fasting triglycerides (1.8 fold in women and 1.3 fold in men) of the French compared to urban Cameroonians (Table 2). After adjusting for age, fasting cholesterol did not significantly differ according to urbanization or ethnicity (Figure 1).
Association of WHR and obesity related abnormalities, and effects of urbanization and ethnicity
In rural Cameroon, only fasting triglycerides in men increased significantly with WHR. All the obesity related abnormalities increased significantly with WHR except HOMA-IR and fasting plasma glucose in urban women and fasting total cholesterol in urban Cameroonian women and men (Table 3). The same trends of increase in the obesity related abnormalities were found for a 0.10 point increase in WHR.
Table 3.
Changes in obesity related abnormalities (beta coefficients, univariate analysis) for a 0.10 increase in waist to hip ratio, by place of residence and gender:
| Rural Cameroon |
Urban Cameroon |
France |
P for difference of slopes |
|
|---|---|---|---|---|
| Women |
||||
| Systolic blood pressure (mmHg) | 0.40 | 0.48***C | 0.56*** | 0.001 |
| Diastolic blood pressure (mmHg) | −0.43 | 0.34***C | 0.29*** | 0.001 |
| Mean arterial pressure (mmHg) | −0.15 | 0.39***C | 0.38*** | 0.001 |
| HOMA-IR | 0.06 | 0.19 | 0.47***Y | 0.001 |
| Fasting plasma glucose (mmol/l) | 0.003 | 0.02 | 0.040*** | 0.001 |
| Fasting cholesterol (mmol/l) | −0.04 | 0.007 | 0.28***Z | 0.001 |
| Fasting triglycerides (mmol/l) | 0.03 | 0.16***C | 0.29***Z | 0.001 |
| Men |
||||
| Systolic blood pressure (mmHg) | 0.21 | 0.72***B | 0.55*** | 0.002 |
| Diastolic blood pressure (mmHg) | −0.55 | 0.41***C | 0.36*** | 0.001 |
| Mean arterial pressure (mmHg) | 0.32 | 0.51***C | 0.42*** | 0.001 |
| HOMA-IR | 0.07 | 0.67**C | 0.65*** | 0.001 |
| Fasting plasma glucose (mmol/l) | 0.003 | 0.06**B | 0.04*** | 0.001 |
| Fasting cholesterol (mmol/l) | 0.02 | 0.17 | 0.39***X | 0.001 |
| Fasting triglycerides (mmol/l) | 0.05* | 0.27***C | 0.32*** | 0.001 |
Results are from regression models for each of SBP, DBP, HOMA-IR, logarithm of fasting plasma glucose, total cholesterol and logarithm fasting triglycerides with waist circumference.
For the significance of each slope compared to zero slope in each model,
p<0.05;
p<0.01;
p < 0.001.
For the comparison of slopes between urban and rural Cameroon,
A = p<0.05
B = p<0.01
C = p < 0.001.
For the comparison of slopes between urban Cameroon and France,
X = p<0.05
Y = p<0.01;
Z = p < 0.001.
Discussion
This is the first study addressing the comparison of correlates of WC between people living in Europe and in sub-Saharan Africa. There are three major findings in our study. First, for the same increase in WC, French individuals had higher increase in metabolic abnormalities compared to urban Cameroonians, and urban Cameroonians had higher increase in obesity related abnormalities compared to their rural counterparts. Second, a marked variation in the distribution of adiposity with gender, urbanization and ethnicity was observed after adjusting for age. Finally, WC correlated positively with obesity related abnormalities, regardless of urbanization, gender or ethnic background, indicating that increased abdominal girth is associated with increased likelihood of the presence of metabolic risk factors for Black Africans as well as Europeans.
Assays of plasma glucose, insulin and blood lipids used different methods in Cameroon and France. The values obtained for these metabolic characteristics were within the range of those expected. The different reagents used would have had an impact on plasma glucose, insulin and blood lipids across sites, and did not influence the type of the association between WC and these obesity related abnormalities. The main outcome in our analyses was the variations within populations according to WC. Since the assays were uniform in each population, this is not methodological drawback.
To measure the effect of ethnicity, we hypothesized that the impact of urbanization on obesity related abnormalities was the same in urban Cameroon and France. Urbanization is higher in France than in urban Cameroon, and this difference probably increased the effect of ethnicity when comparing subjects from these two settings. However, as shown between rural and urban Cameroon, urbanization had minor effects on the strength of the relationship between WC and obesity related abnormalities.
WC was larger in men than in women for Europeans, and the opposite was found in rural and urban Cameroonians. This intriguing sex-ethnic variation was also observed by other authors17, 26 in Europeans and South Asians, and the reason for these differences merits further study. Different levels of physical activity, the nature and composition of diet as well as cultural variations in the perception of obesity are possible explanations. Cut-off points of WC recommended for abdominal obesity for Caucasians6, 27 are higher for men than for women, reflecting the larger WC of men compared to women in these populations. Although the same cut-off points are recommended for Sub-Saharan Africans, WC of black African men is the same or lower than that of black African women, giving for native Africans, prevalences of abdominal obesity which do not reflect reality of CVD risk.18–20
As in other ethnic groups,17, 28, 29 WC was positively correlated in Cameroon with almost all the obesity related abnormalities. WC could then be used in Sub-Saharan Africans to identify subjects at higher risk of cardiovascular diseases. The lack of association of WC with plasma glucose in the rural Cameroonians may reflect the time necessary for fat accumulation to saturate adipocytes, before spreading to liver, pancreas and muscle, with consequences on insulin production, sensitivity to insulin and fuel metabolism. In fact, HOMA-IR increased with WC. It is well known that insulin resistance, then increased fasting insulin in response to abnormal visceral fat accumulation are the precursors of impaired glucose tolerance.30 Moreover, it has been demonstrated that high levels of physical activity, frequent in rural Cameroon20 in comparison to urban Cameroon have protective metabolic effects, partly by increasing insulin sensitivity.1, 31 All these mechanisms are known to counterbalance the elevation of fasting blood glucose.
We demonstrated a stronger association of WC with blood pressure in urban Cameroon in comparison to France, despite higher blood pressure levels in the French population. This greater predisposition of Black Africans to increase their blood pressure when WC increases is in accordance with the higher prevalence of hypertension in black Americans compared to white Americans,32–34 secondary to exposure to high energy diet and little physical activity. It is also a prelude to an explosion in the prevalence of hypertension in Cameroon if nothing is done to stop the obesity epidemic. However, it can also be just the reflection of a dose response relationship between WC and blood pressure, as WC was higher in urban Cameroonians compared to the French.
The difference observed between rural and urban Cameroonians, which are genetically similar populations, is due primarily to the environment. The environments of the two populations were different in terms of level of industrialization and its consequences for individual lifestyles. The environmental factors most influencing the relationship between adiposity and obesity related abnormalities are energy expenditure in the form of physical activity level, energy intake and dietary patterns. Not only did food resources differ between rural and urban populations in Cameroon,35 but physical activity patterns differed enormously.20 Energy intake and physical activity are both crucial determinants of body composition and most likely explain the shift in the relation between WC and obesity related abnormalities.
An increase in WC of the French had a larger effect on metabolic risk factors in comparison to Cameroonians. The higher age of the French population could be contributive to this finding. Urban Cameroonian may have had abdominal obesity for a shorter period compared to the French, explaining why despite being more obese they rather had lower metabolic parameters. The variation in risk factor levels between ethnic groups is partially driven by differences between ethnic groups in percent body fat at a given BMI.36 Després et al found that15 compared to black men, white men were characterized by increased visceral adipose tissue deposition, despite the fact that both groups had similar BMI and total body fat. Lovejoy et al. found that middle aged African American women had larger subcutaneous abdominal fat depots, adjusted for total body fatness, but did not differ from white with regard to visceral adipose tissue.37 Other studies have suggested that African American women have less visceral adipose tissue than age- and weight-matched white women.38–40 Urban Cameroonian women and men had larger hip circumferences than their French counterparts. Accumulation of fat in parts of the body other than the visceral compartment can act as a buffer for the total amount of fat that can be stored, therefore reducing the adverse metabolic effects of excess body fat. Authors have found that a larger hip circumference was protective against CVD and diabetes.41–43
Marked differences in the distribution of abdominal obesity exist between genders, places of residence and ethnic groups. The use of the same cut-off points of WC for identification of abdominal obesity in Caucasians and black Africans is associated with large differences in levels of risk factors for CVD and diabetes, according to gender and place of residence. Existing action thresholds for the classification of abdominal obesity should be applied with caution in Black Africans. Improvement in diet and physical activity can slow the onset of CVD and diabetes. However, more precise estimates of risks are required before medical practitioners can determine when to suggest lifestyle changes to black Africans.
Acknowledgments
The 1994 Cameroon study was supported by a grant from the European Union, contract NO TS3* CT92-0142. The insulin assays were undertaken in the Department of Medicine, University of Newcastle upon Tyne thanks to a generous support from Professor George Alberti.
The D.E.S.I.R. study has been supported by INSERM contracts with CNAMTS, Lilly, Novartis Pharma and Sanofi-Aventis; by INSERM (Réseaux en Santé Publique, Interactions entre les determinants de la santé), the Association Diabète Risque Vasculaire, the Fédération Française de Cardiologie, La Fondation de France, ALFEDIAM, ONIVINS, Ardix Medical, Bayer Diagnostics, Becton Dickinson, Cardionics, Merck Santé, Novo Nordisk, Pierre Fabre, Roche, Topcon.
The D.E.S.I.R. Study Group. INSERM U780: B. Balkau, P. Ducimetière, E. Eschwège; INSERM U367: F. Alhenc-Gelas; CHU D’Angers: Y. Gallois, A. Girault; Bichat Hospital: F. Fumeron, M. Marre; Centres d’Examens de Santé: Alençon, Angers, Caen, Chateauroux, Cholet, Le Mans, Tours; Institute de Recherche Médecine Générale: J. Cogneau; General practitioners of the region; Institute inter-Regional pour la Santé: C. Born, E. Caces, M. Cailleau, J.G. Moreau, F. Rakotozafy, J. Tichet, S. Vol.
Abbreviations
- CVD
Cardiovascular diseases
- D.E.S.I.R
Données Epidémiologiques sur le Syndrome d’Insulino-Résistance
- HOMA-IR
Homeostasis assessment model for insulin resistance
- WC
waist circumference
- DBP and SBP
Diastolic and systolic blood pressures
References
- 1.Hu FB, Willett WC, Li T, Stampfer MJ, Colditz GA, Manson JE. Adiposity as compared with physical activity in predicting mortality among women. The New England journal of medicine. 2004;351:2694–2703. doi: 10.1056/NEJMoa042135. [DOI] [PubMed] [Google Scholar]
- 2.Solomon CG, Manson JE. Obesity and mortality: a review of the epidemiologic data. The American journal of clinical nutrition. 1997;66:1044S–1050S. doi: 10.1093/ajcn/66.4.1044S. [DOI] [PubMed] [Google Scholar]
- 3.Wannamethee SG, Shaper AG, Walker M. Weight change, weight fluctuation, and mortality. Archives of internal medicine. 2002;162:2575–2580. doi: 10.1001/archinte.162.22.2575. [DOI] [PubMed] [Google Scholar]
- 4.Wannamethee SG, Shaper AG, Walker M. Overweight and obesity and weight change in middle aged men: impact on cardiovascular disease and diabetes. Journal of epidemiology and community health. 2005;59:134–139. doi: 10.1136/jech.2003.015651. [DOI] [PMC free article] [PubMed] [Google Scholar]
- 5.World Health Organisation. Report of WHO Consultation on Obesity. Geneva: WHO/NUT/NCD/98.1; Jun 3-5 , 1997. Obesity: Preventing and Managing the Global Epidemic. [PubMed] [Google Scholar]
- 6.Executive Summary of The Third Report of The National Cholesterol Education Program (NCEP) Expert Panel on Detection, Evaluation And Treatment of High Blood Cholesterol In Adults (Adult Treatment Panel III) Jama. 2001;285:2486–2497. doi: 10.1001/jama.285.19.2486. [DOI] [PubMed] [Google Scholar]
- 7.Adams-Campbell LL, Nwankwo M, Ukoli F, Omene J, Haile GT, Kuller LH. Body fat distribution patterns and blood pressure in black and white women. Journal of the National Medical Association. 1990;82:573–576. [PMC free article] [PubMed] [Google Scholar]
- 8.Kissebah AH, Vydelingum N, Murray R, Evans DJ, Hartz AJ, Kalkhoff RK, et al. Relation of body fat distribution to metabolic complications of obesity. The Journal of clinical endocrinology and metabolism. 1982;54:254–260. doi: 10.1210/jcem-54-2-254. [DOI] [PubMed] [Google Scholar]
- 9.Pouliot MC, Despres JP, Lemieux S, Moorjani S, Bouchard C, Tremblay A, et al. Waist circumference and abdominal sagittal diameter: best simple anthropometric indexes of abdominal visceral adipose tissue accumulation and related cardiovascular risk in men and women. The American journal of cardiology. 1994;73:460–468. doi: 10.1016/0002-9149(94)90676-9. [DOI] [PubMed] [Google Scholar]
- 10.Seidell JC, Oosterlee A, Deurenberg P, Hautvast JG, Ruijs JH. Abdominal fat depots measured with computed tomography: effects of degree of obesity, sex, and age. European journal of clinical nutrition. 1988;42:805–815. [PubMed] [Google Scholar]
- 11.Wei M, Gaskill SP, Haffner SM, Stern MP. Waist circumference as the best predictor of noninsulin dependent diabetes mellitus (NIDDM) compared to body mass index, waist/hip ratio and other anthropometric measurements in Mexican Americans--a 7-year prospective study. Obesity research. 1997;5:16–23. doi: 10.1002/j.1550-8528.1997.tb00278.x. [DOI] [PubMed] [Google Scholar]
- 12.Bouchard C, Bray GA, Hubbard VS. Basic and clinical aspects of regional fat distribution. The American journal of clinical nutrition. 1990;52:946–950. doi: 10.1093/ajcn/52.5.946. [DOI] [PubMed] [Google Scholar]
- 13.Molarius A, Seidell JC. Selection of anthropometric indicators for classification of abdominal fatness--a critical review. Int J Obes Relat Metab Disord. 1998;22:719–727. doi: 10.1038/sj.ijo.0800660. [DOI] [PubMed] [Google Scholar]
- 14.Molarius A, Seidell JC, Sans S, Tuomilehto J, Kuulasmaa K. Varying sensitivity of waist action levels to identify subjects with overweight or obesity in 19 populations of the WHO MONICA Project. Journal of clinical epidemiology. 1999;52:1213–1224. doi: 10.1016/s0895-4356(99)00114-6. [DOI] [PubMed] [Google Scholar]
- 15.Despres JP, Couillard C, Gagnon J, Bergeron J, Leon AS, Rao DC, et al. Race, visceral adipose tissue, plasma lipids, and lipoprotein lipase activity in men and women: the Health, Risk Factors, Exercise Training, and Genetics (HERITAGE) family study. Arteriosclerosis, thrombosis, and vascular biology. 2000;20:1932–1938. doi: 10.1161/01.atv.20.8.1932. [DOI] [PubMed] [Google Scholar]
- 16.Lemieux S, Prud’homme D, Bouchard C, Tremblay A, Despres JP. Sex differences in the relation of visceral adipose tissue accumulation to total body fatness. The American journal of clinical nutrition. 1993;58:463–467. doi: 10.1093/ajcn/58.4.463. [DOI] [PubMed] [Google Scholar]
- 17.Razak F, Anand S, Vuksan V, Davis B, Jacobs R, Teo KK, et al. Ethnic differences in the relationships between obesity and glucose-metabolic abnormalities: a cross-sectional population-based study. International journal of obesity. 2005;29:656–667. doi: 10.1038/sj.ijo.0802937. [DOI] [PubMed] [Google Scholar]
- 18.Fezeu L, Minkoulou E, Balkau B, Kengne AP, Awah P, Unwin N, et al. Association between socioeconomic status and adiposity in urban Cameroon. Int J Epidemiol. 2006;35:105–111. doi: 10.1093/ije/dyi214. [DOI] [PubMed] [Google Scholar]
- 19.Kamadjeu RM, Edwards R, Atanga JS, Kiawi EC, Unwin N, Mbanya JC. Anthropometry measures and prevalence of obesity in the urban adult population of Cameroon: an update from the Cameroon Burden of Diabetes Baseline Survey. BMC public health. 2006;6:228. doi: 10.1186/1471-2458-6-228. [DOI] [PMC free article] [PubMed] [Google Scholar]
- 20.Sobngwi E, Mbanya JC, Unwin NC, Kengne AP, Fezeu L, Minkoulou EM, et al. Physical activity and its relationship with obesity, hypertension and diabetes in urban and rural Cameroon. Int J Obes Relat Metab Disord. 2002;26:1009–1016. doi: 10.1038/sj.ijo.0802008. [DOI] [PubMed] [Google Scholar]
- 21.Fezeu L, Balkau B, Kengne AP, Sobngwi E, Mbanya JC. Atherosclerosis. 2006. Metabolic syndrome in a sub-Saharan African setting: Central obesity may be the key determinant. [DOI] [PMC free article] [PubMed] [Google Scholar]
- 22.Mbanya JC, Minkoulou EM, Salah JN, Balkau B. The prevalence of hypertension in rural and urban Cameroon. Int J Epidemiol. 1998;27:181–185. doi: 10.1093/ije/27.2.181. [DOI] [PubMed] [Google Scholar]
- 23.Mbanya JC, Ngogang J, Salah JN, Minkoulou E, Balkau B. Prevalence of NIDDM and impaired glucose tolerance in a rural and an urban population in Cameroon. Diabetologia. 1997;40:824–829. doi: 10.1007/s001250050755. [DOI] [PubMed] [Google Scholar]
- 24.Balkau B, Eschwege E, Tichet J, Marre M. Proposed criteria for the diagnosis of diabetes: evidence from a French epidemiological study (D.E.S.I.R.) Diabetes Metab. 1997;23:428–434. [PubMed] [Google Scholar]
- 25.Balkau B, Vernay M, Mhamdi L, Novak M, Arondel D, Vol S, et al. The incidence and persistence of the NCEP (National Cholesterol Education Program) metabolic syndrome. The French D.E.S.I.R. study. Diabetes Metab. 2003;29:526–532. doi: 10.1016/s1262-3636(07)70067-8. [DOI] [PubMed] [Google Scholar]
- 26.McKeigue PM, Shah B, Marmot MG. Relation of central obesity and insulin resistance with high diabetes prevalence and cardiovascular risk in South Asians. Lancet. 1991;337:382–386. doi: 10.1016/0140-6736(91)91164-p. [DOI] [PubMed] [Google Scholar]
- 27.Alberti KG, Zimmet P, Shaw J. The metabolic syndrome--a new worldwide definition. Lancet. 2005;366:1059–1062. doi: 10.1016/S0140-6736(05)67402-8. [DOI] [PubMed] [Google Scholar]
- 28.Janssen I, Katzmarzyk PT, Ross R. Body mass index, waist circumference, and health risk: evidence in support of current National Institutes of Health guidelines. Archives of internal medicine. 2002;162:2074–2079. doi: 10.1001/archinte.162.18.2074. [DOI] [PubMed] [Google Scholar]
- 29.Lear SA, Toma M, Birmingham CL, Frohlich JJ. Modification of the relationship between simple anthropometric indices and risk factors by ethnic background. Metabolism: clinical and experimental. 2003;52:1295–1301. doi: 10.1016/s0026-0495(03)00196-3. [DOI] [PubMed] [Google Scholar]
- 30.Saad MF, Knowler WC, Pettitt DJ, Nelson RG, Charles MA, Bennett PH. A two-step model for development of non-insulin-dependent diabetes. The American journal of medicine. 1991;90:229–235. [PubMed] [Google Scholar]
- 31.Wannamethee SG, Shaper AG. Physical activity and cardiovascular disease. Seminars in vascular medicine. 2002;2:257–266. doi: 10.1055/s-2002-35400. [DOI] [PubMed] [Google Scholar]
- 32.Harris MM, Stevens J, Thomas N, Schreiner P, Folsom AR. Associations of fat distribution and obesity with hypertension in a bi-ethnic population: the ARIC study. Atherosclerosis Risk in Communities Study. Obesity research. 2000;8:516–524. doi: 10.1038/oby.2000.64. [DOI] [PubMed] [Google Scholar]
- 33.Kramer H, Han C, Post W, Goff D, Diez-Roux A, Cooper R, et al. Racial/ethnic differences in hypertension and hypertension treatment and control in the multi-ethnic study of atherosclerosis (MESA) Am J Hypertens. 2004;17:963–970. doi: 10.1016/j.amjhyper.2004.06.001. [DOI] [PubMed] [Google Scholar]
- 34.Lloyd-Jones DM, Sutton-Tyrrell K, Patel AS, Matthews KA, Pasternak RC, Everson-Rose SA, et al. Ethnic variation in hypertension among premenopausal and perimenopausal women: Study of Women’s Health Across the Nation. Hypertension. 2005;46:689–695. doi: 10.1161/01.HYP.0000182659.03194.db. [DOI] [PubMed] [Google Scholar]
- 35.Mennen LI, Mbanya JC, Cade J, Balkau B, Sharma S, Chungong S, et al. The habitual diet in rural and urban Cameroon. European journal of clinical nutrition. 2000;54:150–154. doi: 10.1038/sj.ejcn.1600909. [DOI] [PubMed] [Google Scholar]
- 36.Deurenberg P, Yap M, van Staveren WA. Body mass index and percent body fat: a meta analysis among different ethnic groups. Int J Obes Relat Metab Disord. 1998;22:1164–1171. doi: 10.1038/sj.ijo.0800741. [DOI] [PubMed] [Google Scholar]
- 37.Lovejoy JC, de la Bretonne JA, Klemperer M, Tulley R. Abdominal fat distribution and metabolic risk factors: effects of race. Metabolism: clinical and experimental. 1996;45:1119–1124. doi: 10.1016/s0026-0495(96)90011-6. [DOI] [PubMed] [Google Scholar]
- 38.Albu JB, Murphy L, Frager DH, Johnson JA, Pi-Sunyer FX. Visceral fat and race-dependent health risks in obese nondiabetic premenopausal women. Diabetes. 1997;46:456–462. doi: 10.2337/diab.46.3.456. [DOI] [PubMed] [Google Scholar]
- 39.Conway JM. Ethnicity and energy stores. The American journal of clinical nutrition. 1995;62:1067S–1071S. doi: 10.1093/ajcn/62.5.1067S. [DOI] [PubMed] [Google Scholar]
- 40.Conway JM, Chanetsa FF, Wang P. Intraabdominal adipose tissue and anthropometric surrogates in African American women with upper- and lower-body obesity. The American journal of clinical nutrition. 1997;66:1345–1351. doi: 10.1093/ajcn/66.6.1345. [DOI] [PubMed] [Google Scholar]
- 41.Heitmann BL, Frederiksen P, Lissner L. Hip circumference and cardiovascular morbidity and mortality in men and women. Obesity research. 2004;12:482–487. doi: 10.1038/oby.2004.54. [DOI] [PubMed] [Google Scholar]
- 42.Lissner L, Bjorkelund C, Heitmann BL, Seidell JC, Bengtsson C. Larger hip circumference independently predicts health and longevity in a Swedish female cohort. Obesity research. 2001;9:644–646. doi: 10.1038/oby.2001.85. [DOI] [PubMed] [Google Scholar]
- 43.Snijder MB, Zimmet PZ, Visser M, Dekker JM, Seidell JC, Shaw JE. Independent association of hip circumference with metabolic profile in different ethnic groups. Obesity research. 2004;12:1370–1374. doi: 10.1038/oby.2004.173. [DOI] [PubMed] [Google Scholar]