

Abstract
BACKGROUND
Age and race categories or renin profiling have been recommended to predict blood pressure responses to monotherapy with a β-blocker or thiazide diuretic. Whether these or other characteristics predict blood pressure responses when the drugs are administered as add-on therapy is uncertain.
METHODS
We evaluated predictors of blood pressure response in 363 men and women ≤65 years of age with primary hypertension (152 blacks, 211 whites), 86 of whom (24%) were untreated and 277 of whom (76%) were withdrawn from previous antihypertensive drugs before randomization to either atenolol followed by addition of hydrochlorothiazide (N = 180) or hydrochlorothiazide followed by addition of atenolol (N = 183). Responses were determined by home blood pressure averages before and after each drug administration. Race, age, plasma renin activity, and other characteristics including pretreatment blood pressure levels were incorporated into linear regression models to quantify their contributions to prediction of blood pressure responses.
RESULTS
Plasma renin activity and pretreatment blood pressure level consistently contributed to prediction of systolic and diastolic responses to each drug administered as mono- and as add-on therapy. Higher plasma renin activity was consistently associated with greater blood pressure responses to atenolol and lesser responses to hydrochlorothiazide. The predictive effects of plasma renin activity were statistically independent of race, age, and other characteristics.
CONCLUSIONS
Plasma renin activity and pretreatment blood pressure level predict blood pressure responses to atenolol and hydrochlorothiazide administered as mono- and as add-on therapy in men and women ≤65 years of age.
Keywords: antihypertensive drug therapy, blood pressure, hypertension, plasma renin activity, thiazide diuretic, β-blocker
Since thiazide diuretics were introduced in the late 1950s for treatment of hypertension, interpatient variation has been documented for blood pressure responses to agents from all classes of antihypertensive drugs.1,2 For any single agent given as monotherapy, ~50% of patients achieve blood pressure levels <140/90 mm Hg,3 and sequential administration of agents from different classes achieves control in ~75% of patients.4,5 Interpatient variation in blood pressure response to a given drug and within-patient variation in response to drugs from different classes reflect heterogeneity in the mechanisms contributing to hypertension.6
In 1972, Laragh and colleagues first advocated the measurement of plasma renin activity in order to match the known target and actions of a prescribed drug with the particular “vasoconstriction-volume” characteristics of the individual’s hypertension.7,8 However, when a renin-based method of predicting responses to six different monotherapies was tested in a large sample of men with diastolic hypertension, it performed no better than an alternative method based on race and age, two more-easily determined characteristics that are correlated with plasma renin activity.9 Although measurement of plasma renin activity has also been advocated to guide selection of add-on therapy in patients not controlled on initial monotherapy,10 evidence to support this extension of renin profiling is limited.11
The objective of the present study was to identify patient characteristics that predict blood pressure responses to a commonly prescribed β-blocker (atenolol) and thiazide diuretic (hydrochlorothiazide) administered initially as monotherapy and subsequently as add-on therapy (to the other drug). In addition to evaluating the predictive effects of race, age, and plasma renin activity, we sought to identify other predictive characteristics easily determined by interview or physical examination. We analyzed data from the first 363 participants in the Pharmacogenomic Evaluation of Antihypertensive Responses (PEAR) study, which aims to identify genetic predictors of blood pressure responses to atenolol and hydrochlorothiazide. 12 An additional motivation for this analysis was to benchmark the percentage of interindividual variation in blood pressure responses that can be explained before measurements of genetic variation are considered.
METHODS
The objectives and design of the PEAR study (http://clinicaltrials.gov/ct2/show/NCT00246519) have been previously published.12 Enrollment of participants began in 2005 at the University of Florida, Gainesville, FL; Emory University, Atlanta, GA; and the Mayo Clinic, Rochester, MN and will be completed in 2010. The study protocol was approved by the Institutional Review Board at each site, and all participants gave informed consent. In Gainesville, FL, participants were recruited through outpatient medical clinics affiliated with the University of Florida, Department of Community Health and Family Medicine via advertisement in local media; in Atlanta, GA, participants were recruited through the outpatient medical clinic at the Hypertension and Renal Diseases Research Center of Emory University, advertisements in public media, and mailing lists of registered voters;13 and in Rochester, MN, participants were recruited through diagnostic indexes maintained by the Mayo Clinic of residents of Olmsted County with a medical record diagnosis of primary hypertension.14
Participants
Males or females with stage 1–2 primary hypertension, of any race or ethnicity, and between the ages of 17 and 65, were eligible. At an initial consent and screening visit, trained study personnel administered standardized questionnaires to determine sex, age, and race; physicians’ diagnosis and treatment of hypertension and complicating or comorbid diagnoses; current prescription and nonprescription medications, hormone replacement therapy in women, family history of hypertension, cigarette smoking, ethanol intake, and leisure physical activity. A limited physical examination included measurements of height, weight, waist, hip, and upper arm circumferences; and office blood pressure. Candidates were excluded if hypertension was secondary to a known cause (e.g., renal, endocrine, or vascular diseases) or concomitant medication (e.g., glucocorticoids, nonsteroidal anti-inflammatories, oral contraceptives); or was complicated by other comorbidities requiring prescription medications that lower blood pressure or contraindicate the use of diuretics or β-blockers. Candidates were also excluded if they had diabetes mellitus; were pregnant or lactating; or had any of the following conditions at the consent and screening visit: systolic blood pressure ≥170 mm Hg or diastolic blood pressure ≥100 mm Hg despite antihypertensive drug therapy (or in the absence of antihypertensive drug therapy, systolic blood pressure ≥180 mm Hg or diastolic BP ≥110 mm Hg); pulse rate <55 beats/min; elevated serum creatinine (>1.5 mg/dl in males or >1.4 mg/dl in females); or elevated fasting serum glucose (>126 mg/dl) or transaminases (>2.5× upper normal limit).
Randomization and interventions
At enrollment, participants were provided an automated oscillometric sphygmomanometer device (Microlife 3AC1-PC; Microlife, Minneapolis, MN) that was set to measure blood pressure and pulse rate in triplicate with each activation and record average systolic and diastolic blood pressures, pulse rate, date, and time of each set of measurements. Participants were instructed to take readings daily in the seated position, twice in the morning upon arising from bed and twice in the evening just before retiring. At subsequent study visits (at the end of the washout prior to randomization, at the end of monotherapy prior to addition of a second drug, and at the end of add-on therapy), two additional sets of three readings were obtained seated (>5 min) in the office using the participant’s home monitor, and all data stored in the device were downloaded to a study computer. Prescription antihypertensive medications reported by 277 of the 363 participants at the consent and screening visit were discontinued, and a drug-free washout period averaging 31 days (range: 13–125 days) ensued prior to randomization to the first study drug. To qualify for randomization, the average home diastolic blood pressures in the previous week had to be ≥85 mm Hg and the average office diastolic blood pressures ≥90 mm Hg. If so, participants were then randomized to receive either (i) atenolol 50 mg (titrated to 100 mg daily if blood pressure remained >120/70 mm Hg) followed by hydrochlorothiazide 12.5 mg (titrated to 25 mg daily in a similar fashion) ((N = 180), or 2) hydrochlorothiazide 12.5 mg daily (titrated to 25 mg daily if blood pressure remained >120/70 mm Hg) followed by atenolol 50 mg daily (titrated to 100 mg daily in a similar fashion) (N = 183). Numbers of pills dispensed from blister packs provided to each participant were available for 361 participants at the end of monotherapy and 359 (99%) at the end of add-on therapy. At the end of monotherapy, 299 of the 361 (83%) were 100% compliant; and of the 62 that were not, 57 (92%) took ≥70% of pills dispensed and only 4 (6%) took <50%. At the end of add-on therapy, 309 of 359 (86%) were 100% compliant; and of the 50 that were not, 48 (96%) took ≥70% of pills dispensed and only 1 took <50%.
At the end of the washout, monotherapy, and add-on therapy periods, fasting blood samples were drawn in the seated position after ambulation for measurement of plasma renin activity; serum potassium and creatinine; and spot urine samples were collected for measurement of sodium, potassium, and creatinine. Throughout the protocol, potassium-sparing diuretics were not prescribed but potassium supplements were permitted and mandated for serum potassium values <3.2 mmol/l. The few participants who received potassium supplementation (n = 5) were not excluded from the analyses.
Laboratory measurement
Serum, plasma, and urine samples were assayed in duplicate or triplicate, and participants’ average values were used in the analyses. Serum and urine analytes were measured on an Hitachi 911 Chemistry Analyzer (Roche Diagnostics, Indianapolis, IN). Plasma renin activity was measured by radioimmunoassay of angiotensin I according to the method of Sealey15 using reagents purchased from DiaSorin (Stillwater, MN). The incubation period for angiotensin I generation was 3 h.
Statistical analysis
Analyses were performed with Statistical Analysis System software, version 9.1 (SAS, Raleigh-Durham, NC) and R statistical computing and graphics software, version 2.7.1 (R Development Core Team, http://www.r-project.org). Statistical significance was defined a priori by P < 0.05. Data were summarized by calculating means and standard deviations or medians, and interquartile ranges for quantitative variables and percentages for categorical variables. Differences between groups were assessed by two-sample t-tests for normally distributed quantitative traits, by Wilcoxon rank-sum tests for non-normally distributed quantitative characteristics, or by χ2 tests for categorical traits. Blood pressure response to each drug administration was defined by subtracting the pretreatment home average (for the week prior to drug administration) from the post-treatment average (for the final week of drug administration), such that negative differences indicate declines in blood pressure in response to drug treatment.
For each measure of response, multiple-variable linear regression analyses were performed to identify a combination of patient characteristics that made additive, statistically independent contributions to the prediction of response. The percentage of the interindividual variation in each measure of response explained by the predictor variables was estimated by R2 × 100. The pretreatment (baseline) blood pressure level was forced into all models because the response defined by the difference between post- and pretreatment levels is correlated with the baseline,16 and we sought to identify predictors of response that are statistically independent of the pretreatment blood pressure level. Next, we forced into the models patient characteristics previously implicated as predictors of response to β-blockers and diuretics, i.e., race, age, and plasma renin activity. Finally, we considered other characteristics measured at study enrollment, after washout of previously prescribed antihypertensive drugs, and after each study, drug was administered as monotherapy. The large number of patient characteristics and the potential for collinearity among them dictated a supervised model fitting strategy: one-at-a-time, each characteristic was forced into the separate models fit in all subjects (i.e., for (systolic, diastolic) responses to atenolol and hydrochlorothiazide administered as (monotherapy, add-on therapy)) and retained in all models if it was statistically significant in at least one model.
To globally assess whether the predictors of drug response differed between mono- and add-on therapy, we first fit models for the monotherapy responses to each drug. We then used these models to generate predicted responses for all participants, regardless of the order in which they received the drug. Finally, we fit a model with the actual response to the drug as the dependent variable and the predicted response as the independent variable. This latter model included terms for whether the drug was administered as monotherapy (first) or add-on therapy (second) and the interaction of this ordering with the predicted response. We reasoned that if the predicted response values were highly correlated with the observed responses, regardless of whether the drug was administered first or added second, the interaction term in the final model would be nonsignificant and the estimate itself near zero. Alternatively, if the monotherapy response estimates do a poor job of predicting responses to add-on therapy, the interaction term would be significant suggesting that the variables useful in predicting response to the drug depend upon whether it is administered as mono- or add-on therapy. When this global interaction term was statistically significant, we conducted separate interaction analyses for each predictor to identify which one(s) may have different associations with response to mono- vs. add-on therapy.
RESULTS
Sample description
The groups did not differ significantly in the characteristics measured at study enrollment (Table 1). After washout of pre-enrollment antihypertensive medications, the mean systolic/diastolic blood pressures were 3/1 mm Hg higher in the group randomized to hydrochlorothiazide monotherapy (Table 2).
Table 1.
Characteristics of 363 participants with primary hypertension measured at enrollment
| Variable | Pooled (N = 363) | Randomized to atenolol (N = 180) | Randomized to HCTZ (N = 183) | P |
|---|---|---|---|---|
| Black race, n (%) | 152 (42) | 75 (42) | 77 (42) | 0.94 |
| Males, n (%) | 157 (43) | 72 (40) | 85 (46) | 0.22 |
| Age, years | 50 ± 8.7 | 50 ± 8.8 | 50 ± 8.6 | 0.81 |
| Height, cm | 169 ± 9.6 | 170 ± 9.7 | 169 ± 9.6 | 0.50 |
| BMI, kg/m2 | 31 ± 5.8 | 31 ± 6.4 | 31 ± 5.0 | 0.63 |
| Waist, cm | 98 ± 13 | 98 ± 13 | 98 ± 13 | 0.78 |
| HT duration, years; median (IQR) | 5 (2, 10) | 6 (2, 10) | 5 (1, 10) | 0.18 |
| Current HT Rx, n (%) | 277 (85) | 141 (87) | 136 (83) | 0.36 |
| Current smoker, n (%) | 42 (12) | 16 (8.9) | 26 (14) | 0.11 |
| Ethanol ≥1 serving/week, n (%) | 136 (37) | 72 (40) | 64 (35) | 0.32 |
| Systolic BP, mm Hg | 137 ± 15 | 136 ± 16 | 137 ± 15 | 0.45 |
| Diastolic BP, mm Hg | 87 ± 9.7 | 87 ± 9.4 | 87 ± 9.9 | 0.75 |
Data are presented as mean ± s.d. unless otherwise specified. P value is for test of equality of means, medians, or percentages between groups.
BMI, body mass index (weight (kg)/height squared (m2)); BP, blood pressure; HCTZ, hydrochlorothiazide; HT, hypertension; IQR, interquartile range.
Table 2.
Blood pressure and plasma renin activity after washout, after monotherapy, and after add-on therapy
| Variable | Atenolol (1st) + HCTZ (2nd) (N = 180) | HCTZ (1st) + atenolol (2nd) (N = 183) | P |
|---|---|---|---|
| Systolic BP | |||
| After washout | 145 ± 10 | 148 ± 11 | 0.02 |
| After 1st drug | 138 ± 13 | 138 ± 12 | 0.72 |
| Δ 1st drug | −6.8 ± 10 | −10 ± 9.1 | 0.002 |
| After 2nd drug | 129 ± 11 | 128 ± 11 | 0.42 |
| Δ 2nd drug | −9.2 ± 10 | −9.4 ± 7.8 | 0.82 |
| Diastolic BP | |||
| After washout | 93 ± 5.9 | 94 ± 6.4 | 0.01 |
| After 1st drug | 86 ± 8.1 | 89 ± 7.4 | <0.001 |
| Δ 1st drug | −7.0 ± 6.5 | −5.7 ± 6.1 | 0.055 |
| After 2nd drug | 81 ± 8.0 | 80 ± 6.9 | 0.12 |
| Δ 2nd drug | −4.6 ± 6.5 | −8.7 ± 5.8 | <0.001 |
| PRA | |||
| After washout | 0.74 (0.40, 1.2) | 0.63 (0.39, 1.2) | 0.57 |
| After 1st drug | 0.30 (0.20, 0.45) | 1.6 (0.75, 3.0) | <0.001 |
| Δ 1st drug | −0.36 (−0.74, −0.10) | 0.74 (0.16, 1.8) | <0.001 |
| After 2nd drug | 0.67 (0.32, 1.8) | 0.86 (0.35, 1.6) | 0.31 |
| Δ 2nd drug | 0.33 (0.08, 1.2) | −0.52 (−1.4, −0.12) | <0.001 |
Data are presented as mean, mm Hg, ± s.d. for BP and median, ng/ml/h (25th, 75th percentiles) for PRA. 1st drug shows the effect of monotherapy; 2nd drug shows the effect of add-on therapy. P is for test of equality of means or medians between groups.
BP, blood pressure; HCTZ, hydrochlorothiazide; PRA, plasma renin activity.
Responses to atenolol and hydrochlorothiazide
In response to each drug administration, mean blood pressure levels declined in both groups and mean plasma renin activity changed as expected (Table 2). Median plasma renin activity and variation (measured by the interquartile range) decreased with atenolol administration and increased with hydrochlorothiazide administration, both when the drugs were administered as monotherapy and as add-on therapy (Table 2). After adjustment for differences in blood pressure levels prior to each drug administration, systolic and diastolic blood pressure responses were greater to add-on therapy than to monotherapy with each drug (Figures 1 and 2).
Figure 1.
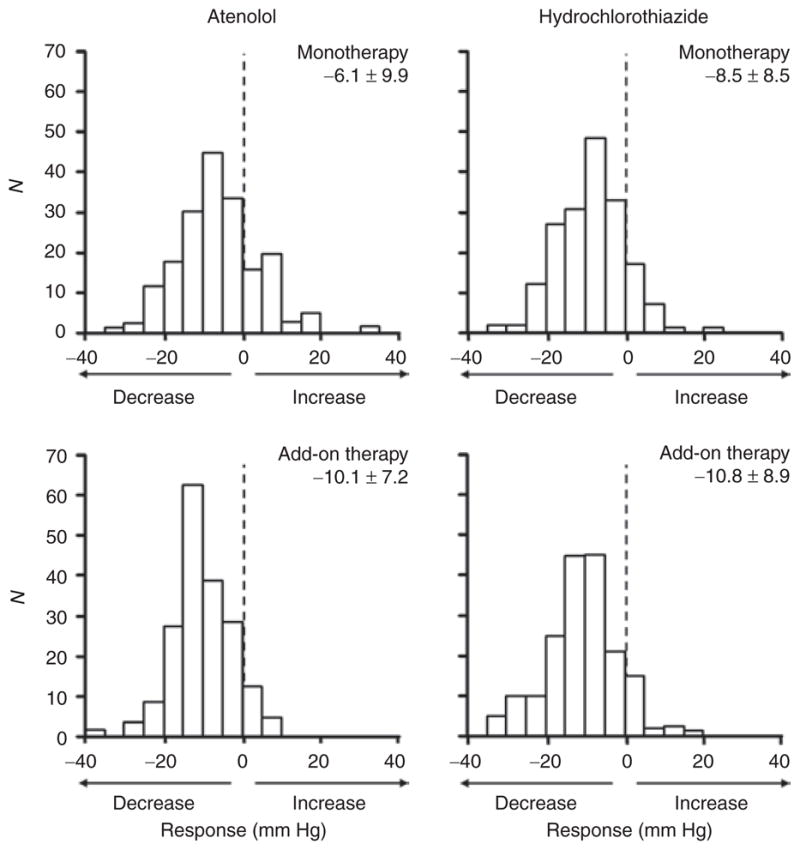
Frequency distribution histograms of systolic blood pressure responses to atenolol and hydrochlorothiazide administered as monotherapy and as add-on therapy (to the other drug), adjusted for differences in pretreatment blood pressure levels. Mean ± standard deviation of adjusted blood pressure response is given above each histogram. Negative x-axis values indicate decline in blood pressure in response to drug treatment. Y-axis values are numbers of participants (counts).
Figure 2.
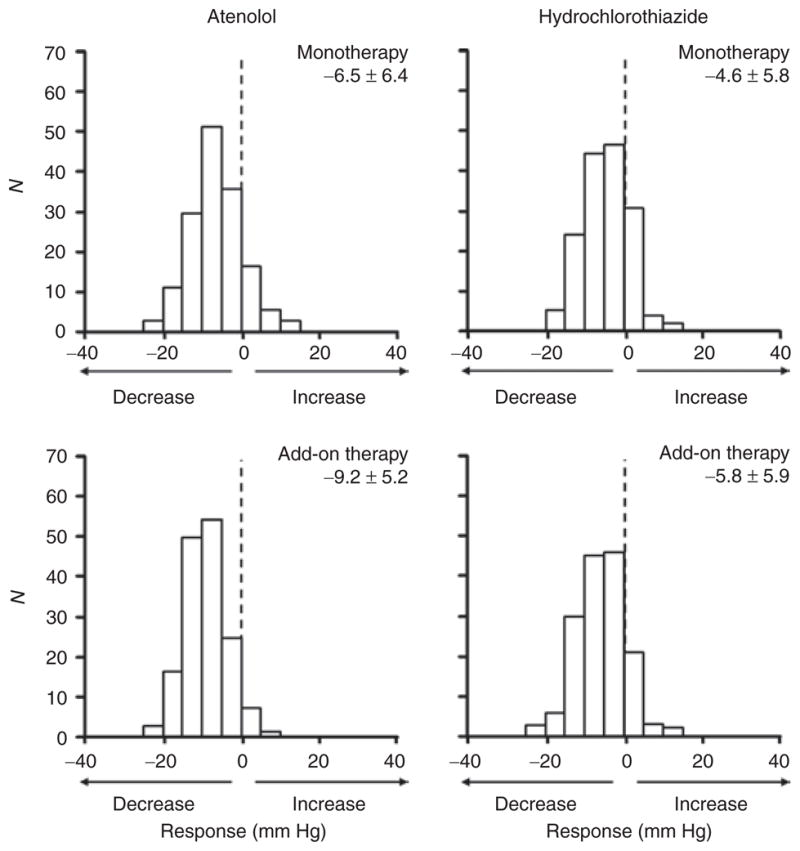
Frequency distribution histograms of diastolic blood pressure responses to atenolol and hydrochlorothiazide administered as monotherapy and as add-on therapy (to the other drug), adjusted for differences in pretreatment blood pressure levels. Mean ± standard deviation of adjusted blood pressure response is given above each histogram. Negative x-axis values indicate decline in blood pressure in response to drug treatment. Y-axis values are numbers of participants (counts).
Prediction of blood pressure responses
Among individual characteristics included in the multiple-variable regression models, pretreatment blood pressure level and log plasma renin activity consistently made statistically significant contributions to prediction of both systolic and diastolic blood pressure responses to each drug as mono- and as add-on therapy (Tables 3 and 4). The predictive effects of log plasma renin activity were directionally opposite for atenolol and hydrochlorothiazide responses, with higher renin predicting greater blood pressure responses to atenolol and lesser responses to hydrochlorothiazide (Figure 3). In contrast, race only made statistically significant contributions to prediction of systolic and diastolic responses to atenolol monotherapy and diastolic response to atenolol add-on therapy (less response in blacks than whites). Similarly, age only made statistically significant contribution to prediction of diastolic response to atenolol monotherapy (less response with increasing age). None of the other characteristics included in the regression models consistently contributed to prediction of blood pressure responses (Tables 3 and 4).
Table 3.
Systolic blood pressure response models
| Predictors measured | Model for atenolol monotherapy | Model for HCTZ monotherapy | ||
|---|---|---|---|---|
| β ± s.e. | P | β ± s.e. | P | |
| Before 1st drug | ||||
| Intercept | 26.28 ± 18.5 | 0.16 | 5.82 ± 17.50 | 0.74 |
| Race (black) | 7.45 ± 1.53 | <0.0001 | −2.12 ± 1.47** | 0.15 |
| Sex (male) | 4.21 ± 1.97 | 0.03 | 0.449 ± 1.749 | 0.80 |
| Age, years | 0.145 ± 0.075 | 0.06 | −0.0565 ± 0.0801 | 0.48 |
| Log HT duration | 2.18 ± 0.66 | 0.001 | 1.48 ± 0.64 | 0.02 |
| Cigarette smoker | −0.896 ± 2.422 | 0.71 | −2.03 ± 1.85 | 0.27 |
| Ethanol drinker | 2.11 ± 1.42 | 0.14 | 0.736 ± 1.380 | 0.59 |
| Height, cm | −0.0354 ± 0.0954 | 0.71 | 0.159 ± 0.091 | 0.08 |
| Waist, cm | 0.0138 ± 0.0526 | 0.79 | −0.0152 ± 0.0512 | 0.77 |
| Home BP, mm Hg | −0.321 ± 0.063 | <0.0001 | −0.267 ± 0.058 | <0.0001 |
| Log PRA | −4.05 ± 0.84 | <0.0001 | 1.87 ± 0.90** | 0.04 |
| Model for atenolol add-on therapy | Model for HCTZ add-on therapy | |||
| β ± s.e. | P | β ± s.e. | P | |
| Before 2nd drug | ||||
| Intercept | 38.8 ± 13.9 | 0.006 | 25.9 ± 17.6 | 0.14 |
| Race (black) | 1.85 ± 1.12† | 0.10 | −2.57 ± 1.53¶ | 0.10 |
| Sex (male) | 3.73 ± 1.45 | 0.01 | 1.19 ± 2.00 | 0.55 |
| Age, years | 0.0607 ± 0.0633 | 0.34 | −0.129 ± 0.076|| | 0.09 |
| Log HT duration | −1.350 ± 0.528§ | 0.01 | 0.0495 ± 0.6685 | 0.94 |
| Cigarette smoker | 5.06 ± 1.49* | 0.001 | 0.293 ± 2.405 | 0.90 |
| Ethanol drinker | 0.593 ± 1.123 | 0.60 | 3.62 ± 1.43 | 0.01 |
| Height, cm | −0.0706 ± 0.0748 | 0.35 | 0.0602 ± 0.0952 | 0.53 |
| Waist, cm | 0.0131 ± 0.0417 | 0.75 | 0.0938 ± 0.0525 | 0.08 |
| Home BP, mm Hg | −0.299 ± 0.045 | <0.0001 | −0.338 ± 0.060 | <0.0001 |
| Log PRA | −1.95 ± 0.59* | 0.001 | 2.01 ± 0.97# | 0.04 |
BP, blood pressure; HCTZ, hydrochlorothiazide; HT, hypertension; PRA, plasma renin activity.
Difference in regression coefficients between mono- and add-on therapy:
P < 0.05;
P < 0.01;
P < 0.0001.
Difference in regression coefficients between atenolol and hydrochlorothiazide therapy:
P < 0.05;
P < 0.01;
P < 0.001;
P < 0.0001.
Table 4.
Diastolic blood pressure response models
| Predictors measured | Model for atenolol monotherapy | Model for HCTZ monotherapy | ||
|---|---|---|---|---|
| β ± s.e. | P value | β ± s.e. | P value | |
| Before 1st drug | ||||
| Intercept | 0.762 ± 12.530 | 0.95 | −1.87 ± 13.24 | 0.89 |
| Race (black) | 5.847 ± 0.981† | <0.0001 | −1.47 ± 1.03** | 0.16 |
| Sex (male) | 2.79 ± 1.26 | 0.03 | 0.0826 ± 1.242 | 0.95 |
| Age, years | 0.1043 ± 0.0466 | 0.03 | 0.0492 ± 0.0545 | 0.37 |
| Log HT duration | 1.109 ± 0.425† | 0.01 | 0.719 ± 0.450 | 0.11 |
| Current smoker | 1.05 ± 1.53 | 0.50 | −0.250 ± 1.283 | 0.85 |
| Ethanol drinker | 1.516 ± 0.905 | 0.10 | 0.0515 ± 0.9648 | 0.96 |
| Height, cm | 0.00942 ± 0.0605 | 0.88 | 0.1211 ± 0.0636 | 0.06 |
| Waist, cm | −0.0121 ± 0.0334 | 0.72 | −0.0164 ± 0.0357 | 0.65 |
| Home BP, mm Hg | −0.2191 ± 0.0696 | 0.002 | −0.2671 ± 0.0704 | 0.0002 |
| Log PRA | −1.964 ± 0.527 | 0.0003 | 1.31 ± 0.631# | 0.04 |
| Model for atenolol add-on therapy | Model for HCTZ add-on therapy | |||
| β ± s.e. | P value | β ± s.e. | P value | |
| Before 2nd drug | ||||
| Intercept | 33.2 ± 10.0 | 0.001 | 12.6 ± 12.2 | 0.31 |
| Race (black) | 2.351 ± 0.798† | 0.004 | −0.931 ± 1.094¶ | 0.40 |
| Sex (male) | 2.39 ± 1.03 | 0.02 | 1.24 ± 1.39 | 0.38 |
| Age, years | 0.0232 ± 0.0448 | 0.61 | −0.0258 ± 0.0507 | 0.62 |
| Log HT duration | −0.763 ± 0.376† | 0.04 | 0.588 ± 0.463¶ | 0.21 |
| Current smoker | 3.34 ± 1.06 | 0.002 | 1.02 ± 1.63 | 0.53 |
| Ethanol drinker | 1.175 ± 0.798 | 0.14 | 1.145 ± 0.965 | 0.24 |
| Height, cm | −0.0839 ± 0.0533 | 0.12 | 0.0244 ± 0.0649 | 0.71 |
| Waist, cm | 0.0374 ± 0.0296 | 0.21 | 0.0380 ± 0.0358 | 0.29 |
| Home BP, mm Hg | −0.3823 ± 0.0499 | <0.0001 | −0.2718 ± 0.0639 | <0.0001 |
| Log PRA | −0.961 ± 0.416 | 0.02 | 1.812 ± 0.643# | 0.005 |
BP, blood pressure; HCTZ, hydrochlorothiazide; HT, hypertension; PRA, plasma renin activity.
Difference in regression coefficients between mono- and add-on therapy:
P < 0.01.
Difference in regression coefficients between atenolol and hydrochlorothiazide therapy:
P < 0.01;
P < 0.001;
P < 0.0001.
Figure 3.

Predicted blood pressure responses as a function of plasma renin activity. The plotted points are at the observed 10th, 25th, 50th, 75th, and 90th percentiles of plasma renin activity distributions prior to mono- and add-on therapy. Participants were randomized to receive atenolol monotherapy followed by hydrochlorothiazide add-on therapy (N = 180) or hydrochlorothiazide monotherapy followed by atenolol add-on therapy (N = 183). The predicted blood pressure responses at each renin percentile are from a single linear regression model in which all other predictors (race, sex, age, log hypertension duration, current smoker, ethanol intake, height, waist circumference, and baseline blood pressure) were held constant at their respective mean values. DBP, diastolic blood pressure; SBP, systolic blood pressure.
The percentage of variation in blood pressure response explained by the full model was greater for hydrochlorothiazide add-on therapy than monotherapy (41% vs. 27% for systolic responses, 30% vs. 21% for diastolic responses) but differed little between atenolol add-on and monotherapy (34% vs. 37% for systolic responses, 38% vs. 36% for diastolic responses) (Table 5). Expressed as a proportion of the full model R2 × 100%, the relative contribution of race and age to prediction of blood pressure responses was similar in magnitude to that of plasma renin activity (compare models 2 and 3 in Table 5); nevertheless, models that included both plasma renin activity and race and age explained greater variation in blood pressure responses than models that included only race and age ( compare models 2 and 4 in Table 5).
Table 5.
Percentage and proportion of variation in blood pressure responses explained by prediction models
| Predictors in model | R2 × 100% (proportion of full model R2 × 100%) | |||
|---|---|---|---|---|
| Systolic blood pressure response | Diastolic blood pressure response | |||
| Atenolol | HCTZ | Atenolol | HCTZ | |
| Monotherapy | ||||
| Full model | 37 (1.00) | 27 (1.00) | 36 (1.00) | 21 (1.00) |
| Baseline BP | 4 (0.12) | 13 (0.49) | 2 (0.05) | 8 (0.40) |
| Baseline BP + race + age | 21 (0.57) | 19 (0.71) | 22 (0.62) | 14 (0.67) |
| Baseline BP + renin | 23 (0.62) | 19 (0.72) | 17 (0.48) | 13 (0.63) |
| Baseline BP + race + age + renin | 29 (0.79) | 21 (0.79) | 27 (0.75) | 16 (0.76) |
| Add-on therapy | ||||
| Full model | 34 (1.00) | 41 (1.00) | 38 (1.00) | 30 (1.00) |
| Baseline BP | 18 (0.51) | 28 (0.67) | 22 (0.58) | 18 (0.61) |
| Baseline BP + race + age | 20 (0.59) | 33 (0.81) | 27 (0.70) | 22 (0.73) |
| Baseline BP + renin | 21 (0.62) | 32 (0.77) | 24 (0.62) | 25 (0.83) |
| Baseline BP + race + age + renin | 22 (0.65) | 36 (0.88) | 27 (0.71) | 27 (0.91) |
R2 × 100 is the percentage of variation in response explained by predictors in the regression model. Baseline BP refers to the home blood pressure prior to each drug administration. The full model includes all predictors (Tables 3 and 4): race, sex, age, log hypertension duration, current smoking, ethanol intake, height, waist, home blood pressure, and log plasma renin activity.
BP, blood pressure; HCTZ, hydrochlorothiazide.
Differences in predictors between monotherapy and add-on therapy
For blood pressure responses to atenolol, the global test of whether the predictors were dependent upon the order of administration (mono- or add-on therapy) was statistically significant for the systolic response (P < 0.0001) and the diastolic response (P = 0.001). For the systolic response, separate tests for dependence of each predictor on the order of atenolol administration were statistically significant for race (P = 0.003), log hypertension duration (P < 0.0001), cigarette smoking (P = 0.03), and log plasma renin activity (P = 0.04). The upper panel of Figure 3 illustrates for the systolic blood pressure response to atenolol add-on therapy, the diminished slope of its regression on plasma renin activity compared to monotherapy. For the diastolic response prediction, tests of interaction with the order of atenolol administration were statistically significant for race (P = 0.006) and log hypertension duration (P = 0.001) but not plasma renin activity (lower panel of Figure 3).
For responses to hydrochlorothiazide, analogous tests for dependence on the order of drug administration were not statistically significant for the systolic response prediction globally (P = 0.4479), the diastolic response prediction globally (P = 0.8445), or for any of the predictors considered separately (all P ≥0.10) (Figure 3).
DISCUSSION
The main finding of this study is that measurements of plasma renin activity, which were previously shown to predict blood pressure responses to β-blocker and thiazide diuretic monotherapies,9 also predict responses to add-on therapy with each drug. For both mono- and add-on therapy responses, the predictive effects of pretreatment plasma renin activity were statistically independent of and not subsumed by age, race, pretreatment blood pressure, or other participant characteristics. The dependency on plasma renin activity was directionally opposite for responses to the two drugs, and therefore drug specific, consistent with their different mechanisms of action6 and in contrast to their mathematical dependency on pretreatment blood pressure levels, which is not drug specific.16 Higher pretreatment plasma renin activity was associated with greater blood pressure responses to atenolol mono- and add-on therapies and with lesser responses to hydrochlorothiazide mono- and add-on therapies. For most responses, interindividual variation in plasma renin activity was no more or less predictive of blood pressure responses to add-on therapy than to monotherapy with the same drug. Finally, the predictive effects of plasma renin activity measurements did not require control of dietary sodium intake or monitoring and adjustment for differences in 24-h sodium excretion.
We found no other participant characteristics besides plasma renin activity and pretreatment blood pressure levels that consistently contributed to prediction of blood pressure responses to hydrochlorothiazide and atenolol mono- and add-on therapies. Although race, age, sex, hypertension duration, and cigarette smoking inconsistently contributed to the prediction of either systolic or diastolic responses to atenolol, the magnitude or direction of their effects was not consistent between responses to mono- and add-on therapy. The regression coefficients measuring the predictive effect of plasma renin activity on blood pressure response, in contrast, did not differ significantly between hydrochlorothiazide mono- and add-on therapy and only differed between atenolol mono- and add-on therapy for the systolic blood pressure response. From the multitude of antihypertensive drug response trials conducted during the past 50 years, including investigations of effects of gender,17 duration of hypertension,18 cigarette smoking,19 alcohol intake,20 and body size,18,21 remarkably few patient characteristics have been established as clinically useful predictors of blood pressure responses.
Laragh and colleagues initially advocated measurements of plasma renin activity to assess the relative contributions of vasoconstriction (implied by high renin–activating angiotensin), volume (implied by low renin), or their combination (implied by intermediate renin) and, thereby, provide a rational basis for personalized, more effective antihypertensive drug selection based on matching the drug’s mechanism of action to the observed pathophysiologic characteristics of individual patients.7,8 The original method focused on monotherapy and indexing of plasma renin activity to 24-h urinary sodium excretion was recommended. Small studies demonstrated relationships between plasma renin activity and blood pressure responses to monotherapy with diuretics,1,22–27 β-blockers,1,26,28–30 a converting enzyme inhibitor,31 and an angiotensin II antagonist.32 However, a previous study of 1,031 ambulatory men randomized to six different monotherapies concluded that the combination of age (younger or older than 60 years) and race (black or white) was “a better predictor of response” than plasma renin activity indexed for sodium excretion.9 The mean age (±s.d.) of the 746 patients ≥60 years old was 66 ± 4 years. In primary analyses that considered either age–race category or renin profile, neither method demonstrated significant advantage over the other. When both age–race category and renin profile were entered into the same prediction model, the coefficient representing age–race category was statistically significant but the coefficient for renin profile was not. Comparisons with our findings are not possible because of differences in study design, in particular, inclusion of women and upper age limit of 65 years.
Renin test–guided approaches to selection of initial treatment of hypertension have remained controversial33 and were never advised in guidelines for care of patients.34,35 A modified therapeutic algorithm that did not involve indexing plasma renin activity measurements to urinary sodium excretion was subsequently proposed to guide add-on and replacement drug selection in patients not controlled on one or more different agents.10,36 Following two initial reports of improved hypertension control with the modified, extended algorithm,37,38 Egan and colleagues recently compared results of its application with those achieved by clinical hypertension specialists’ care without knowledge of plasma renin activity measurements. 11 In 77 drug-treated but uncontrolled hypertensive patients, the percentage in whom hypertension was controlled was greater when add-on and replacement drug selection was guided by plasma renin activity measurements, and the declines in systolic and diastolic blood pressure levels were also greater; however, only the difference in systolic blood pressure declines achieved statistical significance (−29 vs. −19 mm Hg, respectively, P = 0.03). In this setting, the renin test–guided treatment algorithm was judged to be a “reasonable” strategy for correcting treated but uncontrolled hypertension. Results of our study demonstrate that plasma renin activity measurements, unindexed to sodium excretion, can provide predictive information regarding the magnitude of blood pressure response to a second agent added to monotherapy. Whether marginal benefits demonstrated relative to hypertension specialists’ care11 or as demonstrated in our study relative to race and age (Table 3) outweigh costs may be arguable.
Current guidelines recommend personalization of antihypertensive drug therapy based on patient comorbidities and drug adverse effects and costs.35 Importance of lowering blood pressure is emphasized, but no method is recommended to select which drug(s) will successfully lower blood pressure in individual patients. A recent meta-analysis of 147 randomized trials of antihypertensive drugs in 464,000 persons argues against tailoring treatment to individual patients.39 Although several easily determined individual characteristics have been shown to predict blood pressure responses to commonly prescribed antihypertensive drugs, both when administered as monotherapy and as add-on therapy, the majority of interindividual variation in blood pressure responses still remains unexplained. Whether measurements of genetic variation can substantially improve the prediction of antihypertensive drug responses remains to be determined.
Acknowledgments
We gratefully acknowledge the valuable contributions of the study participants, support staff, and study physicians: George Baramidze, Carmen Bray, Kendall Campbell, R. Whit Curry, Karen Hall, Frederic Rabari-Oskoui, Dan Rubin, and Siegfried Schmidt. In addition, we gratefully acknowledge the biostatistical analyses of Heather Wiste. US Public Health Service grants U01-GM074492, a component of the Pharmacogenetics Research Network; K23-HL091120 to A.L.B.; M01-RR00039 and M01-RR00585 for Centers For Transitional Science Activities at Emory University and Mayo Clinic, Rochester, MN; and funds from the Mayo Foundation.
Footnotes
Disclosure: The authors declared no conflict of interest.
References
- 1.Freis ED, Materson BJ, Flamenbaum V. Comparison of propranolol or hydrochlorothiazide alone for treatment of hypertension. III. Evaluation of the renin-angiotensin system. Am J Med. 1983;74:1029–1041. doi: 10.1016/0002-9343(83)90812-4. [DOI] [PubMed] [Google Scholar]
- 2.Bidiville J, Nussberger J, Waeber G, Porchet M, Waeber B, Brunner HR. Individual responses to converting enzyme inhibitors and calcium antagonists. Hypertension. 1988;11:166–173. doi: 10.1161/01.hyp.11.2.166. [DOI] [PubMed] [Google Scholar]
- 3.Materson BJ, Reda DJ, Cushman WC, Massie BM, Freis ED, Kochar MS, Hamburger RJ, Fye C, Lakshman R, Gottdiener J. Single-drug therapy for hypertension in men. A comparison of six antihypertensive agents with placebo. The Department of Veterans Affairs Cooperative Study Group on Antihypertensive Agents. N Engl J Med. 1993;328:914–921. doi: 10.1056/NEJM199304013281303. [DOI] [PubMed] [Google Scholar]
- 4.Materson BJ, Reda DJ, Preston RA, Cushman WC, Massie BM, Freis ED, Kochar MS, Hamburger RJ, Fye C, Lakshman R. Response to a second single antihypertensive agent used as monotherapy for hypertension after failure of the initial drug. Department of Veterans Affairs Cooperative Study Group on Antihypertensive Agents. Arch Intern Med. 1995;155:1757–1762. [PubMed] [Google Scholar]
- 5.Dickerson JE, Hingorani AD, Ashby MJ, Palmer CR, Brown MJ. Optimisation of antihypertensive treatment by crossover rotation of four major classes. Lancet. 1999;353:2008–2013. doi: 10.1016/s0140-6736(98)07614-4. [DOI] [PubMed] [Google Scholar]
- 6.Laragh JH, Lamport B, Sealey J, Alderman MH. Diagnosis ex juvantibus. Individual response patterns to drugs reveal hypertension mechanisms and simplify treatment. Hypertension. 1988;12:223–226. doi: 10.1161/01.hyp.12.3.223. [DOI] [PubMed] [Google Scholar]
- 7.Laragh JH. Vasoconstriction-volume analysis for understanding and treating hypertension: the use of renin and aldosterone profiles. Am J Med. 1973;55:261–274. doi: 10.1016/0002-9343(73)90128-9. [DOI] [PubMed] [Google Scholar]
- 8.Laragh JH, Baer L, Brunner HR, Buhler FR, Sealey JE, Vaughan ED., Jr Renin, angiotensin and aldosterone system in pathogenesis and management of hypertensive vascular disease. Am J Med. 1972;52:633–652. doi: 10.1016/0002-9343(72)90054-x. [DOI] [PubMed] [Google Scholar]
- 9.Preston RA, Materson BJ, Reda DJ, Williams DW, Hamburger RJ, Cushman WC, Anderson RJ. Age-race subgroup compared with renin profile as predictors of blood pressure response to antihypertensive therapy. Department of Veterans Affairs Cooperative Study Group on Antihypertensive Agents. JAMA. 1998;280:1168–1172. doi: 10.1001/jama.280.13.1168. [DOI] [PubMed] [Google Scholar]
- 10.Laragh JH. Laragh’s lessons in pathophysiology and clinical pearls for treating hypertension. Lesson XVI: how to choose the correct drug treatment for each hypertensive patient using a plasma renin-based method and the volume-vasoconstriction and analysis. Am J Hypertens. 2001;14:491–503. doi: 10.1016/s0895-7061(01)02097-0. [DOI] [PubMed] [Google Scholar]
- 11.Egan BM, Basile JN, Rehman SU, Davis PB, Grob CH, 3rd, Riehle JF, Walters CA, Lackland DT, Merali C, Sealey JE, Laragh JH. Plasma renin test-guided drug treatment algorithm for correcting patients with treated but uncontrolled hypertension: a randomized controlled trial. Am J Hypertens. 2009;22:792–801. doi: 10.1038/ajh.2009.63. [DOI] [PubMed] [Google Scholar]
- 12.Johnson JA, Boerwinkle E, Zineh I, Chapman AB, Bailey K, Cooper- DeHoff RM, Gums J, Curry RW, Gong Y, Beitelshees AL, Schwartz G, Turner ST. Pharmacogenomics of antihypertensive drugs: rationale and design of the Pharmacogenomic Evaluation of Antihypertensive Responses (PEAR) study. Am Heart J. 2009;157:442–449. doi: 10.1016/j.ahj.2008.11.018. [DOI] [PMC free article] [PubMed] [Google Scholar]
- 13.Chapman AB, Schwartz GL, Boerwinkle E, Turner ST. Predictors of antihypertensive response to a standard dose of hydrochlorothiazide for essential hypertension. Kidney Int. 2002;61:1047–1055. doi: 10.1046/j.1523-1755.2002.00200.x. [DOI] [PubMed] [Google Scholar]
- 14.Canzanello VJ, Baranco-Pryor E, Rahbari-Oskoui F, Schwartz GL, Boerwinkle E, Turner ST, Chapman AB. Predictors of blood pressure response to the angiotensin receptor blocker candesartan in essential hypertension. Am J Hypertens. 2008;21:61–66. doi: 10.1038/ajh.2007.24. [DOI] [PubMed] [Google Scholar]
- 15.Sealey JE. Plasma renin activity and plasma prorenin assays. Clin Chem. 1991;37:1811–1819. [PubMed] [Google Scholar]
- 16.Gill JS, Zezulka AV, Beevers DG, Davies P. Relation between initial blood pressure and its fall with treatment. Lancet. 1985;1:567–569. doi: 10.1016/s0140-6736(85)91219-x. [DOI] [PubMed] [Google Scholar]
- 17.Fan X, Han Y, Sun K, Wang Y, Xin Y, Bai Y, Li W, Yang T, Song X, Wang H, Fu C, Chen J, Shi Y, Zhou X, Wu H, Hui R. Sex differences in blood pressure response to antihypertensive therapy in Chinese patients with hypertension. Ann Pharmacother. 2008;42:1772–1781. doi: 10.1345/aph.1L036. [DOI] [PubMed] [Google Scholar]
- 18.Hiltunen TP, Suonsyrjä T, Hannila-Handelberg T, Paavonen KJ, Miettinen HE, Strandberg T, Tikkanen I, Tilvis R, Pentikäinen PJ, Virolainen J, Kontula K. Predictors of antihypertensive drug responses: initial data from a placebo-controlled, randomized, cross-over study with four antihypertensive drugs (The GENRES Study) Am J Hypertens. 2007;20:311–318. doi: 10.1016/j.amjhyper.2006.09.006. [DOI] [PubMed] [Google Scholar]
- 19.Materson BJ. Variability in response to antihypertensive drugs. Am J Med. 2007;120(4 Suppl 1):S10–S20. doi: 10.1016/j.amjmed.2007.02.003. [DOI] [PubMed] [Google Scholar]
- 20.Kaplan NM. Kaplan’s Clinical Hypertension. 9. Lippincott Williams & Wilkins; Philadelphia, PA: 2006. Treatment of hypertension: drug therapy; pp. 217–310. [Google Scholar]
- 21.Materson BJ, Williams DW, Reda DJ, Cushman WC Veterans Affairs Cooperative Study Group on Antihypertensive Agents. Response to six classes of antihypertensive medications by body mass index in a randomized controlled trial. J Clin Hypertens (Greenwich) 2003;5:197–201. doi: 10.1111/j.1524-6175.2003.02029.x. [DOI] [PMC free article] [PubMed] [Google Scholar]
- 22.Adlin EV, Marks AD, Channick BJ. Spironolactone and hydrochlorothiazide in essential hypertension. Blood pressure response and plasma renin activity. Arch Intern Med. 1972;130:855–858. [PubMed] [Google Scholar]
- 23.Vaughan ED, Jr, Laragh JH, Gavras I, Bühler FR, Gavras H, Brunner HR, Baer L. Volume factor in low and normal renin essential hypertension. Treatment with either spironolactone or chlorthalidone. Am J Cardiol. 1973;32:523–532. doi: 10.1016/s0002-9149(73)80044-x. [DOI] [PubMed] [Google Scholar]
- 24.Woods JW, Pittman AW, Pulliam CC, Werk EE, Jr, Waider W, Allen CA. Renin profiling in hypertension and its use in treatment with propranolol and chlorthalidone. N Engl J Med. 1976;294:1137–1143. doi: 10.1056/NEJM197605202942101. [DOI] [PubMed] [Google Scholar]
- 25.Niarchos AP, Weinstein DL, Laragh JH. Comparison of the effects of diuretic therapy and low sodium intake in isolated systolic hypertension. Am J Med. 1984;77:1061–1068. doi: 10.1016/0002-9343(84)90189-x. [DOI] [PubMed] [Google Scholar]
- 26.Blaufox MD, Lee HB, Davis B, Oberman A, Wassertheil-Smoller S, Langford H. Renin predicts diastolic blood pressure response to nonpharmacologic and pharmacologic therapy. JAMA. 1992;267:1221–1225. [PubMed] [Google Scholar]
- 27.Glorioso N, Melis MG, Manunta P, Troffa C, Tonolo G, Soro A, Madeddu P, Pazzola A, Pala F, Cusi D. Different sensitivity to hydrochlorothiazide and to potassium-canrenoate among essential hypertensive patients. Clin Exp Hypertens. 1993;15(Suppl 1):187–196. [PubMed] [Google Scholar]
- 28.Bühler FR, Laragh JH, Baer L, Vaughan ED, Jr, Brunner HR. Propranolol inhibition of renin secretion. A specific approach to diagnosis and treatment of renin-dependent hypertensive diseases. N Engl J Med. 1972;287:1209–1214. doi: 10.1056/NEJM197212142872401. [DOI] [PubMed] [Google Scholar]
- 29.Bühler FR, Laragh JH, Vaughan ED, Jr, Brunner HR, Gavras H, Baer L. Antihypertensive action of propranolol. Specific antirenin responses in high and normal renin forms of essential, renal, renovascular and malignant hypertension. Am J Cardiol. 1973;32:511–522. doi: 10.1016/s0002-9149(73)80043-8. [DOI] [PubMed] [Google Scholar]
- 30.Drayer JI, Keim HJ, Weber MA, Case DB, Laragh JH. Unexpected pressor responses to propranolol in essential hypertension. An interaction between renin, aldosterone and sympathetic activity. Am J Med. 1976;60:897–903. doi: 10.1016/0002-9343(76)90911-6. [DOI] [PubMed] [Google Scholar]
- 31.Case DB, Wallace JM, Keim HJ, Weber MA, Sealey JE, Laragh JH. Possible role of renin in hypertension as suggested by renin-sodium profiling and inhibition of converting enzyme. N Engl J Med. 1977;296:641–646. doi: 10.1056/NEJM197703242961201. [DOI] [PubMed] [Google Scholar]
- 32.Case DB, Wallace JM, Keim HJ, Weber MA, Drayer JI, White RP, Sealey JE, Laragh JH. Estimating renin participation in hypertension: superiority of converting enzyme inhibitor over saralasin. Am J Med. 1976;61:790–796. doi: 10.1016/0002-9343(76)90160-1. [DOI] [PubMed] [Google Scholar]
- 33.Kaplan NM. Renin profiles. The unfulfilled promises. JAMA. 1977;238:611–613. [PubMed] [Google Scholar]
- 34.Report of the Joint National Committee on Detection, Evaluation, and Treatment of High Blood Pressure. A cooperative study. JAMA. 1977;237:255–261. [PubMed] [Google Scholar]
- 35.Chobanian AV, Bakris GL, Black HR, Cushman WC, Green LA, Izzo JL, Jr, Jones DW, Materson BJ, Oparil S, Wright JT, Jr, Roccella EJ. Joint National Committee on Prevention, Detection, Evaluation, and Treatment of High Blood Pressure. National Heart, Lung, and Blood Institute; National High Blood Pressure Education Program Coordinating Committee. Seventh report of the Joint National Committee on Prevention, Detection, Evaluation, and Treatment of High Blood Pressure. Hypertension. 2003;42:1206–1252. doi: 10.1161/01.HYP.0000107251.49515.c2. [DOI] [PubMed] [Google Scholar]
- 36.Laragh J. Laragh’s lessons in pathophysiology and clinical pearls for treating hypertension. Am J Hypertens. 2001;14:603–609. doi: 10.1016/s0895-7061(01)02156-2. [DOI] [PubMed] [Google Scholar]
- 37.Blumenfeld JD, Laragh JH. Renin system analysis: a rational method for the diagnosis and treatment of the individual patient with hypertension. Am J Hypertens. 1998;11:894–896. doi: 10.1016/s0895-7061(98)00080-6. [DOI] [PubMed] [Google Scholar]
- 38.Spence JD. Physiologic tailoring of therapy for resistant hypertension: 20 years’ experience with stimulated renin profiling. Am J Hypertens. 1999;12:1077–1083. [PubMed] [Google Scholar]
- 39.Law MR, Morris JK, Wald NJ. Use of blood pressure lowering drugs in the prevention of cardiovascular disease: meta-analysis of 147 randomised trials in the context of expectations from prospective epidemiological studies. BMJ. 2009;338:b1665. doi: 10.1136/bmj.b1665. [DOI] [PMC free article] [PubMed] [Google Scholar]