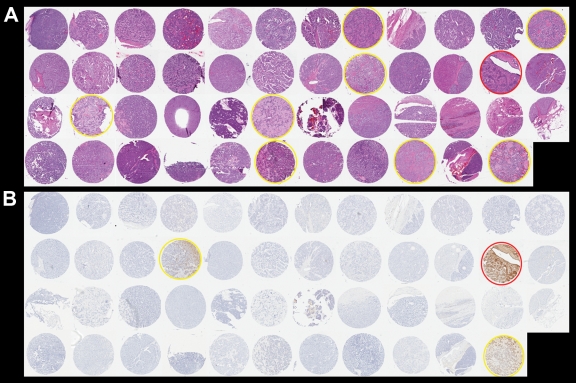
Figure 6:
Photomicrographs in 47 controls. A, Tissue microarray shows 47 well-differentiated endocrine neoplasms. Yellow circle = hyalinized stroma, red circle = prominent stromal fibrosis. (H-E stain.) B, Immunohistochemical labeling shows partial serotonin immunoreactivity (yellow circle) in two cases and strong serotonin immunoreactivity (red circle) in one case. (Original magnification in A and B, ×200.)

