Abstract
The present study aims to predict the regiospecific glucuronidation of three dihydroxyflavones and seven mono-hydroxyflavones in human liver and intestinal microsomes using recombinant UGT isoforms. Seven mono-hydroxyflavones (or HFs), 2′-, 3′-, 4′-, 3-, 5-, 6-, and 7-hydroxyflavone, and three di-hydroxyflavones (or diHFs), 3,7-dihydroxyflavone (3,7-diHF), 3,5-dihydroxyflavone (3,5-diHF) and 3,4′-dihydroxyflavone (3,4′-diHF) were chosen and rates were measured at 2.5, 10 and 35 μM. The results indicated that the position of glucuronidation of three diHFs could be determined by using the UV spectra of relevant HFs. The results also indicated that UGT1A1, UGT1A7, UGT1A8, UGT1A9, UGT1A10 and UGT2B7 are the most important six UGT isoforms for metabolizing the chosen flavones. Regardless of isoforms used, 3-HF was always metabolized the fastest whereas 5-HF was usually metabolized the slowest, probably due to the formation of an intra-molecular hydrogen bond between 4-carbonyl and 5-OH group. Relevant UGT isoform-specific metabolism rates generally correlated well with the rates of glucuronidation in human intestinal and liver microsomes at each of the three tested concentrations. In conclusion, the glucuronidation “fingerprint” of seven selected mono-hydroxyflavones was affected by UGT isoforms used, positions of the −OH group, and the substrate concentrations, and the rates of glucuronidation by important recombinant UGTs correlated well with those obtained using human liver and intestinal microsomes.
Introduction
Flavonoids are widely distributed in a variety of natural plants and edible foods including fruits and vegetables. They appear to possess significant biological activities in the areas of anticancer, anti-inflammation, and in prevention of coronary heart diseases and other age-related illnesses 1,2. Despite of these promises, no chemopreventive agent has been approved using this class of compounds, perhaps because their low bioavailabilities impede their development into chemopreventive agents 3,4. Many studies including our own have demonstrated that extensive first-pass metabolism by phase II conjugating enzymes including UGTs and SULTs is the most important reasons for their low bioavailabilities 5,6.
Flavones and flavonols, two subclasses of flavonoids, are known to have low oral bioavailabilities 7. It was reported that flavonols such as kaempferol and quercetin were mainly present as glucuronides in human plasma after oral administration 8,9, although significant amounts of sulfates were present as well 9. In the rat intestine, a significant portion of the absorbed aglycones such as quercetin and apigenin was conjugated and the metabolites (mostly glucuronides) were excreted into the lumen 10. Thus, the published studies provided strong evidence that rapid conjugation via glucuronidation and sulfation is the main reason for their low bioavailabilities in vivo.
Whereas it was possible to identify the main cause of poor bioavailability experimentally, a more desired course of action would be to predict glucuronidation and sulfation of flavonoids. Previously, it was shown that glucuronidation of hydroxyflavones in human jejunum S9 was affected by the structure of flavones, especially the positions of phenolic group 11,12. Our earlier study showed that glucuronidation of isoflavones are also affected by structural changes and the position of the phenolic group 13, although the latter effect is distinctively different from that of flavones shown by other investigators 11,12. In any rate, we believed that the prediction can be achieved via several methods with increasing utility, degree of difficulty and broad structure features; (1) use of isoform-specific metabolism data (i.e., glucuronidation fingerprint) to predict organ specific glucuronidation; (2) use of the glucuronidation of a simpler flavone (e.g., 3-HF) to predict glucuronidation of more complex flavone (e.g., 3,5-diHF); (3) statistical modeling using experimental values and regression analysis of a large database set; (4) computational modeling using 3-D chemical structures incorporating conformations, again using large dataset. In the present study, our focus is on the first two areas as the latter two approaches are very different.
The first method of prediction uses glucuronidation fingerprint, which is useful because a flavone (e.g., eupatilin) was shown to be glucuronidated by specific UGT isoforms 14. It is also possible to predict with high degree of success the glucuronidation of isoflavones using isoform-specific glucuronidation fingerprint 13. Because fingerprinting the glucuronidation may be used to gauge the safety and efficacy concerns arisen from potential drug-drug interactions, this method is further expanded here to determine if they can be applied to flavones as well.
The second method of prediction is to use the data derived from simpler mono-hydroxyflavones to predict the metabolism behaviors of more complex flavones such as diHFs. To achieve this objective, the present investigation determined if it was possible to predict the regiospecific glucuronidation of diHFs via the use of multiple HFs, which had not been done previously.
The present study has chosen the following 7 mono-hydroxyflavones (or HFs): 2′-hydroxyflavone (2′-HF), 3′-hydroxyflavone (3′-HF), 4′-hydroxyflavone (4′-HF), 3-hydroxyflavone (3-HF), 5-hydroxyflavone (5-HF), 6-hydroxyflavone (6-HF) and 7-hydroxyflavone (7-HF), because they represent almost all HFs possible, although 8-hydroxyflavone was not used here because it was not commercially available. These seven HFs were used along with three di-hydroxyflavones: 3,5-diHF, 3,7-diHF and 3,4′-diHF to test the predictability of the first two prediction methods described previously.
Materials and Methods
Materials
Seven hydroxyflavones were all purchased from LC Laboratories (Woburn, MA). Expressed human UGT isoforms (Supersomes™), pooled female human liver and intestinal microsomes were purchased from BD Biosciences (Woburn, MA). Uridine diphosphoglucuronic acid (UDPGA), β-glucuronidase, alamethicin, D-saccharic-1,4-lactone monohydrate, magnesium chloride, and Hanks' balanced salt solution (HBSS, powder form) were purchased from Sigma-Aldrich (St Louis, MO). All other materials (typically analytical grade or better) were used as received.
Enzymatic Activities of Expressed UGTs
The incubation procedures for measuring UGTs' activities were essentially the same as published before 5,15. Briefly, incubation procedures using microsomes or UGT Supersomes™ were as follows: (1) microsomes (final concentration ≈ in range of 0.0053∼0.053 mg of protein per mL based on optimization of the reaction), magnesium chloride (0.88 mM), saccharolactone (4.4 mM), alamethicin (0.022 mg/mL), different concentrations of substrates in a 50 mM potassium phosphate buffer (pH 7.4), and UDPGA (3.5 mM, add last) were mixed; (2) the mixture (final volume) 200 μL) was incubated at 37°C for a predetermined period of time (30 or 60 min); and (3) the reaction was stopped by the addition of 50μL of 94% acetonitrile/6% glacial acetic acid containing 100 μM testosterone as the internal standard. For UGT profiling, three concentrations, 2.5, 10 and 35 μM, were used.
UPLC Analysis of Hydroxyflavones and Their Glucuronides
We analyzed seven HFs, three diHFs and their respective glucuronides by using the following common method: system, Waters Acquity UPLC with photodiode array detector and Empower software; column, BEH C18, 1.7 μm, 2.1 × 50 mm; mobile phase B, 100% acetonitrile, mobile phase A, 100% aqueous buffer (2.5mM NH4Ac, pH 7.4); flow rate 0.45 mL/min; gradient, 0 to 2.0 min, 10–35% B, 2.0 to 3.0 min, 35–70% B, 3.2 to 3.5 min, 70–10% B, 3.5 to 4.0 min, 10% B, wavelength, 254 nm for HFs, 3,4′-diHF, 3,7-diHF and their respective glucuronides and testosterone; 263 nm for 3,5-diHF and its glucuronide, injection volume, 10μL. Linearity was established in the range of 0.78-50 μM for all compounds. The LLOQ for all compounds was at least 0.78μM. The analytical method for each compound was validated for inter-day and intra-day variations using 6 samples at each of the three concentrations (50, 12.5 and 1.56 μM). Precision and accuracy for all compounds were in acceptable range (<15%).
Confirmation of Hydroxyflavone and Dihydroxyflavone Glucuronide Structure by LC-MS/MS
Seven HFs, three diHFs and their respective glucuronides were separated by the same UPLC-MS/MS system but using slightly different chromatographic conditions because of mass spectrometer requirements. Here, mobile phase A was an ammonium acetate buffer (pH 7.4) and mobile phase B was 100% acetonitrile with the gradient as follows: 0 to 2.0 min, 10–35% B, 2.0 to 3.0 min, 35–70% B, 3.2 to 3.5 min, 70–10% B, 3.5 to 4.0 min, 10% B. The flow rate was 0.45 mL/min. The effluent was introduced into an API 3200 Qtrap triple-quadrupole mass spectrometer (Applied Biosystem/MDS SCIEX, Foster City, CA) equipped with a TurboIonSprayTM source. The mass spectrometer was operated in the negative ion mode to perform the analysis of six flavones and their glucuronides. The main working parameters for the mass spectrometers were set as follows: ion-spray voltage, -4.5 kV; ion source temperature, 400°C; nebulizer gas (gas1), nitrogen, 40 psi; turbo gas (gas2), nitrogen, 40 psi; curtain gas, nitrogen, 20 psi and minor adjustments were then made for each flavone. Flavone mono-glucuronides were identified by MS and MS2 full scan modes (Fig.2)
Fig.2. UPLC and LC-MS/MS Chromatographic Profiles of diHFs and Their Glucuronides.
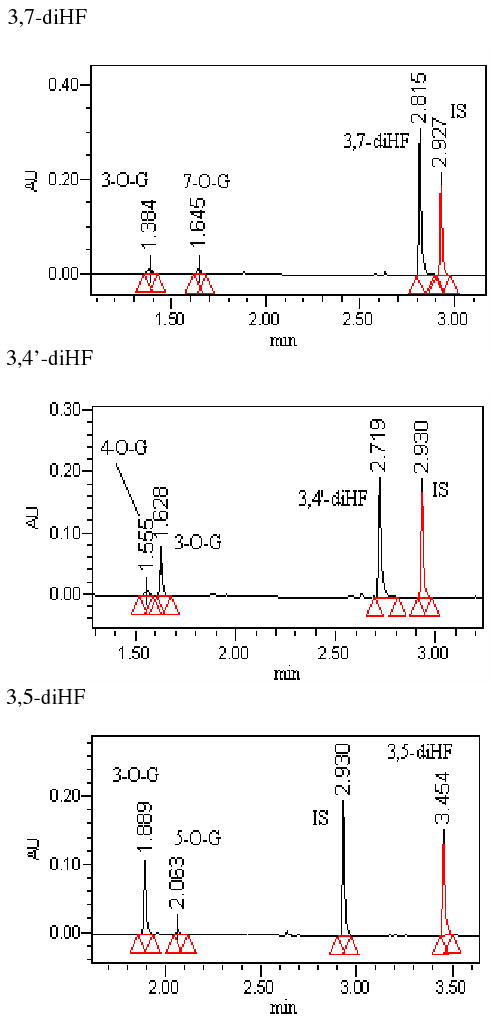
Each panel showed one diHF (e.g., 3,7-diHF, 3,5-diHF or 3,4′- diHF) and its two mono-glucuronides. Conditions for generating these profiles were presented in the Method section.
Determination of molar extinction coefficient ratio (ECR) for the glucuronides of seven HFs and three diHFs
In order to provide more precise estimation on the concentrations and glucuronidation rates of flavones in the current study, a conversion factor (K), which represents the ratio between the molar extinction coefficient of the glucuronide and its aglycone, was determined for each flavone. To calculate the conversion factor K, glucuronides of HFs were prepared using Caco-2 cell monolayers. The culture conditions for growing Caco-2 TC7 cells have been described previously 16,17. Briefly, the seeding density was 250,000 cells/ml (2 ml for each well in a 6-well plate), and the cells were grown in a regular growth medium (DMEM supplemented with 10% fetal bovine serum). Caco-2 TC7 cells were fed every other day, and the monolayer was ready for experiments at 11 days after seeding. On 12th day, the Caco-2 TC7 cells were washed with HBSS (pH7.4, 37°C) three times. After the HBSS buffer were aspirated out, 2.5ml solution of a HF (10μM, n=3) was added to each monolayer and allowed to incubate for 8 hr at 37°C. The supernatant was then removed and extracted with methylene chloride twice (sample/dichloromethane=1:3, v/v) to remove >95% of flavone aglycones. The resulting sample was then divided into two parts, one of which was analyzed directly and the other analyzed after being hydrolyzed with β-glucuronidase (100 units/ml) at 37°C for 2h. The difference in amount of aglycones found in these two samples was the amount of metabolite formed. The relationship between the peak areas of the metabolites before hydrolysis and the peak areas of aglycones after the hydrolysis is used to establish the conversion factor used to quantify the amounts of flavone conjugates as described previously 16,18. For diHFs, mono-glucuronides of dihydroxyflavones were prepared using selected UGT isoform (s) based on UGT fingerprint information (i.e., only one glucuronide was produced at each instance). The conversion factor (K) was then similarly calculated as described previously for HFs. In quantification of metabolites, a previously published method in our labs was used 13.
Statistical Analysis
One-way ANOVA with or without Tukey-Kramer multiple comparison (posthoc) tests were used to evaluate statistical differences. Differences were considered significant when p values were less than 0.05 (or p<0.05).
Results
Confirmation of Glucuronide Formation by LC-MS/MS
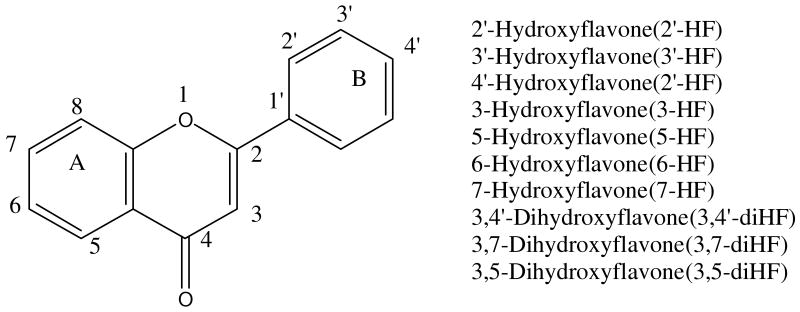
We conducted LC-MS/MS studies of the metabolites of all flavones (Fig.1) used in the present studies to show that all glucuronides formed using the expressed human UGTs were mono-glucuronides (Fig.2, 3). Although no di-glucuronide of dihydroxyflavones was found, a second but minor mono-glucuronide was found for all three diHFs.
Fig.1. Structures of Model Flavones.
Shown in the scheme are structures of aglycone forms of hydroxyflavone analogs. Glucuronidated metabolites may be formed at the 5, 6, or 7 phenolic group on the A ring, or 2′-OH, 3′-OH or 4′-OH phenolic group on the B ring, or 3-OH group on the C ring. 2′-Hydroxyflavone(2′-HF) 3′-Hydroxyflavone(3′-HF) 4′-Hydroxyflavone(2′-HF) 3-Hydroxyflavone(3-HF) 5-Hydroxyflavone(5-HF) 6-Hydroxyflavone(6-HF) 7-Hydroxyflavone(7-HF) 3,4′-Dihydroxyflavone(3,4′-diHF) 3,7-Dihydroxyflavone(3,7-diHF) 3,5-Dihydroxyflavone(3,5-diHF)
Fig.3. UPLC and LC-MS/MS Chromatographic Profiles of HFs and Their Glucuronides.
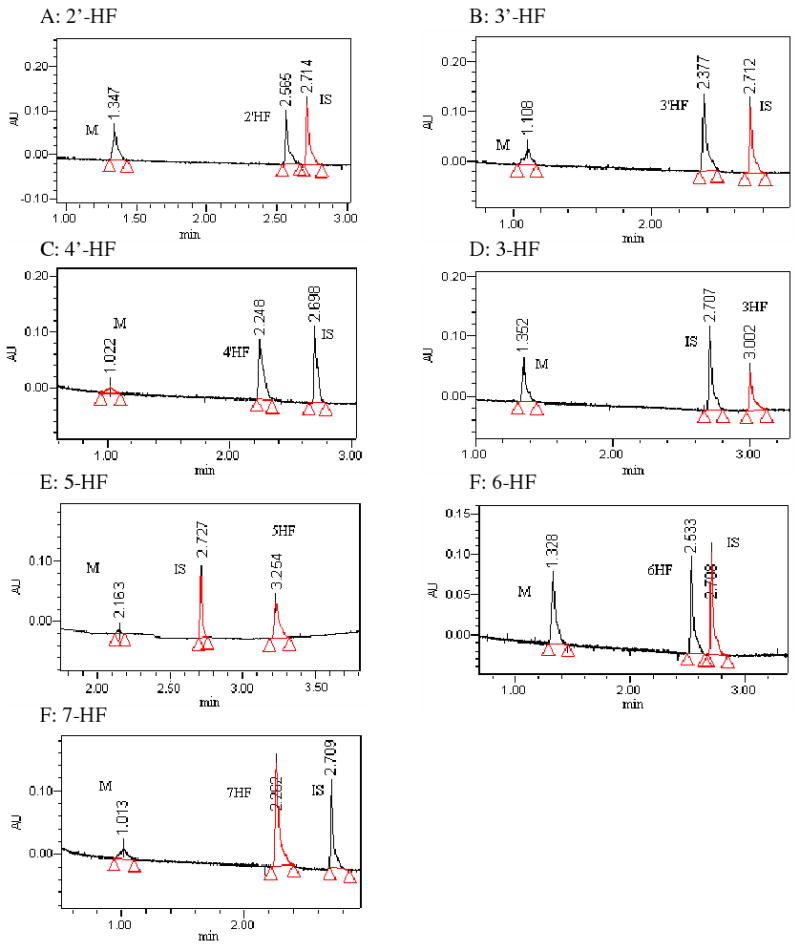
Each panel showed a single HF (e.g., 2′-HF, 3′-HF, 4′-HF, 3-HF, 5-HF, 6-HF, or 7-HF) and its mono-glucuronide. Conditions for generating these profiles were presented in the Method section.
Determination of the position of glucuronidation for 3,7-diHF, 3,5-diHF and 3,4′-diHF
All three diHFs have two glucuronides. Because there is a lack of commercial standards of flavone glucuronides, it was necessary to determine the position of mono-glucuronide using the UV spectra. The site of glucuronic acid substitutions in flavonol(s) was established using UV peak shift method 19. In general, the UV spectrum of flavones have two λmax's, one at 300 nm plus region (λmax1), and the other at 240 nm region (λmax2). For 3-HF, glucuronidation at the 3-OH position severely diminished the peak at 343.7 nm, causing λmax1 to blue shift (i.e., move λmax1 to a shorter wavelength) approximately 34 nm. For 7-HF and 4′-HF, the blue shift was no change or only 10 nm around λmax1 and shift around λmax2 was minimal. Glucuronidation of 5-hydorxyl group for 5-HF resulted in major change in UV spectrum with blue shift in both λmax1 (a large 35 nm shift) and λmax2 (a smaller 8 nm shift), suggesting glucuronidation at this site significantly altered electron conjugation of the flavone ring structure. Identification of glucuronide position using the shift in λmax1 and λmax2 values was shown in Figure 4, and the extinction coefficients ratios of all HFs and diHFs were listed in Table 1.
Fig.4. UV Spectra of Seven Model Flavones and Their Respective Mono-glucuronide.
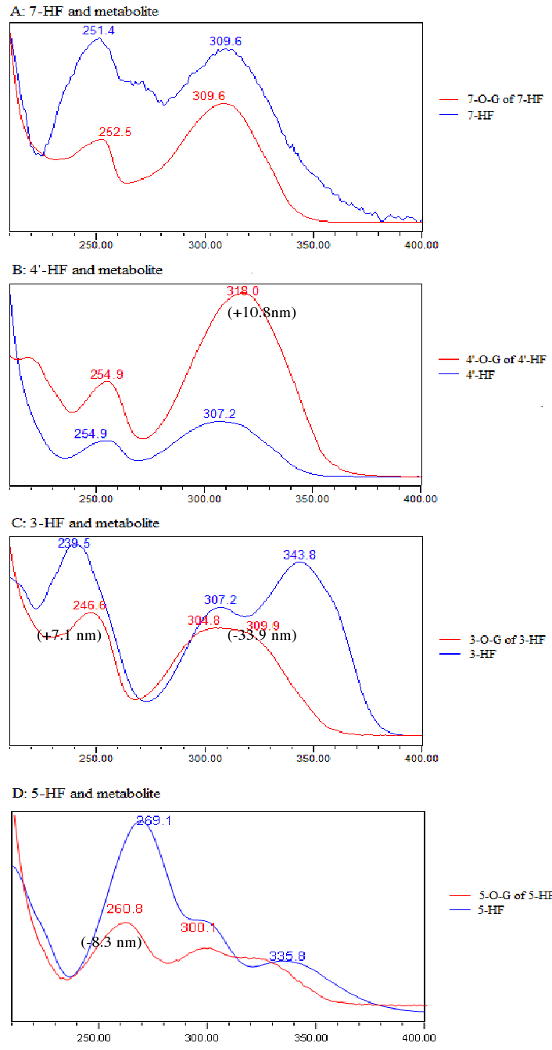
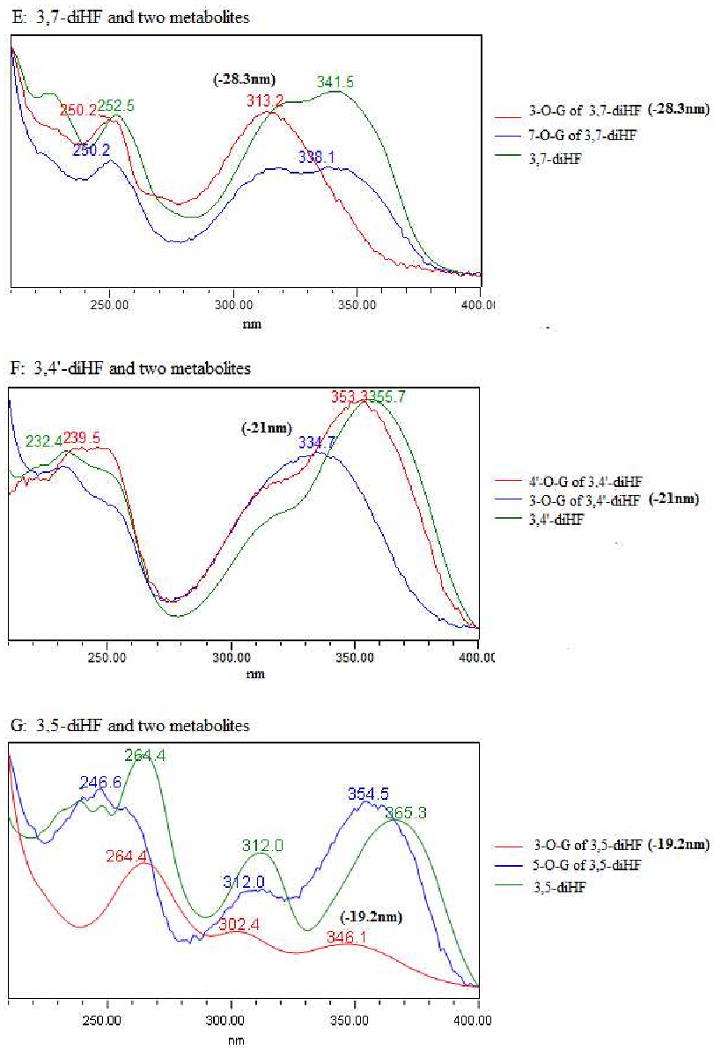
The seven flavones are 4′-HF, 3-HF, 5-HF, 7-HF, 3,4′-diHF, 3,5-diHF and 3,7-diHF. There were also 10 mono-glucuronides in this figure since each of the diHF generated two monoglucuronides. Each of the UV spectra has two regions, marked by a peak near the 330 nm region (λmax1) and another one near the 250 nm region (λmax2). Shifts in λmax1 and/o λmax2 values or a lack of shift were used to determine the position of glucuronidation in a diHF.
Table.1.
The conversion factors (K) are showed at different wavelengths for all seven glucuronides of HFs, and all six mono glucuronides of diHFs.
| Glucuronide | wavelength (λmax, nm) | K (conversion factor) |
|---|---|---|
| 2′-Hydroxyflavone 2′-O-G | 254 | 1.26±0.08 |
| 3′-Hydroxyflavone 3′-O-G | 254 | 0.93±0.02 |
| 4′-Hydroxyflavone 4′-O-G | 254 | 1.16±0.02 |
| 3-Hydroxyflavone 3-O-G | 254 | 0.96±0.06 |
| 5-Hydroxyflavone 5-O-G | 254 | 0.84±0.13 |
| 6-Hydroxyflavone 6-O-G | 254 | 0.99±0.03 |
| 7-Hydroxyflavone 7-O-G | 254 | 0.96±0.03 |
| 3,4′-Hydroxyflavone 3-O-G | 254 | 1.02±0.03 |
| 3,4′-Hydroxyflavone 4′-O-G | 254 | 0.87±0.03 |
| 3,5-Hydroxyflavone 3-O-G | 263 | 1.38±0.03 |
| 3,7-Hydroxyflavone 3-O-G | 254 | 1.29±0.03 |
| 3,7-Hydroxyflavone 7-O-G | 254 | 0.86±0.09 |
For diHFs, a similar approach was used based on the shift at λmax1 and λmax2 regions. For 3,7-diHF, when the λmax1 region of the UV spectrum of a glucuronide showed a diminished peak and a blue shift of nearly 28 nm, this metabolite was assigned to 3-O-glucuronide. Similarly, because λmax1 and λmax2 regions of the second mono-glucuronide showed no change when compared to 3,7-diHF, this metabolite was assigned to 7-O-glucuronide (Figure 4, E1∼E3).
For 3,4′-diHF, metabolite 1 showed a large λmax1 shift of 21 nm, it was assigned to 3-O-glucuronide of 3,4′-diHF, whereas metabolite 2 showed a hypsochromic (or red) shift at λmax2 region of 7.1 nm and nearly no shift at λmax1 region when compared to aglycone, this metabolite was assigned as 4′-O-glucuronide of 3,4′-diHF (Figure 4, F1∼F3). Using a similar methodology for 3,5-diHF, metabolite 1 that caused a major blue shift at λmax1 region was assigned to 3-O-glucuronide whereas the other one was assigned to 5-O-glucuronide (Figure 4, G1∼G3). This identification of glucuronide position is important because it provided the basis for determine molar extinction coefficient ratios as shown in Table 1.
Glucuronidation “fingerprints” of 4 HFs by 12 expressed human UGTs
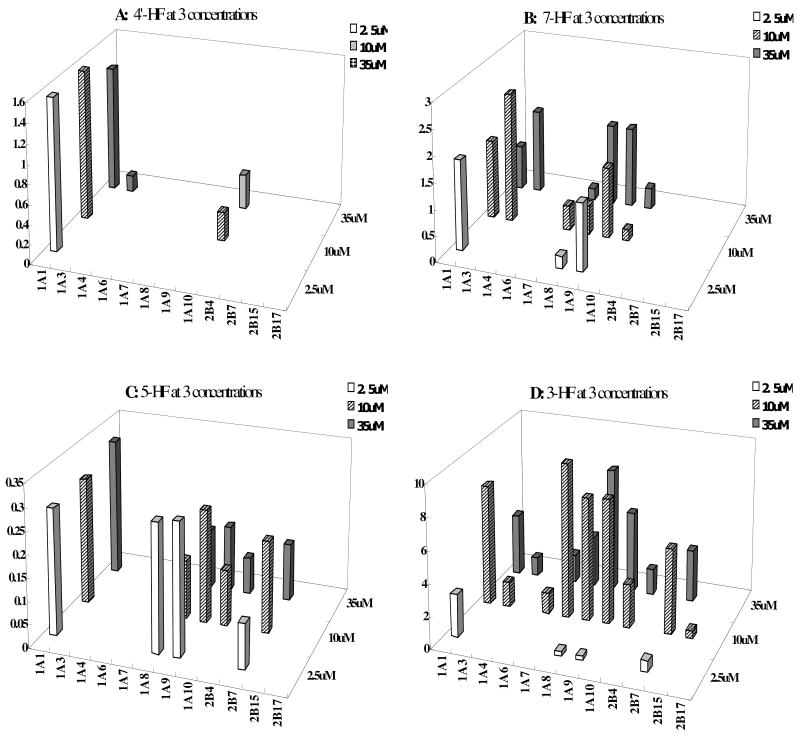
We incubated the selected four mono-hydroxyflavones (3-HF, 4′-HF, 5-HF and 7-HF) at three concentrations (2.5, 10, 35μM) with 12 human UGT isoforms (Figure 5). It was clear that each HF had a distinctive UGT isoform fingerprint and this fingerprint often changed with the concentration of the substrate used, sometimes drastically as in the case of 3-HF.
Fig.5. Glucuronidation of 4′-HF, 3-HF, 5-HF and 7-HF at Three Concentrations by 12 Expressed Human UGTs.
Experiments were conducted at three concentrations (2.5, 10, and 35μM) at 37 °C for 1 (or 0.5) hr and the amounts of mono-glucuronides formed were measured using UPLC. Rates of glucuronidation were calculated as nmol/min/mg of protein. Each bar is the average of three determinations, and the error bars are the standard deviations of the mean (n=3).
By examining the contributions of individual UGT isoform, UGT1A1 was found to be one of the main isoforms for 4 selected HFs at all concentrations. For 4′-HF, UGT1A10 contributed to its glucuronidation the most, UGT1A1 contributed at 10μM and 35μM, and UGT1A3 generated a detectable glucuronide of 4′-HF at 35μM (Fig.5A). For 3-HF, UGT1A7, 1A9, 1A8, 1A1, 2B7 and UGT1A10 were the top 6 isoforms at 10 and 35μM, whereas UGT1A3, 1A6 and 2B15 all made small and variable contributions (Fig.5D). For 7-HF, UGT1A1 was the top UGT isoform, followed by UGT1A9 and UGT1A8 at 2.5μM. The rank-order changed to 1A3, 1A1, 1A9, 1A8, 1A7 and 1A10 at 10μM, and to 1A3, 1A9, 1A8, 1A1, 1A10, 1A7 at 35μM (Fig.5B). For 5-HF, UGT1A1, 1A8, 1A9, 1A10 and 2B7 generated a detectable glucuronidation at three concentrations, whereas the other UGT isoforms did not metabolize 5-HF (Fig.5C). Taken together, the glucuronidation of HFs was compound-, concentration-, and isoform-dependent.
Structural-Specific Metabolic Patterns of Seven Hydroxyflavones by Six UGT isoforms
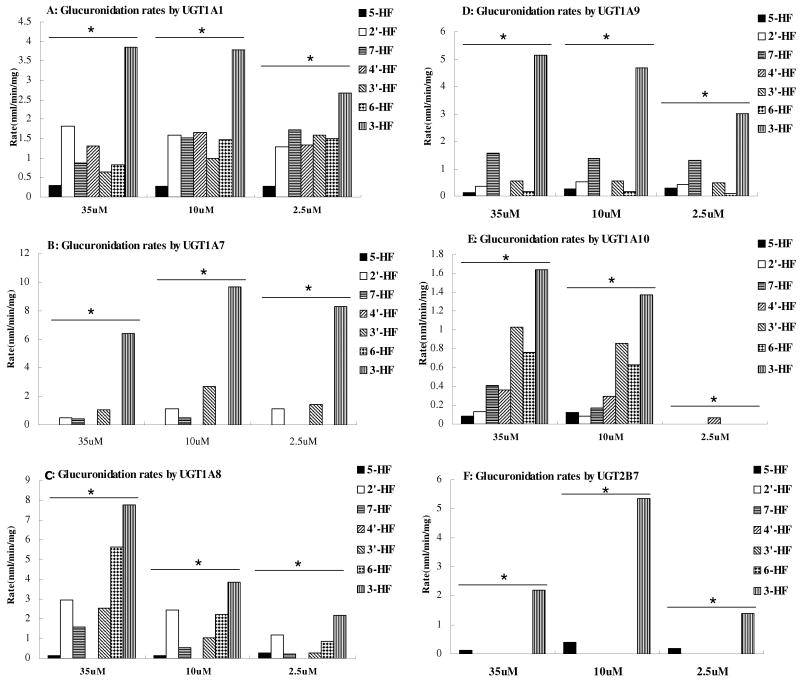
As shown in Figure 5, human recombinant UGT1A1, UGT1A7, UGT1A8, UGT1A9, UGT1A10 and UGT2B7 isoforms were the most important isoforms for metabolizing HFs. Additionally, UGT1A1, UGT1A7, UGT1A8, UGT1A9, UGT1A10 and UGT2B7 are highly expressed in human liver and/or intestinal microsomes. Therefore, these six UGT isoforms probably play the most important role in metabolizing all the HFs. To highlight the importance of these six isoforms, the data from the previous 4 HFs were re-plotted together with glucuronidation rates of 3 additional HFs to first show how changes in structures affected glucuronidation. The results showed that at all concentrations, 3-HF was metabolized the fastest and at all concentrations by all isoforms among the seven mono-hydroxyflavones studied, whereas 5-HF or 4′-HF was usually metabolized the slowest (Fig.6). On the other hand, the middle of the rank order often changed with isoform or concentration, sometimes drastically. In fact, formation of glucuronidation metabolite of 4′-HF was not detected when UGT1A7, UGT1A8 UGT1A9 or UGT2B7 was used, even though the same compound was fairly rapidly metabolized by UGT1A1. More detailed accounts for each UGT isoform-specific structural effects were presented below.
Fig.6. Concentration-dependent Glucuronidation of Seven Hydroxyflavones by Expressed Human UGT1A1, UGT1A7, UGT1A8, UGT1A9, UGT1A10 and UGT2B7.
Experiments were conducted at three concentrations (35μM, 10μM and 2.5μM). The experiments were conducted at 37 °C for 1(or 0.5) hr and the amounts of glucuronides formed were measured using UPLC. Rates of glucuronidation were calculated as nmol/min/mg of protein. Each bar is the average of three determinations, and the error bars are the standard deviations of the mean (n=3).
For UGT1A1, at 2.5μM substrate concentration, glucuronidation of 3-HF was the fastest (2.68 ± 0.47 nmol per min per mg of protein), followed by 7-HF (1.73 ±0.21), 3′-HF(1.59 ±0.26), 6-HF (1.50±0.18), 4′-HF (1.34 ±0.21), 2′-HF (1.28±0.12) and 5-HF(0.28±0.00). At 10μM and 35μM substrate concentrations, the trends changed somewhat but 3-HF was still glucuronidated the fastest (3.80±0.21 and 3.85±0.12) and 5-HF the slowest (0.28±0.01 and 0.308±0.02).
For UGT1A7, at 2.5μM substrate concentration, the rank order of glucuronidation for seven hydroxyflavones was 3-HF(8.27±0.15) > 3′-HF(1.44±0.20) > 2′-HF(1.13±0.11) > 7-HF = 5-HF = 4′-HF =6-HF (0 nmol per min per mg of protein). At 10μM and 35μM, the rank order of glucuronidation was approximately the same, and the glucuronidation rates were mostly the same as well.
For UGT1A8, at 2.5μM, glucuronidation rates difference between various HFs were large since some was not metabolized at all. The rank order was 3-HF (2.19 ± 0.27 nmol per min per mg of protein, the fastest), followed by 2′-HF (1.18±0.26), 6-HF (0.87±0.12), 5-HF (0.28±0.04), 3′-HF (0.27 ±0.02), 7-HF (0.23±0.03), and 4-HF(0.00±0.00). At 10μM, the rank order in the middle changed and the magnitude of the difference also increased. At 35μM, there was an even bigger difference between the slowest and the fastest glucuronidation rates, which were also accompanied by a big change in the middle of the rank order.
For UGT1A9, at 2.5 μM substrate concentration, 3-HF was still glucuronidated at the fastest rate (3.03±0.04 nmol per min per mg of protein), followed by 7-HF (1.30±0.09), 3′-HF (0.48±0.13), 2′-HF (0.43±0.06), 5-HF (0.29±0.01), and 6-HF(0.10±0.00), whereas metabolism of 4′-HF was not detectable. At 10μM substrate concentrations, the rank order did not change much. At 35 μM, 4′-HF still showed no detectable metabolism, but the compound with the slowest glucuronidation rate changed from 6-HF to 5-HF.
For UGT1A10, there was no detectable metabolism at 2.5 μM due to slow rate of glucuronidation for any of the seven HFs. At 10 μM substrate concentration, the rank order of the UGT1A10-mediated glucuronidation rates (nmol per min per mg of protein) was 3-HF (1.37±0.19) > 3′-HF (0.86±0.08) > 6-HF (0.62±0.07) > 4′-HF (0.30±0.05) > 7-HF (0.17±0.03) > 5-HF (0.12±0.01) > 2′-HF (0.09±0.01). At 35 μM, the rank order in the middle changed somewhat but the maximum and minimum were maintained.
For UGT2B7, only glucuronidation of 3-HF and 5-HF were measurable at all three tested concentrations (2.5μM, 10μM and 35μM). The glucuronidation rates of 3-HF were always much higher than 5-HF, which were 1.39±0.14, 5.35±0.91 and 2.19±0.07 (nmol per min per mg of protein) compare to 0.20±0.01, 0.40±0.02 and 0.11±0.00 (nmol per min per mg of protein, p<0.05) at 2.5μM, 10μM and 35μM, respectively. This isoform did not metabolize other five HFs.
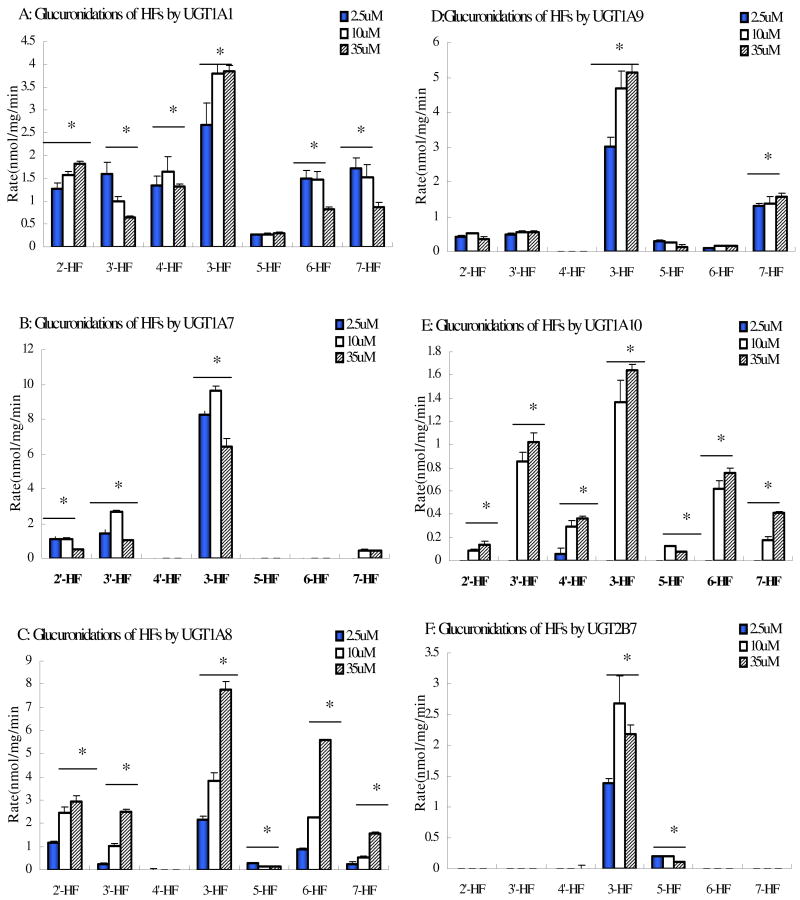
Concentration-dependent glucuronidation of seven hydroxyflavones by expressed human UGT1A1, UGT1A7, UGT1A8, UGT1A9, UGT1A10 and UGT2B7
To highlight the importance of concentration on the metabolism of 7 HFs by six UGT isoforms, the data from the previous 4 HFs were re-plotted together with glucuronidation rates of 3 additional HFs to first show the effects of concentration change on the rates of metabolism for each flavone (Fig. 7). It was shown that most glucuronidation rates increased with an increase in concentration but a few did not change or even decreased as the concentration increased.
Fig.7. Impact of Structural Changes on Flavone Glucuronidation by Six Major UGT Isoforms.
Experiments were conducted at three concentrations as designated previously in Fig.6. Each column represents the average of three determinations and the error bar represents the standard deviation of the mean. Significant differences at each concentration by each UGT were found among the seven HFs (p<0.05, One-way ANOVA, marked by *).
Glucuronidation of HFs by Human Liver Microsomes
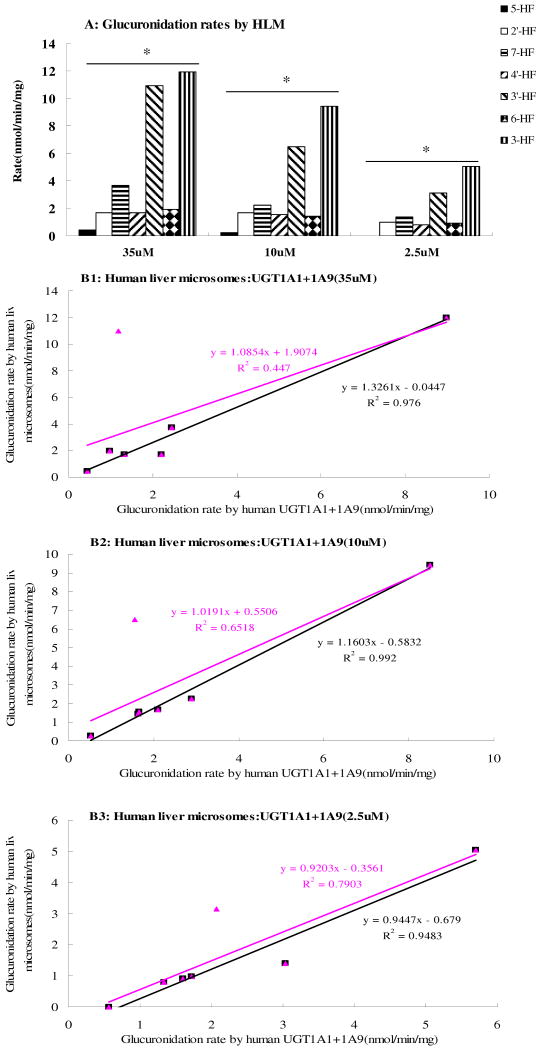
The rates of glucuronidation of the selected hydroxyflavones by human liver microsomes were determined at three concentrations of 2.5μM, 10μM and 35μM (Fig.8A). The results of this study showed that the rate of glucuronidation of 3-HF was always the fastest of all hydroxyflavones at all of the three substrate concentrations, while 5-HF was glucuronidated the slowest by human liver microsomes, which were consistent with the UGT isoform data.
Fig.8. Glucuronidation of Seven HFs by Pooled Human Liver Microsomes (Fig.8A) and Correlation Between Glucuronidation Rates Derived from UGT Isoforms and Those from Human Liver Microsomes at Concentrations of 35 μM (Fig.8 B1), 10 μM (Fig.8 B2) or 2.5 μM (Fig.8 B3).
Three different concentrations (2.5, 12.5 and 35 μM) of substrates were used to determine the rates of metabolism. In Fig.8A, each column represents the average of three determinations and the error bar represents the standard deviation of the mean. Significant differences at each concentration by each UGT were found among the seven hydroxyflavones (p<0.05, One-way ANOVA, marked by *). In Fig.8B1∼B3, the glucuronidation rates by human liver microsomes (X-axis) was plotted against expressed UGT isoform (UGT1A1+UGT1A9) rates. The linear regression was used to derive the apparent correlation coefficient. The blank lines are the ones with all seven hydroxyflavones, whereas the pink lines are the one without 3′-hydroxyflavone.
At 2.5μM substrate concentration, the rank order of the glucuronidation rates (nmol per min per mg of protein) was 3-HF (5.04±0.48) > 3′-HF (3.14±0.01) > 7-HF (1.39±0.01) > 2′-HF (0.97±0.03) > 6-HF (0.91±0.04) > 4′-HF (0.80±0.05) > 5-HF (0.00±0.00). At 10μM substrate concentration, the rank order in the middle changed and the same order was observed at 35μM substrate concentration.
The results clearly indicated that at different concentrations, there were significant differences in the glucuronidation of the seven hydroxyflavones by human liver microsomes (p<0.05, one way ANOVA) (Fig. 8A). In addition, the effects of concentration also showed the trend as we observed in UGT isoforms that glucuronidation rates increased with concentrations.
Lastly, we plotted rates of glucuronidation by liver microsomes against rates of glucuronidation by UGT1A1 and UGT1A9. UGT1A1 and UGT1A10 were chosen for the plot because they are known to be expressed at high level in human livere20 and these two isoforms also metabolized most if not all seven flavones albeit at different rates (Fig.6 and Fig.7). In contrast, UGT1A7, 1A8 and 1A10 are poorly expressed in human liver, and UGT2B7 only prefers 3-HF. The results indicated that isoform-specific metabolism rates correlated well with liver microsome metabolism rates at each of the three tested concentrations with the exception of 3′-HF (Fig.8 B1∼B3). The slopes of all three correlative curves were close to 1.
Hydroxyflavone Glucuronidation by Human Intestinal Microsomes
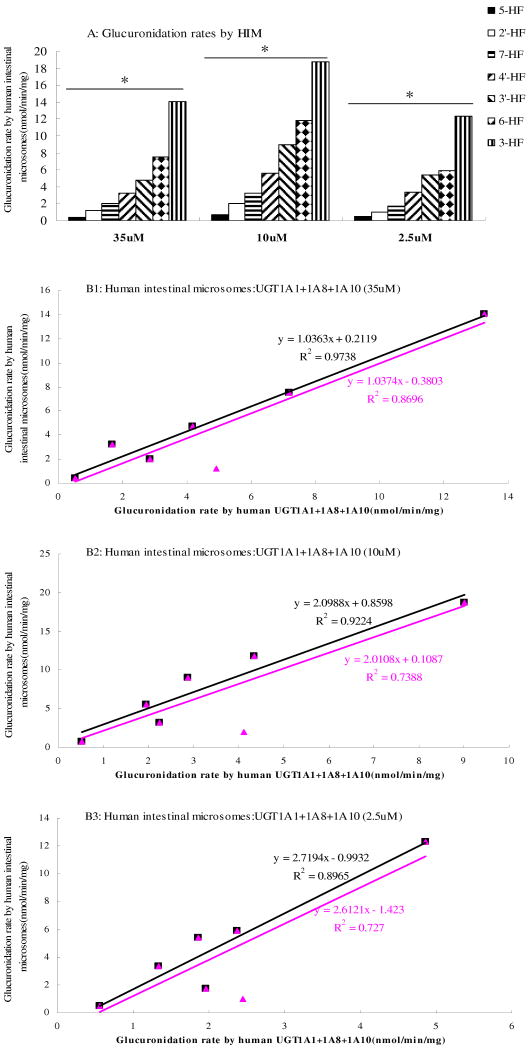
When compared to glucuronidation by human liver microsomes, human intestinal microsomes usually metabolized the hydroxyflavones much faster in a per mg microsomal protein basis (Fig.9A). The HF-specific profiles look like a “right-triangle” at all three concentrations, which is different from the HF glucuronidation profile in human liver microsomes.
Fig.9. Glucuronidation of Seven HFs by Pooled Human Intestinal Microsomes (Fig.9A) and Correlation Between Glucuronidation Rates Derived from UGT Isoforms and Those from Human Intestinal Microsomes at Concentrations of 35 μM (Fig.9B1), 10 μM (Fig.9B2) or 2.5 μM (Fig.9B3).
In Fig.9A, each column represents the average of three determinations and the error bar represents the standard deviation of the mean. Significant differences at each concentration by each UGT were found among the seven HFs (p<0.05, One-way ANOVA, marked by *). In Fig.9B1∼B3, the glucuronidation rates by human intestinal microsomes (X-axis) was plotted against expressed UGT isoform (UGT1A1+UGT1A8+UGT1A10) rates. The linear regression was used to derive the apparent correlation coefficient. The blank lines are the ones with all seven hydroxyflavones, whereas the pink lines are the one without 2′-hydroxyflavone.
At all three substrate concentrations (2.5μM, 10μM and 35μM), when metabolism rates of seven hydroxyflavones in intestine were compared, we found that 3-HF were always metabolized the fastest (12∼18 nmol per min per mg of protein), followed by 3-HF, 6-HF, 3′-HF, 4′-HF, 7-HF, 2′-HF and 5-HF. At 2.5 μM substrate concentration, the magnitude of the difference was 25 folds (12.35±1.32 vs. 0.49±0.06), and this magnitude of difference was essentially maintained at all three concentrations (Fig.9A).
To determine the level of correlation, intestinal glucuronidation rates were plotted against the rates of metabolism via UGT1A1+UGT1A8+UGT1A10 at three different concentrations (Fig.9B1∼B3). UGT1A1, UGT1A8 and UGT1A10 were chosen for the plot because they are known to be expressed at high level in human intestine20 and these three isoforms also metabolized most if not all seven flavones albeit at different rates (Fig.6 and Fig.7). In contrast, UGT1A7 and 1A9 are poorly expressed in human intestine, and UGT2B7 only prefers 3-HF. The results of correlation analysis indicated that the slope is shown to be highly variable, and only slope at 35μM was close to 1, whereas the slopes at the other two lower concentrations were much bigger (2 and above).
Isoform-Specific Glucuronidation of 3 diHF's at 3 Concentrations
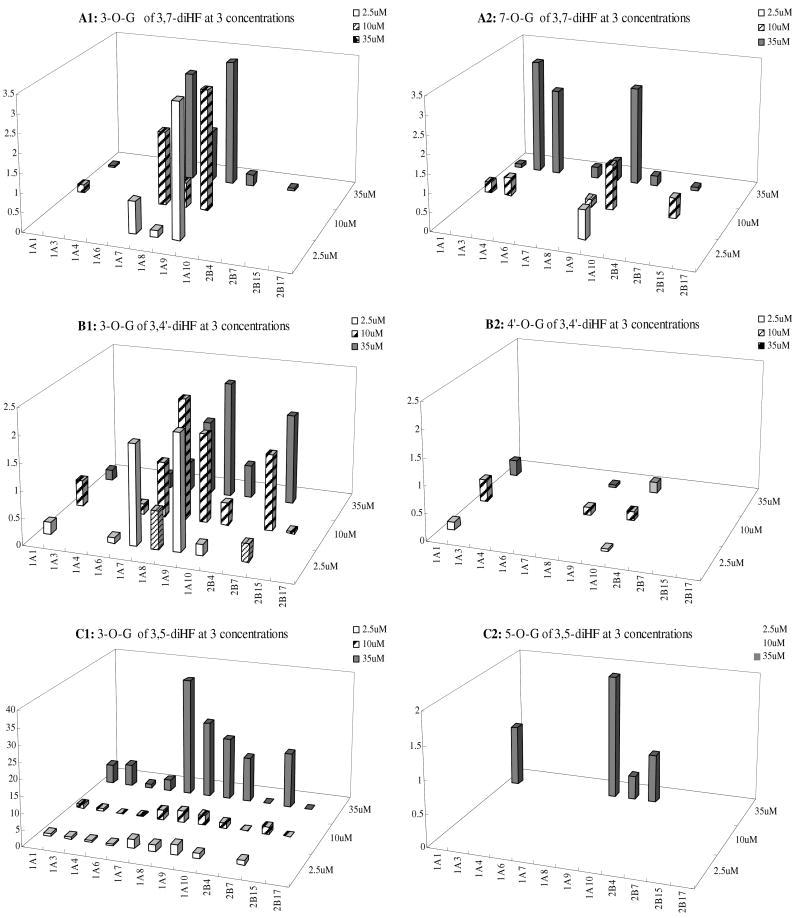
The selected diHFs (3,4′-HF, 3, 5-HF and 3, 7-HF) were incubated at three concentrations (2.5, 10, 35μM) with 12 human UGT isoforms. The formation rates of two mono-glucuronides at three concentrations were quantified (Figure 10). First of all, the formation rates of 3-O-G glucuronide was almost always higher than formation rates at other −OH position for all three tested concentrations, but there were occasional exceptions. For example, UGT1A3 and UGT1A4 were shown unexpectedly to form 7-O-glucuronide rapidly, which occurred at 10 and 35 μM. For all three HFs, the fingerprints for different phenolic positions of the flavones were always different from each other. Moreover, more isoforms appeared to become active when an extra −OH group was added to the main backbone, regardless whether the −OH group being glucuronidated is at the 3-OH or other position. A detailed description for each diHF followed.
Fig.10. Glucuronidation of 3, 7-diHF, 3, 5-diHF and 3, 4′-diHF by 12 Human UGTs.
Experiments were conducted at three concentrations (2.5, 10, and 35μM). Glucuronidation of 3,7-diHF and 3′4′-diHF produced either one or two mono-glucuronide (M1 and M2) depending on which UGT was used. Glucuronidation of 3, 5-diHF only produced one metabolite at 2.5 and 10μM, and two metabolites at 35μM. The experiments were conducted at 37 °C for 1 (or 0.5) hr and the amounts of glucuronides formed were measured using UPLC. Rates of glucuronidation were calculated as nmol/min/mg of protein. Each bar is the average of three determinations, and the error bars are the standard deviations of the mean (n=3).
For 3,7-diHF, its isoform fingerprint at 7-OH position was maintained at three concentrations but its isoform-specific fingerprint at 3-OH position was suddenly changed at 35μM (Fig.10A), when two additional isoforms unexpectedly became active. This effect was observed in two independent experiments done at different time.
For 3,4′-diHF, the isoform-specific fingerprints were usually the same across three concentrations for each glucuronidation position (Fig.10B). Hence, metabolism at 3-OH position of the diHF followed similar trend as did the metabolism at the 4′-OH position.
For 3,5-diHF, metabolism at the 3-OH position dominated and isoform-specific fingerprint were similar for all three concentrations although the rates at 35 μM were unexpected high (rate increased exceeded proportional increases in concentrations) (Fig.10C). Metabolism at the 5-OH position was not measurable at most instances, except at 35 μM.
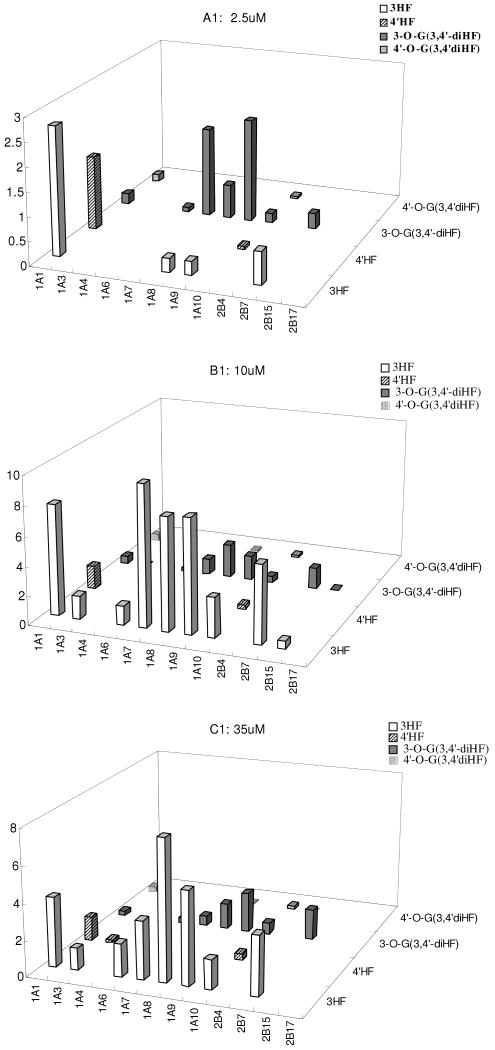
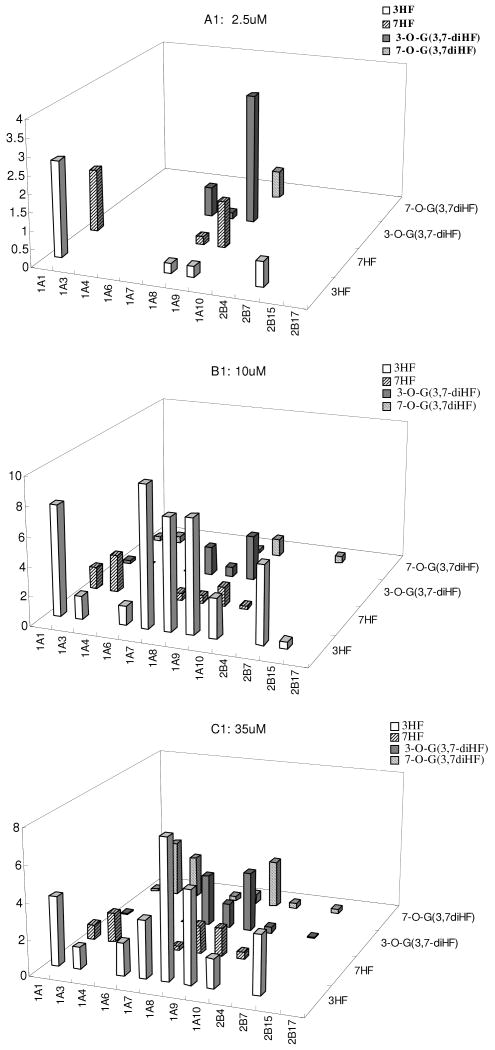
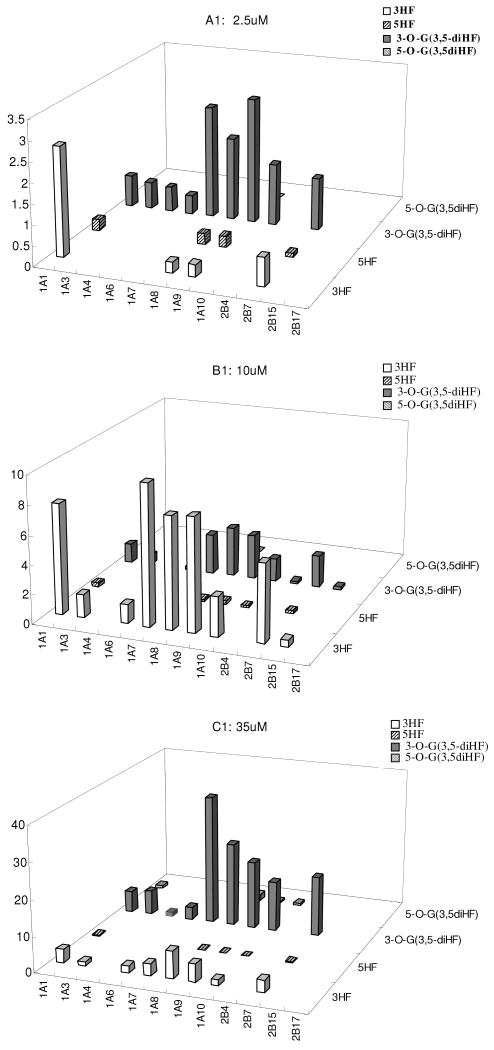
To more clearly display how position of phenolic group in a simple mono-hydroxyflavone may be used to predict the glucuronidation of a flavone with two phenolic groups, we re-plotted data shown in Fig.5 and Fig.10 to make Fig.11. The re-plotted data were used to demonstrate how metabolic fingerprint discovered using simple HFs may be used to predict the glucuronidation behaviors of more complex flavones. The results showed that almost all the patterns were predictable qualitatively. However, additional isoform became active in metabolizing diHFs when compared to those that metabolized HFs.
Fig.11. Comparison of Isoform-Specific Fingerprints of diHFs with Those of HFs.
The fingerprints of glucuronide formation of 3-O-glucuronide from 3-HF (labeled as 3-HF), 7-O-glucuronide from 7-HF (labeled as 7-HF), 3-O-glucuronide from 3,7-diHF (labeled as 3-O-G(3,7-diHF)), and 7-O-glucuronide from 3,7-diHF (labeled as 7-O-G (3,7-diHF)) were shown in Figure.11A. Similarly, those for the fingerprints of glucuronide formation of 3-HF, 4′-HF, 3-O-G derived from 3,4′-diHF, and 4′-O-G derived from 3,4′-diHF were shown in Figure. 11B, and those for 3-HF, 5-HF, 3-O-G derived from 3, 5-diHF, and 5-O-G derived from 3, 5-diHF were shown in Figure.11C.
Discussion
Our results clearly shown that there is an isoform-specific glucuronidation fingerprint for each of the tested HFs (Fig.5) and diHFs (Fig.10). Additionally, simpler (i.e., six-isoform) fingerprints of HFs, with exception of 3′-HF, may be used to predict their metabolic rates in human intestinal and liver microsomes (Fig.9, Fig.10). Both of these conclusions are novel for flavones, although our earlier investigation of isoflavone metabolism using the same approach but with 12 isoforms also showed good correlation between rates predicted based on glucuronidation fingerprints of isoflavones and their organ-specific glucuronidation rates in human intestinal and liver microsomes 13. Therefore, this present study demonstrated once again the value of isoform-specific fingerprinting in predicting the organ-specific glucuronidation rates of flavonoids. Since expressed UGT isoforms are widely available commercially, our approach may be used broadly to predict metabolism of a particular flavonoid or drug at a target organ, assuming the UGT expression level is known via quantitative RT-PCR. However, further refinement of our approach is needed in at least two areas: incorporation of additional UGT isoform including the newly cloned UGT3A family 21 and quantitation of UGT isoform levels of the target tissues using a proteomic approach 22 since isoform-specific UGT antibodies are generally unavailable and quantitative-PCR do not directly measure the protein expression level.
Our approach of using UGT isoform fingerprint to predict metabolism of flavonoids in a target organs/tissues is rather novel although other research groups have successfully predicted organ-specific metabolism of flavonoids using microsomes made from the same organ 11,23-25. Our approach is probably more labor intensive as more studies have to be run to cover the number of isoforms included and three different substrate concentrations. The three substrate concentrations are often necessary since fingerprint of any of the six flavones could change with concentration, especially in the case of UGT1A8, UGT1A10 and UGT2B7 (Fig.6-7). However, our approach should have greater utility since this fingerprint can be used to predict metabolism of flavonoids in organs whose microsomes are not readily available. This is highly valuable since it would be possible to use this approach to predict the metabolism of flavonoids at other organs, especially the target organs of flavonoids' actions. Future investigation of this potential utility will be warranted to validate this hypothesis.
In addition to the utilities of UGT fingerprinting as discussed previously, our data showed that the fingerprints obtained from using HFs were useful for describing the fingerprints of more complex diHFs. As shown in Fig.11, the fingerprint of more slowly metabolized phenolic group in a diHF was always more similar to that of the more slowly metabolized HF than the more rapidly metabolized HF. However, addition of an additional phenolic group, which makes the overall flavone structure more electron rich, generally resulted in the participation of additional UGT isoforms, or higher rates of metabolism or both.
By using the structural-specific metabolic profiles (Figure 6, 7), the structure-activity relationship (SAR) for selected HFs may be elucidated. Since all HFs share the same structural backbone, the SAR studies mainly examined how changes in the position of hydroxyl group (the site of glucuronidation) affected its glucuronidation by UGT1A1, 1A7, 1A8, 1A9, 1A10 and 2B7. These six UGT isoforms appeared to be the most important expressed human UGT isoforms for metabolism of flavones (Fig.5 and Fig.10) and isoflavones 13. Our analysis indicated that UGT2B7 only glucuronidated hydroxyflavones with 3-hydroxyl or 5-hydroxyl groups. Therefore, 3-HF, 5-HF, 3,4′-diHF, 3,5- diHF and 3,7-diHF, which has 3- or 5-hydroxyl group, were its substrates, and flavones without the 5-hydroxyl group were not. Additionally, the glucuronidation of 3-HF was always the fastest and that of 5-HF was always among the bottom two among the six chosen UGTs (Figure 7). We believed that the slow or lack of metabolism of 5-HF is due to the position of its phenolic group, which favors the formation of an intra-molecular hydrogen bond with the carbonyl group at C-4 position. C-4 carbonyl group may also represent a significant steric hindrance for glucuronidation reaction at the 5-phenolic group.
It was shown earlier that investigation into glucuronidation of HFs allowed us to project glucuronidation of di-HF to certain degrees. However, application of this approach to more complex flavones was not done here. An analysis of the literatures suggested that 3-OH group appeared to be the most reactive group even in the more complex flavones with more than 2 phenolic groups. For example, after oral administration of quercetin and kaempferol, quercetin-3-glucuronide and kaempferol-3-glucuronide were found to be the major glucuronides in human plasma 26,27, suggesting that our approach of using simple HFs to predict the metabolic patterns has significant potentials, although additional studies are needed to better define the algorithm necessary for a more accurate and quantitative prediction.
In conclusion, we demonstrated for the first time that the glucuronidation of seven HFs were UGT isoform- and concentration- dependent and significantly impacted by the position of the phenolic group. We also showed for the first time that glucuronidation fingerprints of more complex flavones (e.g., diHFs) could be reasonably predicted by the structurally simpler flavones (e.g., HFs). In addition, it was shown again that glucuronidation fingerprint of seven selected HFs could be used to predict the glucuronidation rates in both human liver and intestinal microsomes. We believe that the approach developed here may be of general values in the prediction of glucuronidation of drugs and phenolic compounds in specific organs and tissues. Further studies are needed to refine the prediction processes, by defining the levels of UGT isoforms in a particular organ and by modeling the interactions between UGTs and their substrates.
Acknowledgments
Work is supported in part by The National Institutes of Health grant GM-70737 to MH and in part by Key Project of the Ministry of Science and Technology of China (No.2006BAI11B0804) and the Key Project of National Natural Science Foundation of China (No.U0832002) to ZL. LT spent time doing experiments in both US and China for the duration of the described research.
Abbreviations
- 3-HF
3-hydroxyflavone
- 5-HF
5-hydroxyflavone
- 6-HF
6-hydroxyflavone
- 7-HF
7-hydroxyflavone
- 2′-HF
2′-hydroxyflavone
- 3′-HF
3′-hydroxyflavone
- 4′-HF
4′-hydroxyflavone
- 3, 7-diHF
3,7-dihydroxyflavone
- 3, 5-diHF
3,5-dihydroxyflavone
- 3, 4′-diHF
3,4′-dihydroxyflavone
- HBSS
Hank's balanced salt solution
- UGT
UDP-glucuronosyltransferase
- UDPGA
uridine diphosphoglucuronic acid
- UPLC
ultra performance liquid chromatography
- SAR
structure-activity relationship
References
- 1.Thomasset SC, Berry DP, Garcea G, Marczylo T, Steward WP, Gescher AJ. Dietary polyphenolic phytochemicals--promising cancer chemopreventive agents in humans? A review of their clinical properties. Int J Cancer. 2007;120:451–8. doi: 10.1002/ijc.22419. [DOI] [PubMed] [Google Scholar]
- 2.Benavente-Garcia O, Castillo J. Update on uses and properties of citrus flavonoids: new findings in anticancer, cardiovascular, and anti-inflammatory activity. J Agric Food Chem. 2008;56:6185–205. doi: 10.1021/jf8006568. [DOI] [PubMed] [Google Scholar]
- 3.Wang X, Morris ME. Pharmacokinetics and bioavailability of the flavonoid 7,8-benzoflavone in rats. J Pharm Sci. 2008;97:4546–56. doi: 10.1002/jps.21296. [DOI] [PubMed] [Google Scholar]
- 4.Walle T, Otake Y, Brubaker JA, Walle UK, Halushka PV. Disposition and metabolism of the flavonoid chrysin in normal volunteers. Br J Clin Pharmacol. 2001;51:143–6. doi: 10.1111/j.1365-2125.2001.01317.x. [DOI] [PMC free article] [PubMed] [Google Scholar]
- 5.Liu X, Tam VH, Hu M. Disposition of flavonoids via enteric recycling: determination of the UDP-glucuronosyltransferase isoforms responsible for the metabolism of flavonoids in intact Caco-2 TC7 cells using siRNA. Mol Pharm. 2007;4:873–82. doi: 10.1021/mp0601190. [DOI] [PMC free article] [PubMed] [Google Scholar]
- 6.Boutin JA, Meunier F, Lambert PH, Hennig P, Bertin D, Serkiz B, Volland JP. In vivo and in vitro glucuronidation of the flavonoid diosmetin in rats. Drug Metab Dispos. 1993;21:1157–66. [PubMed] [Google Scholar]
- 7.Ross JA, Kasum CM. Dietary flavonoids: bioavailability, metabolic effects, and safety. Annu Rev Nutr. 2002;22:19–34. doi: 10.1146/annurev.nutr.22.111401.144957. [DOI] [PubMed] [Google Scholar]
- 8.de Vries JH, Hollman PC, Meyboom S, Buysman MN, Zock PL, van Staveren WA, Katan MB. Plasma concentrations and urinary excretion of the antioxidant flavonols quercetin and kaempferol as biomarkers for dietary intake. Am J Clin Nutr. 1998;68:60–5. doi: 10.1093/ajcn/68.1.60. [DOI] [PubMed] [Google Scholar]
- 9.Moon JH, Nakata R, Oshima S, Inakuma T, Terao J. Accumulation of quercetin conjugates in blood plasma after the short-term ingestion of onion by women. Am J Physiol Regul Integr Comp Physiol. 2000;279:R461–7. doi: 10.1152/ajpregu.2000.279.2.R461. [DOI] [PubMed] [Google Scholar]
- 10.Liu Y, Dai Y, Xun L, Hu M. Enteric disposition and recycling of flavonoids and ginkgo flavonoids. J Altern Complement Med. 2003;9:631–40. doi: 10.1089/107555303322524481. [DOI] [PubMed] [Google Scholar]
- 11.Wong YC, Zhang L, Lin G, Zuo Z. Intestinal first-pass glucuronidation activities of selected dihydroxyflavones. Int J Pharm. 2009;366:14–20. doi: 10.1016/j.ijpharm.2008.08.035. [DOI] [PubMed] [Google Scholar]
- 12.Zhang L, Lin G, Zuo Z. Position preference on glucuronidation of mono-hydroxylflavones in human intestine. Life Sci. 2006;78:2772–80. doi: 10.1016/j.lfs.2005.10.038. [DOI] [PubMed] [Google Scholar]
- 13.Tang L, Singh R, Liu Z, Hu M. Structure and Concentration Changes Affect Characterization of UGT Isoform-Specific Metabolism of Isoflavones. Mol Pharm. 2009 doi: 10.1021/mp8002557. [DOI] [PMC free article] [PubMed] [Google Scholar]
- 14.Lee HS, Ji HY, Park EJ, Kim SY. In vitro metabolism of eupatilin by multiple cytochrome P450 and UDP-glucuronosyltransferase enzymes. Xenobiotica. 2007;37:803–17. doi: 10.1080/00498250701534877. [DOI] [PubMed] [Google Scholar]
- 15.Joseph TB, Wang SW, Liu X, Kulkarni KH, Wang J, Xu H, Hu M. Disposition of flavonoids via enteric recycling: enzyme stability affects characterization of prunetin glucuronidation across species, organs, and UGT isoforms. Mol Pharm. 2007;4:883–94. doi: 10.1021/mp700135a. [DOI] [PMC free article] [PubMed] [Google Scholar]
- 16.Liu Y, Hu M. Absorption and metabolism of flavonoids in the caco-2 cell culture model and a perused rat intestinal model. Drug Metab Dispos. 2002;30:370–7. doi: 10.1124/dmd.30.4.370. [DOI] [PubMed] [Google Scholar]
- 17.Hu M, Chen J, Tran D, Zhu Y, Leonardo G. The Caco-2 cell monolayers as an intestinal metabolism model: metabolism of dipeptide Phe-Pro. J Drug Target. 1994;2:79–89. doi: 10.3109/10611869409015895. [DOI] [PubMed] [Google Scholar]
- 18.Wang SW, Chen J, Jia X, Tam VH, Hu M. Disposition of flavonoids via enteric recycling: structural effects and lack of correlations between in vitro and in situ metabolic properties. Drug Metab Dispos. 2006;34:1837–48. doi: 10.1124/dmd.106.009910. [DOI] [PubMed] [Google Scholar]
- 19.Gibson DT, Hensley M, Yoshioka H, Mabry TJ. Formation of (+)-cis-2,3-dihydroxy-1-methylcyclohexa-4,6-diene from toluene by Pseudomonas putida. Biochemistry. 1970;9:1626–30. doi: 10.1021/bi00809a023. [DOI] [PubMed] [Google Scholar]
- 20.Ohno S, Nakajin S. Determination of mRNA expression of human UDP-glucuronosyltransferases and application for localization in various human tissues by realtime reverse transcriptase-polymerase chain reaction. Drug Metab Dispos. 2009;37:32–40. doi: 10.1124/dmd.108.023598. [DOI] [PubMed] [Google Scholar]
- 21.Mackenzie PI, Rogers A, Treloar J, Jorgensen BR, Miners JO, Meech R. Identification of UDP glycosyltransferase 3A1 as a UDP N-acetylglucosaminyltransferase. J Biol Chem. 2008 doi: 10.1074/jbc.M807961200. [DOI] [PMC free article] [PubMed] [Google Scholar]
- 22.Fallon JK, Harbourt DE, Maleki SH, Kessler FK, Ritter JK, Smith PC. Absolute quantification of human uridine-diphosphate glucuronosyl transferase (UGT) enzyme isoforms 1A1 and 1A6 by tandem LC-MS. Drug Metab Lett. 2008;2:210–22. doi: 10.2174/187231208785425764. [DOI] [PubMed] [Google Scholar]
- 23.Zhang L, Zuo Z, Lin G. Intestinal and hepatic glucuronidation of flavonoids. Mol Pharm. 2007;4:833–45. doi: 10.1021/mp700077z. [DOI] [PubMed] [Google Scholar]
- 24.Zhang L, Lin G, Zuo Z. Involvement of UDP-glucuronosyltransferases in the extensive liver and intestinal first-pass metabolism of flavonoid baicalein. Pharm Res. 2007;24:81–9. doi: 10.1007/s11095-006-9126-y. [DOI] [PubMed] [Google Scholar]
- 25.Boersma MG, van der Woude H, Bogaards J, Boeren S, Vervoort J, Cnubben NH, van Iersel ML, van Bladeren PJ, Rietjens IM. Regioselectivity of phase II metabolism of luteolin and quercetin by UDP-glucuronosyl transferases. Chem Res Toxicol. 2002;15:662–70. doi: 10.1021/tx0101705. [DOI] [PubMed] [Google Scholar]
- 26.Day AJ, Mellon F, Barron D, Sarrazin G, Morgan MR, Williamson G. Human metabolism of dietary flavonoids: identification of plasma metabolites of quercetin. Free Radic Res. 2001;35:941–52. doi: 10.1080/10715760100301441. [DOI] [PubMed] [Google Scholar]
- 27.de Pascual-Teresa S, Johnston KL, DuPont MS, O'Leary KA, Needs PW, Morgan LM, Clifford MN, Bao Y, Williamson G. Quercetin metabolites downregulate cyclooxygenase-2 transcription in human lymphocytes ex vivo but not in vivo. J Nutr. 2004;134:552–7. doi: 10.1093/jn/134.3.552. [DOI] [PubMed] [Google Scholar]


