Abstract
Objective
Increases in accumulated energy on intracranial EEG are associated with oncoming seizures in retrospective studies, supporting the idea that seizures are generated over time. Published seizure prediction methods require comparison to ‘baseline’ data, sleep staging, and selecting seizures that are not clustered closely in time. In this study, we attempt to remove these constraints by using a continuously adapting energy threshold, and to identify stereotyped energy variations through the seizure cycle (inter-, pre-, post- and ictal periods).
Methods
Accumulated energy was approximated by using moving averages of signal energy, computed for window lengths of 1 and 20 min, and an adaptive decision threshold. Predictions occurred when energy within the shorter running window exceeded the decision threshold.
Results
Predictions for time horizons of less than 3 h did not achieve statistical significance in the data sets analyzed that had an average inter-seizure interval ranging from 2.9 to 8.6 h. 51.6% of seizures across all patients exhibited stereotyped pre-ictal energy bursting and quiet periods.
Conclusions
Accumulating energy alone is not sufficient for predicting seizures using a 20 min running baseline for comparison. Stereotyped energy patterns through the seizure cycle may provide clues to mechanisms underlying seizure generation.
Significance
Energy-based seizure prediction will require fusion of multiple complimentary features and perhaps longer running averages to compensate for post-ictal and sleep-induced energy changes.
Keywords: Intracranial EEG energy, Interictal and ictal energy, Seizure prediction, Accumulated energy, Average inter-seizure interval
1. Introduction
Computerized analysis of pre-ictal intracranial EEG (IEEG) demonstrates increasing energy as seizures approach, compared to ‘baseline’ epochs randomly chosen from periods greater than 4 h from seizures (Esteller et al., 1999; Esteller 2000; Litt et al., 2001). These findings are based upon energy profiles computed from intracranial electrodes implanted near epileptic foci in patients undergoing evaluation for epilepsy surgery. Because energy changes in the IEEG are also affected by state of awareness, seizures and the post-ictal period, studies utilizing this measure for seizure prediction have been applied only under constrained experimental design. These studies require comparison to ‘baseline’ epochs of EEG more than 4 h removed from the start or end of any seizure; a time period found to allow apparent resolution of post-ictal energy elevations in study patients. They also require knowing the state of awareness of patients, so that seizures and baselines from the same state (sleep vs. awake) are compared, and that seizures are not clustered closely together in time. IEEG signal energy is useful for tracking seizure generation because it is sensitive to waveforms such as subclinical seizure-like bursts (‘chirps’), slowing, and bursts of complex interictal epileptiform activity. Changes in these IEEG waveforms, which are commonly recognized by clinical epileptologists, have been associated with oncoming seizures (Litt et al., 2001). In addition, energy-based measures are computationally efficient, easy to relate to raw data, and are easily implemented in implantable devices.
Important limitations of previously published energy-based methods for seizure prediction are that they are dependent upon selection of randomly chosen baseline data segments, and that they are by definition retrospective, and cannot be directly applied in a causal, real-time system. This is because the times of seizure onset must be known in advance, in order to derive the starting point of energy accumulation. Because data sets submitted for the First International Seizure Prediction Workshop contained frequent seizure clusters, and no sleep staging data were available for analysis, previously described prediction methods based upon signal energy could not be employed. We used this collaborative meeting as an opportunity to address these limitations and begin development of a causal energy-based method for seizure prediction.
We first focused on eliminating the need to know seizure onset times. Since the accumulated energy in a sliding observation window is the sum of all previous energies calculated in that window, the accumulated energy is proportional to the running average of the energy. Therefore by tracking the moving average of IEEG signal energy it might be possible to predict seizures in a causal, online fashion, without knowing seizure onset times in advance. For this reason, the online prediction method presented below is based upon long and short-term moving averages. A second challenge is to adjust the energy threshold used to detect seizures ‘locally’ in time, in order to adjust for the effect of energy changes due to changes in level of consciousness (e.g. increased energy during sleep) and seizure clusters. One approach is to compute a second feature that tracks sleep–wake cycles and post-ictal changes. Research in this area is currently under way in our group, but methods for accomplishing this were not available at the time of the Bonn workshop (Betterton et al., 2003). Potential features for tracking sleep state on the IEEG include Teager’s energy, which preferentially weights high-frequency activity greater than delta power (Zaveri et al., 2001), or to subtract log delta power from the signal (Malow et al., 1998). Though Gotman et al. found accumulated energy to predict seizures in approximately one third of cases, in the absence of sleep staging, this performance is inadequate for practical use (Gotman, 2001). In this study, we rely on a continuously adapting energy threshold obtained from a 20 min running window in order to partially compensate for confounding energy changes associated with state of awareness, and ictal and post-ictal energy changes. Though flawed in its exact implementation, because changes in ‘baseline’ energy may take place over periods that are longer or shorter than 20 min, this is a first approximation to develop a causal method for seizure prediction based upon IEEG energy.
2. Methods
2.1. Data and pre-processing
The intracranial EEG data used in this study included a total of 60 seizures (42 clinical events and 18 subclinical) corresponding to 4 patients (patients B, C, D, and E) from the University of Bonn, the University of Florida, the University of Kansas, and the University of Pennsylvania, respectively. Clinical details regarding each of these patients are available in accompanying summary paper in this issue by Lehnertz and Litt (Lehnertz and Litt, 2005). For this analysis the electrode contact in which seizure onset on IEEG was first visible, or maximal if it occurred in more than one channel simultaneously, was used in a bipolar montage, subtracting the signal from an adjacent electrode. IEEG data were converted to Matlab format for processing.
2.2. Feature generation and data training
Signal energy was computed in two different sliding windows. The sliding windows were right aligned in time, so that the 1 and 20 min observation windows ended at the same time point. Since the displacement used for both windows was 30 s and both ended at the same time point, then time alignment was preserved among energy feature values generated from each sliding window. Evidently, the resulting feature resolution was Tsf = 30 s. The number of samples within each window varied according to the data-sampling rate of each patient as specified in the accompanying summary paper in this issue (Lehnertz and Litt, 2005). The running average energy is determined as follows,
| (1) |
where N1 is the number of samples in the observation window (whose duration is either 1 or 20 min, depending upon which average is being calculated); D is the window shifting (30 s); x is the EEG data; i is an integer indicating the data time index and n is the feature time index. The energy obtained using the shorter window size is denoted as short-term energy (STE), and the one determined with the longer window size is referred to as long-term energy (LTE). The decision threshold used in this study is determined by adding an adaptive threshold component and a fixed offset component (decision threshold=adaptive threshold+fixed offset). The LTE is used as the adaptive threshold. A prediction was declared every time the STE exceeded the decision threshold, that was defined by the inequality,
| (2) |
The offset term in the inequality is a fixed value, specific to each patient, determined retrospectively by assessing prediction occurrences for coarse variations of the offset in a training data set starting at the beginning of the test data through the second recorded seizure. The offset value was chosen after a coarse tuning to yield sensitivity greater than 50% and false positive rate (FPR) lower or equal than 0.2 FP/h (false positives per hour) in the selected data segments. This offset value varies from patient to patient and is meant to adjust for signal differences due to recording from different brain regions (e.g. deep structures vs. neocortex), variations in the recording system (e.g. electrode impedance), different epilepsy etiologies, and other sources of inter-patient variation. Equally important, the offset value was chosen to tune the decision threshold such that sensitivity and FPR were within acceptable performance ranges for the training set, in order to demonstrate feasibility of a seizure prediction system for the test data. The procedure described, where the offset is determined to fit this performance target through a heuristic methodology, corresponds to a training stage, which precedes testing on the rest of the experimental data set (testing stage). Table 1 indicates the data segments used for training from each patient, their length in hours, and the sensitivity and FPR obtained for each data set. Consecutive predictions separated by less than 3.5 min were considered to be a single prediction.
Table 1.
Training sets fulfilling criteria and their performance for fixed offsets selected
| Patient | Data segment | Hours used for training | TPs out of total CSz | FPs | FPh | Total data hours available |
|---|---|---|---|---|---|---|
| B | 6th–9th file segments | 9.0 | 2/2 | 5 | 0.208 | 111.5 |
| C | 1st part of unique file segment | 10.5 | 1/2 | 0 | 0 | 62.5 |
| D | 2nd–3rd file segments | 10.0 | 2/2 | 2 | 0.2 | 50.01 |
| E | 3rd–4th file segments | 9.5 | 2/2 | 1 | 0.105 | 69.78 |
| Totals | 39.0 h. | 7/8 | 8 | 0.205 | 293.79 |
In addition to developing a causal energy-based method for predicting seizures, a second goal of this study was to investigate potentially repeatable energy changes over the seizure cycle. Patients B, D, and E had the focus data stored on several CDs, while patient C had some of the channels for the full hospitalization stored on a single CD. For this reason, the STE and LTE were generated for each CD data segment on patients B, D, and E, and as a single data segment for patient C.
2.3. Performance evaluation
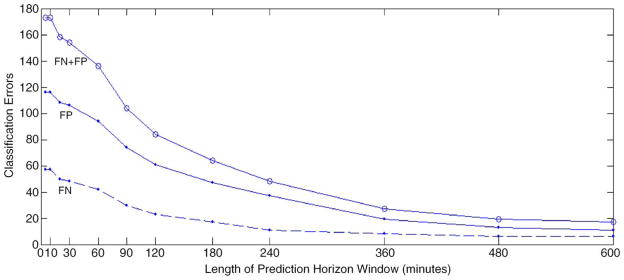
Results are assessed for 12 different prediction horizons ranging from 5 to 600 min (Fig. 1) (Echauz et al., 2000). A positive prediction indicates that the short-term energy crossed the long-term energy-based decision threshold at least one time within the interval of a prediction horizon. These suprathreshold outputs are then categorized as either true positives (TPs) or false positives (FPs) based upon whether or not a seizure occurred within that prediction horizon after the prediction was made [10]. The range of prediction horizons was chosen based upon a review of the literature, ranging from 5 min to a maximum of 3 h (Iasemidis et al., 2003; Litt and Echauz, 2002). Positive predictions that occurred during seizures were not considered FPs, because the algorithm considers seizure detection to be a special case of seizure prediction where the prediction horizon is zero, and in addition, ictal EEG corresponds to a different brain situation from our target states that were interictal and pre-ictal EEG. Multiple positive predictions within the prediction horizon window are considered to be a single prediction, and the prediction time is taken to be the earliest of all positive predictions within the sliding window. As noted above, two positive predictions separated by less than 3.5 min are considered to be a single positive.
Fig. 1.
Classification errors as a function of the prediction horizon window size.
3. Results
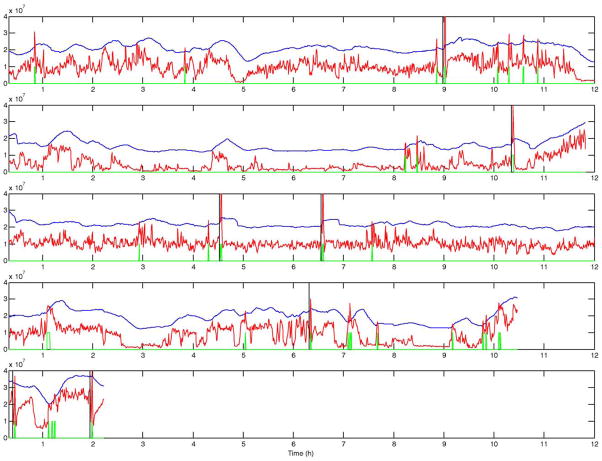
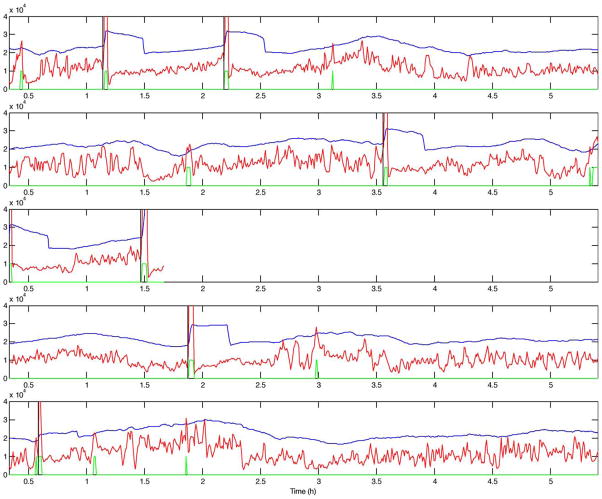
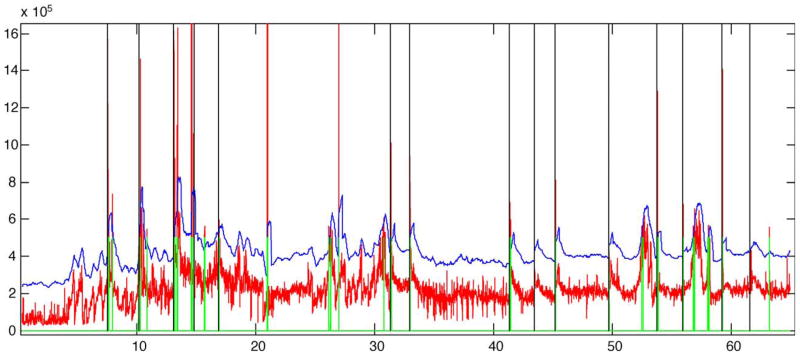
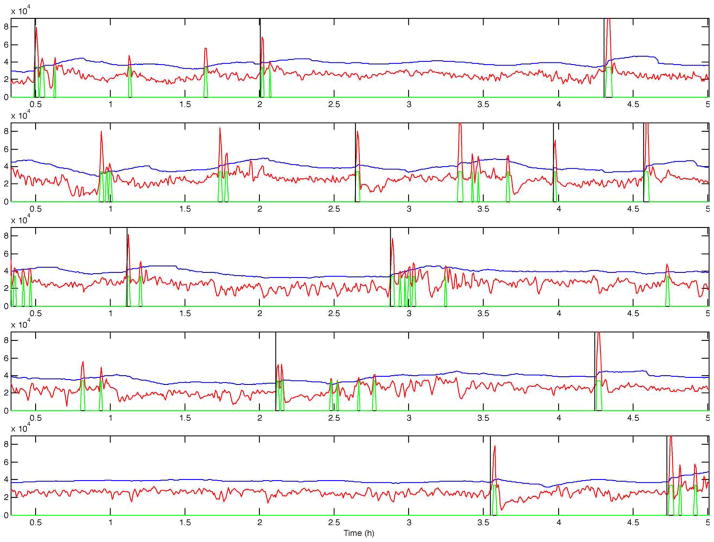
Figs. 2–5 present the short-term energy (STE), the decision threshold (LTE+offset), and the prediction output for patients B, C, D, and E. These figures are presented in accordance with one goal of the workshop, to present raw algorithm outputs in addition to performance statistics, when summarizing performance. These figures indicate that while energy increases are common prior to seizure onset, the proposed energy-based ratio is not particularly useful for seizure prediction because of increases in energy that occur apparently unrelated to seizure onsets. In addition, a number of seizures were not clearly preceded by increases in relative signal energy. Close analysis suggests that the method is more sensitive to large energy bursts generated post-ictally during seizure clusters than to subtler rises in energy as seizures approach. To quantify prediction performance for this method, we analyzed results for 12 prediction horizons, ranging from 5 min to 10 h. There was no statistically significant results for prediction horizons of under 3 h, a prediction horizon approaching the inter-seizure period for several of the test patients. The statistically significant result for the 3 h prediction horizon, detailed in Table 2, is likely no better than random, given the high frequency of seizures over a relatively short time in the data shared for this workshop. Of interest, inspection of all false negative predictions revealed that 53% of these events (9 out of 17 FNs for this time horizon), clustered ≤2.6 h from the nearest seizure, implying that the long term moving average of energy did not compensate well for increased energy post-ictally in clustered seizures. Also of interest, review of raw algorithm output supports the necessity for showing these results in addition to performance statistics, as visual review of these outputs makes the relatively poor performance of the algorithm clearer.
Fig. 2.
STE (red), decision threshold (blue), prediction output (green), and seizure onset (black vertical line) for 5 records from patient B. Positive outputs (high level in green curve) are observed as far as almost 2 h before all seizures. Note that the there is no positive output between the clustered seizures on the third display.
Fig. 5.
STE (red), decision threshold (blue), prediction output (green), and seizure onset (black vertical line) for 5 records from patient E. Positive outputs (high level in green curve) are observed as far as almost 2 h before all seizures except for the one on the fourth display. This seizure happens to be a follower seizure. Note that the seizure in the third display around 1.5 h into the record is a follower seizure as well.
Table 2.
Performance evaluation
| Patient | TPs out of total CSz+SCSz | TPs out of total CSz | TPs out of total SCSz | FPs | FPh | FNs for Szs ≤2.62 h from previous Sz | Avg. predict. time (h) | Total hours |
|---|---|---|---|---|---|---|---|---|
| B | 10/13 | 9/10 | 1/3 | 12 | 0.1076 | 1/3 | −1.715 | 111.5 |
| C | 8/15 | 8/15 | – | 4 | 0.064 | 4/7 | −1.597 | 62.5 |
| D | 15/17 | 5/6 | 10/11 | 5 | 0.0999 | 1/2 | −1.622 | 50.01 |
| E | 10/15 | 8/11 | 2/4 | 11 | 0.1576 | 3/5 | −0.758 | 69.78 |
| Totals (Sensitivity) | 43/60 (71.6%) | 30/42 (71.4%) | 13/18 (72.2%) | 32 | 0.1089 | 9/17 | −1.423 | 293.79 |
Prediction horizon window=3 h→TPs are those positives at most 3 h before seizure onset.
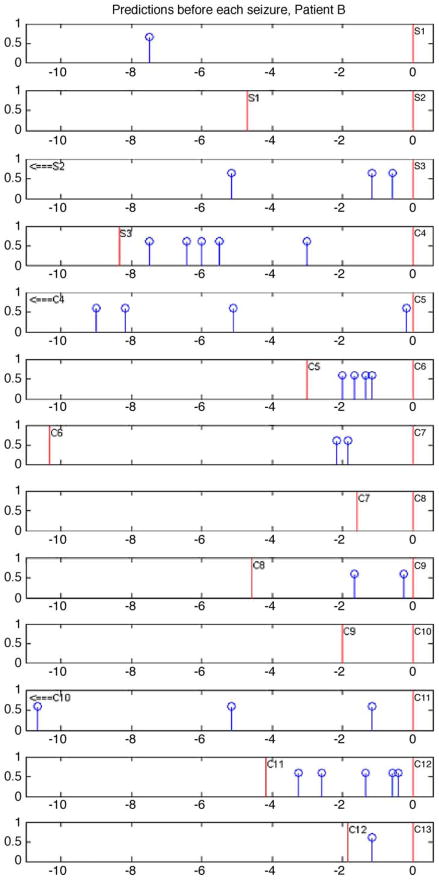
Fig. 6 demonstrates a method for visualizing predictions related to seizures. A total of 13 seizures are indicated in this figure. Note that in this figure, 3 seizures were not predicted when considering a 3 h prediction horizon. Two of these, are subclinical (S1 and S2) and only one is clinical (C8). Interestingly, the non-predicted clinical seizure also happens to be a ‘follower,’ that is, it is clustered with another seizure event with less than 3 h between them. While 90% of clinical seizures were anticipated for this patient using a 3 h prediction horizon, a quick glance at the figure demonstrates that this performance is not likely clinically significant since performance declines below statistical significance, when shorter prediction horizons are used. Compilation of similar figures for the other study patients yielded analogous results.
Fig. 6.
Method for visualizing predictions related to seizures. In this case, preceding positive algorithm outputs and the preceding seizure are indicated before each of the seizures from patient B. Red vertical lines indicate seizures and blue vertical lines with a topped circle indicate positive outputs. Each seizure is labeled with a letter and number where: ‘C’ represents a clinical seizure, and ‘S’ a subclinical seizure and numbers indicate the chronological order of seizures. Positive outputs are plotted for every seizure. Note that consecutive panels correspond to consecutive seizures and the zero reference of the time axis is positioned at the seizure whose pre-ictal positive predictions are being visualized on the panel plot. Seizure onsets are indicated by time= zero. Positive outputs are indicated only up to a maximum of 11 h before the seizure onset or until the preceding seizure is found, whichever comes first when going backwards in time.
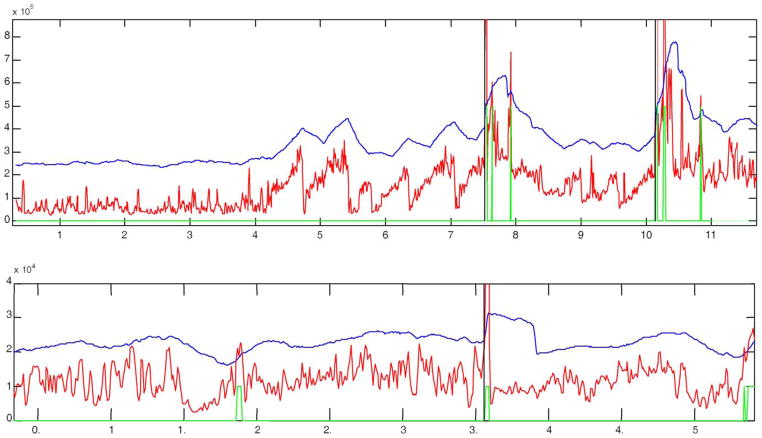
Figs. 7–9 present the STE, the decision threshold based on the LTE, and prediction algorithm output. It is important to note that stereotypical pre-ictal patterns of increasing energy were found in 31 out of 60 seizures (51.6%) among study patients. Three main patterns were observed: (1) one or more bursts of energy leading to a seizure (Fig. 6); (2) spikes in signal energy before the seizure (Fig. 7); and (3) energy bursts followed by a quiet period before the seizure. The first two types of energy build-up (Figs. 7 and 8) occurred before 22 seizures and the pattern characterized by a quiet period before the ictal event precedes 9 seizures. An example can be observed in Fig. 9.
Fig. 7.
Examples of pre-ictal energy bursts build-up patterns. Top panel is a clip from patient C and bottom panel is a clip from patient E. Note how in the top panel the energy builds up and then suddenly decreases 5 times before it finally evolves into a seizure. In the bottom display the energy is initially high, reaching higher peaks over time and then suddenly decreasing around 1.6 h, and start to build up again with some drops before it evolves into a seizure around 3.6 h from the beginning of this record.
Fig. 9.
Example of energy build-up with quiet period before seizure. Clip from patient B. Note the initial energy bursting with a sustained decrease before the seizure, reaching minimum energy level around 20 min before the onset almost at the grid tick before the seizure.
Fig. 8.
Example of energy spike build-up pattern from patient D. This is a clip which shows a clear spike build up pattern before the actual seizure. Note that at time 0.7 h into the record the energy drops (similarly to the drops observed around 1.6 h in the bottom display of Fig. 8 and around 5.5 h and other times in the top display of this figure.
4. Discussion
We present a method for prospective, energy-based seizure prediction that attempts to eliminate confounding energy changes due to seizure clustering and fluctuations in state of consciousness using two moving averages of energy and an adaptable decision threshold. While the method produces some interesting results, suggesting reproducible patterns of energy change in the IEEG surrounding seizures across patients, this method does not appear to be well suited for practical implementation in its current form, particularly on data sets containing a large concentration of seizures spaced ≤9 h apart. Problems seen in initial studies demonstrating pre-ictal energy changes, such as the need to know the patient’s state of consciousness, and the confounding nature of clustered seizures, were not eliminated by the current approach. This does not invalidate energy derived from the IEEG as an important feature for tracking seizure generation. Rather, it reinforces the need for multiple complementary features fused together to track this complicated process until better, more mechanistically specific quantitative measures can be found. Together with measures that follow state of consciousness and post-ictal changes, this method may have considerable utility in tracking the development of oncoming ictal events in the epileptic network. More important, energy-based methods may provide important clues to mechanisms underlying seizure generation that are better followed by more specific event detection, such as counting chirps, changes in the high-frequency firing patterns of unit ensembles in specific cortical regions or subcortical structures, or perhaps in protein synthesis or signaling within specific regions. The types of analysis and data sharing presented in this first collaborative workshop are vital first steps in making these future, more useful methods a reality.
There are other interesting results in this study. Results in Table 2 indicate that there were no differences in algorithm sensitivity with respect to whether or not seizures were clinical or subclinical. This strengthens one conclusion from the Bonn workshop, that the EEG should be used as the standard for determining what a seizure is, not as clinical symptoms (see summary paper by Lehnertz and Litt). Another important finding, is the relationship between prediction horizon and prediction algorithm performance. While it is obvious that as prediction horizon increases and approaches the inter-seizure interval, performance will dramatically improve, though not in a statistically valid way. As indicated previously during the workshop (Frei, 2002), 100% sensitivity and 100% specificity can always be accomplished when considering seizure prediction by selecting a prediction horizon as long as needed. How to best select the size of the prediction horizon window is a central challenge for seizure prediction analysis. A key clinical boundary to guide the selection of the prediction horizon window length is the reciprocal of the seizure frequency, or average time between seizures. Prediction horizons comparable or longer than the average inter-seizure interval do not provide additional information that can be used to warn the patient or trigger a therapy, and are not likely to be practically useful. How much smaller than the average inter-seizure interval will depend on the time required by any responsive therapy to exert its action, or the warning time required for a patient to take action to prevent injury. Of course, clinical utility of these methods is a central goal of this research, and this utility will likely depend upon what is done with predictive information, and the nature of warning or intervention given to patients. While warnings alone may be useful hours in advance, provided the false positive rate is low, more acute interventions, such as focal brain stimulation, may be much more useful on scales of minutes. Again, there are many factors that need to be considered when choosing a prediction horizon for a particular application.
Inter-seizure intervals during pre-surgical evaluation are generally shorter than under normal conditions, as tapering of antiepileptic drugs, sleep deprivation and other factors may contribute to increase seizure frequency. Averaged inter-seizure intervals for patients B, C, D, and E were 8.58, 4.17, 2.94, and 4.65 h, respectively. As a consequence, a high incidence of clustered seizures occurring no more than 2.6 h after the preceding seizure was observed, yielding 15.4, 53.3, 64.7, and 60% in patients B, C, D, and E, respectively. The 3 patients with smaller inter-seizure intervals logically had the 3 highest rates of seizure clusters. Clustered seizures may obscure the natural behavior of the energy tool used in this study, and may yield to misleading FN rates, due to non-detected clustered ictal events. Patients D and E had the highest rate of clustered seizures and coincidentally exhibited the higher number of subclinical seizures as well (11 and 4, respectively). The fact that the prediction algorithm evaluated seems to have a satisfactory performance (according to Table 2) is not considered statistically convincing because the inter-seizure interval of the data sets analyzed is comparable. However, it would be interesting to research with implantable neurostimulators algorithms like the one proposed here without the restrictions imposed by a time-limited hospitalization evaluation, and in epileptic patients subject to real-life situations with inter-seizure intervals greater or equal to 1 day.
The pre-ictal patterns of energy variation prior to seizure onset are interesting, but of unclear significance. Bursting of energy leading up to seizures has been described previously, but its underlying mechanism(s) is unknown. Both excitatory and inhibitory significance have been attributed to these patterns, as well as analogies drawn to critical systems that dissipate energy in events according to a power law distribution, in an attempt to maintain stability on the way to catastrophic events such as avalanches, earthquakes or volcanic eruptions (Worrell et al., 2002). Quiet periods leading up to seizures after impressive bursting are even more puzzling. Recent work suggests that such periods close to neocortical onset seizures may actually represent fast activity outside of the bandwidth of IEEG signals traditionally recorded in clinical systems (Worrell et al., 2004). Whatever the cause, the number of seizures and patients in this very limited study who share these patterns suggest that there are likely mechanisms common to seizure generation in all patients with partial epilepsy that might be explored with quantitative measures and exploited for new therapeutic interventions. More in-depth recordings of this type, perhaps with arrays of electrodes placed throughout the epileptic network in animal models, may yield important clues as to how these changes are involved in the generation of individual seizures.
The contribution of the present study to the Bonn workshop is not so much to document the performance of a specific method, but rather to demonstrate some of the problems that are encountered in attempting online seizure prediction, the need for a patient-specific, multi-feature approach for tracking seizure generation, and some commonality in patterns of energy evolution through the seizure cycle. Seizure prediction methods, even with their current performance limitations, could play an important role in the future of brain stimulation. When considering that the false positive predictions obtained with our method correspond to abnormal epileptiform activity, electrical stimulation of these false positive predictions is not unreasonable to consider. We are hopeful that when the next International Collaborative Workshop on Seizure Prediction is held, that we will have learned a great deal more about seizure generation through similar attempts at new methods, and that we will be able to, incrementally if necessary, demonstrate more success and applications for these methods.
Fig. 3.
STE (red), decision threshold (blue), prediction output (green), and seizure onsets (black vertical lines) for patient C. All these patient seizures are clinical and most of them have high-energy activity prior to seizure onset.
Fig. 4.
STE (red), decision threshold (blue), prediction output (green), and seizure onset (black vertical line) for 5 records from patient D. Positive outputs (high level in green curve) are observed as far as almost 3 h before all seizures, except for the last two seizures at the bottom display.
Acknowledgments
This research has been funded by The Whitaker Foundation, The Esther and Joseph Klingenstein Foundation, The Dana Foundation, The American Epilepsy Society, The CURE Foundation, the Partnership for Pediatric Epilepsy and through a grant from the National Institutes of Health, Grant # RO1NS041811-01.
References
- Betterton P, D’Alessandro M, Vachtsevanos G, Litt B. Determining state of consciousness from the intracranial electroencephalogram (IEEG) for seizure prediction. 22nd IASTED International Conference on Modeling, Identification and Control (MIC 2003); Innsbruck, Austria. 2003. [Google Scholar]
- Esteller R. PhD dissertation. Georgia Institute of Technology; 2000. Detection of Seizure Onset in Epileptic Patients from Intracranial EEG Signals. [Google Scholar]
- Esteller R, Echauz J, Vachtsevanos G, Litt B. Accumulated energy is a state-dependent predictor of seizures in mesial temporal lobe epilepsy [abstract] Epilepsia. 1999;40(suppl 7):173. [Google Scholar]
- Echauz J, Esteller R, Litt B, Vachtsevanos G. Unified probabilistic framework for predicting and detecting seizure onsets in the brain and multitherapeutic device. 09/693,423. US patent application no. 2000 Oct 20;
- Frei M. Personal communication. First International Collaborative Workshop on Seizure Prediction; Bonn. April 2002. [Google Scholar]
- Gotman J. Personal communication. Dec, 2001.
- Iasemidis LD, Shiau DS, Chaovalitwongse W, Sackellares JC, Pardalos PM, Principe JC, Carney PR, Prasad A, Veeramani B, Tsakalis K. Adaptive epileptic seizure prediction system. IEEE Trans Biomed Eng. 2003;50(5):616–27. doi: 10.1109/TBME.2003.810689. [DOI] [PubMed] [Google Scholar]
- Lehnertz K, Litt B. The First International Collaborative Workshop on Seizure Prediction: summary and data description. Clin Neurophysiol. 2005;116:493–505. doi: 10.1016/j.clinph.2004.08.020. [DOI] [PubMed] [Google Scholar]
- Litt B, Echauz J. Prediction of epileptic seizures. Lancet Neurol. 2002;1(1):22–30. doi: 10.1016/s1474-4422(02)00003-0. [DOI] [PubMed] [Google Scholar]
- Litt B, Esteller R, Echauz J, D’Alessandro M, Shor R, Henry T, Pennell P, Epstein C, Bakay R, Dichter M, Vachtsevanos G. Epileptic seizures may begin hours in advance of clinical onset: a report of five patients. Neuron. 2001;30:51–64. doi: 10.1016/s0896-6273(01)00262-8. [DOI] [PubMed] [Google Scholar]
- Malow BA, Lin X, Kushwaha R, Aldrich MS. Interictal spiking increases with sleep depth in temporal lobe epilepsy. Epilepsia. 1998;39(12):1309–16. doi: 10.1111/j.1528-1157.1998.tb01329.x. [DOI] [PubMed] [Google Scholar]
- Worrell G, Cranstoun S, Echauz J, Litt B. Evidence for self-organized criticality in human epileptic hippocampus. NeuroReport. 2002;13(16):2017–21. doi: 10.1097/00001756-200211150-00005. [DOI] [PubMed] [Google Scholar]
- Worrell G, Parish L, Cranstoun S, Jonas R, Baltuch G, Litt B. High frequency oscillations and seizure generation in neocortical epilepsy. Brain. 2004;127:1496–506. doi: 10.1093/brain/awh149. [DOI] [PubMed] [Google Scholar]
- Zaveri H, Duckrow R, Spencer S. The signal energy of seizures [abstract] Epilepsia. 2001;42(suppl 7):42. [Google Scholar]


