Abstract
The purposes of this study were to investigate how efflux transporters and UDP-glucuronosyltransferases (UGT) affect the disposition of naringenin. A rat intestinal perfusion model with bile duct cannulation was used along with rat intestinal and liver microsomes. In the intestinal perfusion model, both absorption and subsequent excretion of naringenin metabolites were rapid and site-dependent (p < 0.05). Naringenin was absorbed the most in colon and its glucuronides were excreted the most in duodenum. In metabolism studies, the intrinsic clearance value of naringenin glucuronidation was the highest in jejunum microsomes, followed by liver, ileal and colonic microsomes. The rapid metabolism in microsomes did not always translate into more efficient excretion in the rat perfusion model, however, because of presence of rate-limiting efflux transporters. When used separately, MK-571 (an inhibitor of multidrug resistance-related protein 2 or Mrp2) or dipyridamole (an inhibitor of breast cancer resistance protein or Bcrp1) did not affect excretion of naringenin glucuronides, but when used together, they significantly (p < 0.05) decreased intestinal and biliary excretion of naringenin glucuronides. In conclusion, efflux transporters Mrp2 and Bcrp1 are shown to compensate for each other and enable the intestinal excretion of flavonoid (i.e., naringenin) glucuronides.
Keywords: Naringenin, flavonoids, intestine, disposition, metabolism, efflux, transporter
Introduction
Naringenin (Figure 1), a flavanone found in citrus fruits, has been shown to possess antioxidant, anti-inflammatory, and anticarcinogenic activities, and to lower blood lipid and cholesterol.1-5 Flavanones, structurally similar to flavones (apigenin), are a subclass of flavonoids. Flavonoids, due to their potentially beneficial effects in hormone-dependent cancer, aging-related disorders as well as cardiovascular diseases, have been gathering increasing interests in clinical nutrition and disease prevention.6,7
Figure 1.
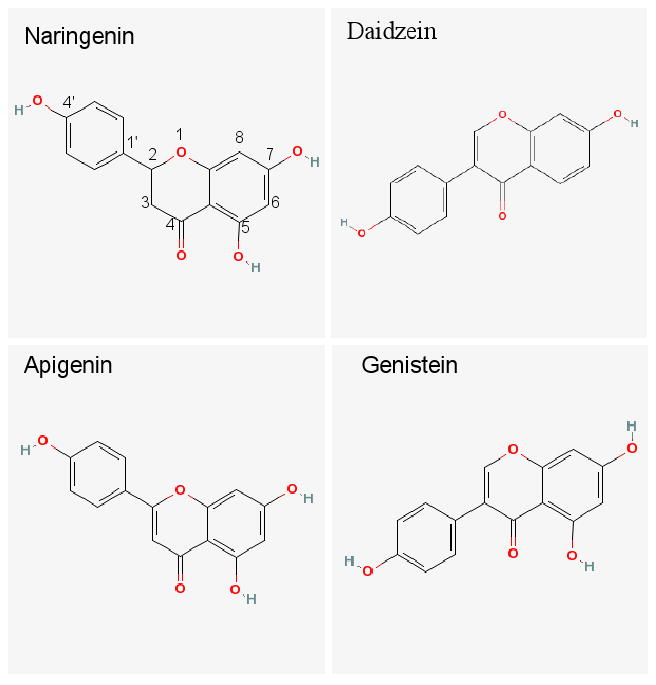
The chemical structures of naringenin, daidzein (internal standard), and two of its closely related structural analogs, genistein and apigenin.
It is well-known that flavonoids have poor bioavailability (less than 5%) in rodents and humans.8-12 Therefore, despite reports of strong anticancer activities in vitro with IC50 values in micromolar range,7,13,14 the in vivo concentrations achieved for flavonoids are usually in nM range because of their poor bioavailabilities.10,15,16 This significant gap between in vitro effective concentration and actual in vivo exposure makes it a significant challenge to develop flavonoids as chemotherapeutic or chemopreventive agents.
Our previous studies of the absorption mechanism and metabolic pathways of flavones (e.g., apigenin) and isoflavonoids (e.g., genistein) were designed to improve our understanding of the mechanism responsible for the poor bioavailability of the whole family of flavonoids.17-23 Initially, we showed that the poor bioavailabilities of flavonoids (i.e., aglycones) were not the results of poor absorption but of the extensive first-pass metabolism via phase II conjugation that produces glucuronides and sulfates. The cellular excretion of flavonoid glucuronides and sulfates requires the action of efflux transporters since these conjugates are too hydrophilic to penetrate the cell membrane. Subsequently, we attributed repeated shuffling of flavonoids through a dual recycling scheme involving both enteric and enterohepatic recycling as the reason for extensive metabolism of flavonoids.17,18,21 This metabolic mechanism is consistent with results of studies from many independent groups of investigators.24-27
In the present study, we investigated the absorption, metabolism and excretion of another subclass of flavonoids, flavanones by using naringenin as the model compound. Flavonone's metabolism in the intestine has not been fully elucidated. We have chosen naringenin as the model flavanone for several reasons. First, this compound has many biological activities and is one of the main flavanones present in the western diet.5,28,29 Second, naringenin is structurally analogous to apigenin and genistein, two compounds we have extensively studied, and therefore giving us an opportunity to compare and contrast the results obtained here with our earlier studies. Third, although it was proposed that the low bioavailability (less than 10%) of naringenin was possibly due to its extensive first-pass metabolism,30 the exact mechanism for its low bioavailability remained unclear. Therefore, the present study aimed to further characterize the poor bioavailability problem of flavonoids, using another flavonoid subclass the flavanones which include naringenin. Here, we determined the absorption of naringenin and the effects of efflux transporters on metabolism and excretion of naringenin metabolites. This study is to continue our effort to understand the importance of efflux transporters in the intestinal disposition of flavonoids.
Materials and Methods
Materials
Naringenin was purchased from Indofine Chemicals (Somerville, NJ). Daidzein were purchased from LC Laboratories (Woburn, MA). MK-571 (sodium salt) was purchased from Cayman Chemicals (Ann Arbor, MI). Dipyridamole, β-glucuronidase, uridine diphosphoglucuronic acid (UDPGA), alamethicin, D-saccharic-1,4-lactone monohydrate, magnesium chloride, and Hanks' balanced salt solution (powder form) were purchased from Sigma-Aldrich (St. Louis, MO). All other materials were analytical grade or better.
Animals
Male Wistar rats (70–110 days old) weighing between 350 and 400 g were obtained from Harlan Laboratory (Indianapolis, Indiana). The rats were fed with Teklad F6 rodent diet (W) from Harlan Laboratories (Madison, WI) for at least 1 week prior to experiments in our animal facility. The rats were fasted overnight before the day of the experiment.
Rat Intestinal Surgery
The rat intestinal surgical procedures were approved by University of Houston Institutional Animal Use and Care Committee. We perfused four segments (duodenum, jejunum, ileum and colon) of the intestine simultaneously (four-site intestinal perfusion model) and added a bile duct cannulation, which is essentially the same as those described previously.18
Transport and Metabolism Experiments in the Perfused Rat Intestinal Models
A single-pass perfusion method described previously was used here.18 In brief, four segments of the rat intestine (duodenum, upper jejunum, terminal ileum, and colon) were perfused simultaneously with Hanks' balanced salt solution (HBSS, pH 7.4) containing 10 μM naringenin with or without 50 μM MK-571 (Mrp2 inhibitor) and/or 40 μM dipyridamole (Bcrp1 inhibitor) in the perfusate using an infusion pump (Harvard Apparatus, Cambridge, MA) at a flow rate of 0.191 ml/min. After a 30-min washout period, which is usually sufficient to achieve steady-state absorption, intestinal perfusate samples were collected from the outlet cannulae every 30 min (approximately 5.7 ml). Bile samples (approximately 0.5 ml) were collected before perfusion started and every 30 min afterward. After perfusion, the blood sample was collected from tail vein (approximately 0.5 ml) and the length of the intestine was measured as described previously.31,32
Rat Intestinal and Liver Microsome Preparation
Rat intestinal and liver microsomes were prepared from adult Wistar rats using a published procedure18. Prepared microsomes were suspended in 250 mM sucrose solution and stored at -80°C until use. Protein concentrations were determined using a protein assay kit (Bio-Rad, Hercules, CA) using bovine serum albumin as the standard.
Glucuronidation of Naringenin in Rat Intestinal or Liver Microsomes
Glucuronidation of naringenin by microsomes was measured using procedures described previously.18,20 Substrate with or without inhibitors (MK-571 and/or dipyridamole) was mixed with intestinal or liver microsomes (the final protein concentrations were 13 μg/ml for liver and jejunum microsomes, 26 μg/ml for colon microsomes and 52 μg/ml for ileum microsomes), magnesium chloride (0.88 mM), saccharolactone (4.4 mM), and alamethicin (0.022 mg/ml) in 50 mM potassium phosphate buffer (pH 7.4). A solution of 3.5 mM uridine diphosphoglucuronic acid (UDPGA) was added to start the reaction. The total volume was 200 μl. After incubating in a 37°C shaking (200 rpm) water bath for 30 min for liver, jejunum, and colon microsomes and 40 min for ileum microsomes, the reaction was stopped by addition of 50 μl solution of 94% acetonitrile/6% glacial acetic acid containing 50 μM daidzein as the internal standard (IS). Preliminary experiment showed that the reaction rates were linear with changes in protein concentration from 6.5-52 μg/ml at incubation time of 1 h.
Sample Processing
The perfusate and bile samples were processed by adding 50 μl of internal standard (i.e., 50 μM daidzein in 94% acetonitrile/6% glacial acetic acid) to 200 μl of either bile or perfusate samples. After centrifuging the samples at 15,000 rpm for 15 min, 10 μl of the supernatant was used to determine concentrations of naringenin by ultra-performance liquid chromatography-tandem mass spectrometry (UPLC-MS/MS). The concentrations of naringenin glucuronides in luminal perfusate and bile and were determined by UPLC-DAD method. To quantified metabolites, we selectively extracted samples with methylene chloride to remove >90% of aglycone. The resulting sample was then divided into two parts, one of which was analyzed directly and the other analyzed after glucuronidase hydrolysis. The difference in amount of aglycone found in these two samples was the amount of metabolite formed. The relationship between the peak areas of the metabolites before hydrolysis and the peak areas of aglycone after the hydrolysis was used to establish the conversion factor used to quantify the amounts of naringenin glucuronides as described previously.17
Because the concentrations of naringenin glucuronides in blood and microsome reactions (at lower concentrations) were less than the lower limit of quantitation (LLOQ) of UPLC-DAD method, a new UPLC-MS/MS method was developed to analyze the concentrations of naringenin and its glucuronides in blood or microsomal reaction mixtures with low starting substrate concentrations (<1 μM). After incubating 50 μM naringenin with liver microsomes (the final protein concentrations were 52 μg/ml and the final volume is 10 ml) for 24 h as described above, the reaction was stopped by adding 40 ml methylene chloride to remove the aglycone. The aqueous phase was moved to a new tube, and the content was then dried by lyopholization. The residue was subsequently reconstituted in 0.5 ml methanol. After centrifugation at 15,000 rpm for 10 min, the concentration of supernatant was quantified by UV and this concentrated supernatant was used as the standard stock solution of naringenin glucuronides, which was used to prepare the standard curve for quantification of glucuronides in various samples using MS/MS.
The blood samples were processed by protein precipitation with methanol. In brief, 50 μl of 5 μM daidzein (in methanol, IS) and 150 μl of methanol were added into 100 μl of blood sample. After vortexed for 1 min, the mixture was centrifuged at 15,000 rpm for 10 min and the supernatant was moved to a new tube and dried under air. The residue was reconstituted in 100 μl 15% acetonitrile in water, and 10 μl of the aqueous solutions was injected into UPLC-MS/MS. The microsomes samples were processed using the same procedure as the perfusate (described earlier).
UPLC-MS/MS Coupled with DAD Analysis of Naringenin and its Glucuronides
An API 3200 Qtrap triple quadrupole mass spectrometer (Applied Biosystem/MDS SCIEX, Foster City, CA, USA) was operated in negative ion mode. For identification of the glucuronides of naringenin, the main working parameters for the mass spectrometers were set as follows: ionspray voltage, -4.0 kV; ion source temperature, 400°C; the nebulizer gas (gas1), zero air, 40 psi; turbo gas (gas2), zero air, 40 psi; curtain gas, nitrogen, 20 psi. Naringenin phase II metabolites were identified by MS full scan, MS2 full and multi reactions monitoring (MRM) scan modes. The concentrations of naringenin in luminal perfusate, blood and bile samples were determined by MRM method. The main working parameters were set as follows: ionspray voltage, -4.5 kV; ion source temperature, 500°C; gas1, 40 psi; gas2, 60 psi; curtain gas, 20 psi. The quantification was performed using MRM method with the transitions of m/z 271 → m/z 119 for naringenin, m/z 447 → m/z 271 for naringenin glucuronides and m/z 253 → m/z 132 for daidzein (IS).
UPLC conditions for analyzing naringenin and its glucuronides were: system, Waters Acquity™ with diode array detector (DAD); column, Acquity UPLC BEH C18 column (50 × 2.1 mm I.D., 1.7 μm, Waters, Milford, MA, USA); mobile phase A, 2.5 mM ammonium acetate, pH 7.5; mobile phase B, 100% acetonitrile; gradient, 0-2.0 min, 5-25% B, 2.0-3.0 min, 25-45% B, 3.0-3.3 min, 45-5% B, 3.3-3.6 min, 5% B; wavelength, 291 nm for naringenin and 249 nm for daidzein (IS); flow rate, 0.5 ml/min; and injection volume, 10 μl.
The calibration curves were linear over the concentration ranges from 1.25 to 20 μM for naringenin glucuronides by UPLC-DAD, from 9.8 nM to 20 μM for naringenin by UPLC-MS/MS and from 13.1 nM to 6.68 μM for naringenin glucuronides by UPLC-MS/MS. The accuracy for all the method was well within the accepted limit of 15% (in the range of 85 to 115%). The intra-day and inter-day precision for all the methods was below 15%.
Data Analysis
Amounts of naringenin absorbed (Mab), amounts of conjugated naringenin excreted into the intestinal lumen (Mgut), amounts of conjugated naringenin excreted via the bile (Mbile), the percentage absorbed and metabolized values, and the Michaelis-Menten parameters were calculated as described previously.18,23 All parameters in the intestinal perfusion experiments were normalized to 10 cm for comparison purposes.
Briefly, Mab was expressed as:
| Equation (1) |
where Q is the flow rate (ml/min), τ is the sampling interval (30 min), CAin and CAout are the inlet and outlet concentrations (nmol/ml) of aglycones corrected for water flux, L is the actual length of the intestine segment perfused (cm), and 10 is the coefficient used to normalize the intestinal length to 10 cm.
Mgut was expressed as:
| Equation (2) |
where CMout is the outlet concentrations (nmol/ml) of metabolites corrected for water flux.
And, Mbile was expressed as:
| Equation (3) |
where CMbile is the bile concentrations (nmol/ml) of metabolites, and V is the volume of bile collected over a 30 min time period.
%Absorbed and %Metabolized were calculated as:
| Equation (4) |
| Equation (5) |
where Mtotal is the total amount of compound perfused over a 30 min time period.
Unless otherwise indicated, the data for the intestinal absorption and metabolite excretion shown in the paper are expressed as average of 4 experiments, and each experiment has four 30-min samples from 90 to 150 min. The data for the intestinal absorption and metabolite excretion are expressed as nmol/30 min/10 cm.
Rates of metabolism in intestinal or liver microsomes were expressed as amounts of metabolites formed per min per mg protein or nmol/min/mg. If Eadie-Hofstee plot is linear, formation rates (V) of isoflavone glucuronides at various substrate concentrations (C) were fit to the standard Michaelis-Menten equation:
| Equation (6) |
where Km is the Michaelis constant and Vmax is the maximum formation rate.
When Eadie-Hofstee plots showed characteristic profiles of atypical kinetics (autoactivation and biphasic kinetics),33,34 the data from these atypical profiles were fit to equation (7), using the ADAPT II program.35 To determine the best-fit model, the model candidates were discriminated using the Akaike's information criterion (AIC), 36 and the rule of parsimony was applied. Therefore, using this minimum AIC estimation (MAICE), a negative AIC value (i.e. -54.2) would be considered a better representation of the data versus a set of data having a positive AIC value (i.e. 0.83). 37
With regards to microsome data showing autoactivation kinetics, formation rates (V) of isoflavone glucuronides at various substrate concentrations (C) were fit to the following equation:
| Equation (7) |
where
Vmax-0 – intrinsic enzyme activity
Vmax-d – maximum activation of enzyme activity
R – rate of enzyme activity activation
C – concentration of substrate
Km – concentration of substrate to achieve 50% of (Vmax-0 + Vmax-d)
Statistical Analysis
Independent Student's t test and one-way ANOVA with Tukey-Kramer multiple comparison (posthoc) tests (Minitab. Version 14th) were used to evaluate statistical differences. Differences were considered significant when p values were less than 0.05.
Results
Identification of the Phase II Metabolites of Naringenin in Rat Intestinal Perfusate
The perfusion samples collected from different site of intestine were analyzed by UPLC-MS/MS coupled with DAD. Two more peaks which have the similar UV absorption profile in addition to naringenin were detected in the chromatogram of perfusion samples by UPLC-DAD analysis (Figure 2). The retention time of naringenin and daidzein (IS) were 2.7 and 2.3 min, respectively. The peaks at 1.44 and 1.49 min were referred as metabolite M1 and M2, respectively (Figure 2).
Figure 2.
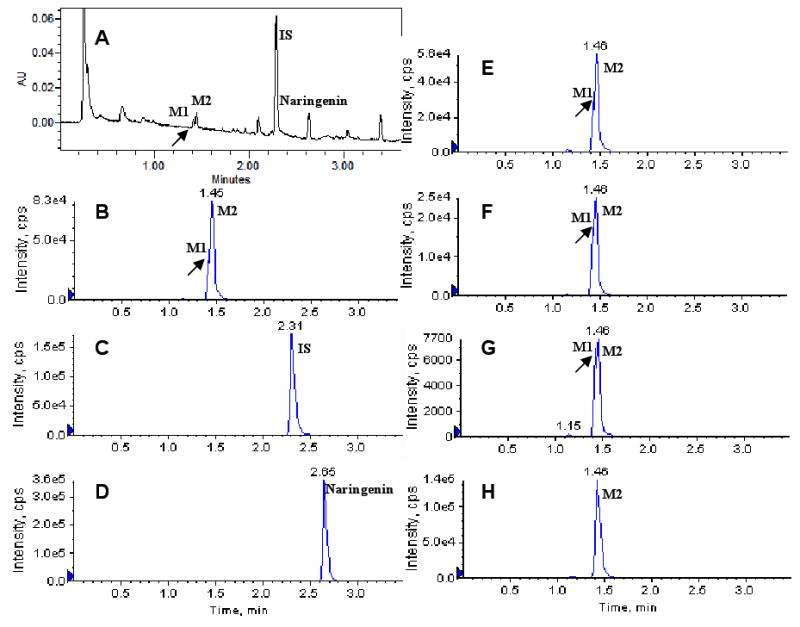
The UV and MRM chromatograms of one rat perfusion samples collected at 150 min after the start of 10 μM naringenin intestinal perfusion. A: UPLC chromatogram; B, C, and D: MRM chromatograms of M1 and M2, internal standard (IS, daidzein) and naringenin in duodenum perfusate; E, F, and G: MRM chromatograms of M1 and M2 in jejunum, ileum, and colon perfusate; H: MRM chromatograms of M2 in bile sample which was diluted 10 times with acetonitrile before analysis. M1 peak in panels B, E and F is signified by the (very) small valley following the initial rise (see arrow), whereas those in panels A and G were clearer. No M1 was detected in H.
These metabolites were then identified by MS. Metabolite M1 and M2 have the same pseudomolecular ion [M-H]- at m/z 447 (Figure 3A), which was 176 Dalton higher (characteristic of the addition of glucuronic acid) than that of naringenin, whose pseudomolecular ion appeared at m/z 271 (Figure 3B). The base peak at m/z 271 in the MS2 spectra of M1 and M2 corresponded to the [M-H]- ion of the aglycone. Based on these data, M1 and M2 were identified as the mono-glucuronides of naringenin. Because we did not observe any additional peak with UPLC-UV method, naringenin sulfates were not found or quantified in the current study.
Figure 3.
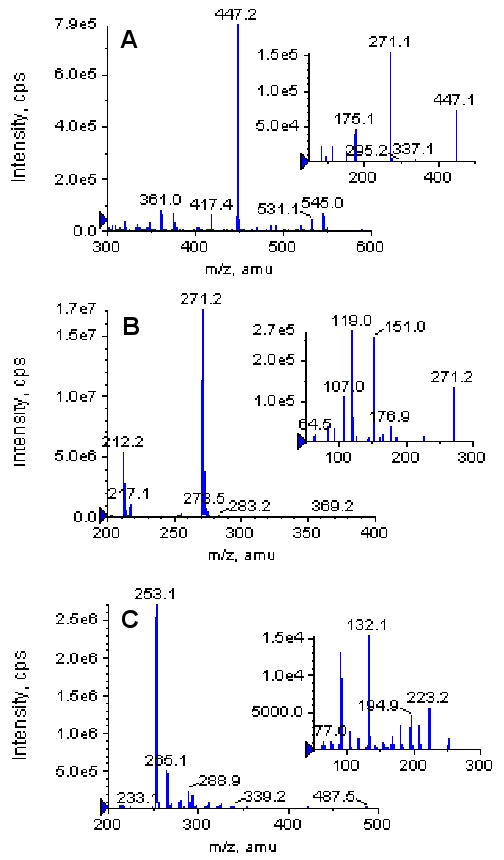
The MS full scan spectra of naringenin glucuronides (M1 and M2, A), naringenin (B) and daidzein (IS, C). The small windows in each panel show the MS2 full scan for respective analytes.
Absorption, Metabolism, and Excretion of Naringenin in the Rat Perfusion Models
To study the disposition of flavanones in intestine and liver, the absorption of naringenin in intestine and the excretion of its glucuronides in intestine and bile were determined using four-site rat perfusion model. The excretion of naringenin glucuronides was expressed as total amounts of M1 and M2 excreted because we lacked M1 and M2 standard.
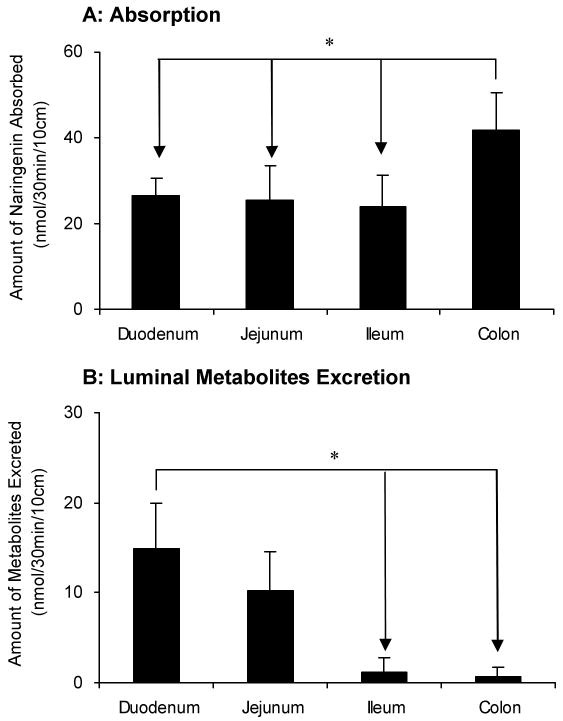
As expected from earlier studies of isoflavonoids and flavones,18,19,21 the disposition of naringenin in different intestinal regions were different (Figure 4). The amounts of naringenin absorbed in colon (68% of perfused amounts or Mtotal) were significantly higher (p < 0.05) than those in other 3 regions of intestine (Figure 4A). There was no difference between the absorption of naringenin in duodenum (47%), jejunum (39%) and terminal ileum (42%). The amounts of naringenin glucuronides excreted from duodenum were clearly higher (p < 0.05) than those from the lower part (ileum and colon) (Figure 4B). The excretion rates of naringenin glucuronides in jejunum were similar to duodenum, but were higher than ileum and colon, although the latter two were nearly the same. The amounts of naringenin glucuronides excreted from duodenum, jejunum, ileum and colon, when expressed in the term of percentages of perfused amounts (Mtotal), were 26.1%, 17.8%, 2.1% and 1.3%, respectively.
Figure 4.
Amounts of aglycone absorbed (A) and amounts of glucuronides excreted in the intestine (B) in a four-site rat intestinal perfusion model (n = 4). Perfusate contained 10 μM naringenin and four segments of the intestine (i.e., duodenum, upper jejunum, terminal ileum, and colon) were perfused simultaneously at a flow rate of 0.191 ml/min. The data for the intestinal absorption and metabolite excretion shown in this figure are expressed as average of 4 times intervals starting from 30 minutes up to 150 minutes of experimental period. The “*”symbol indicates statistically significant differences (p < 0.05) between amounts excreted in different intestinal segments according to one-way ANOVA with Tukey-Kramer multiple comparison (posthoc) tests.
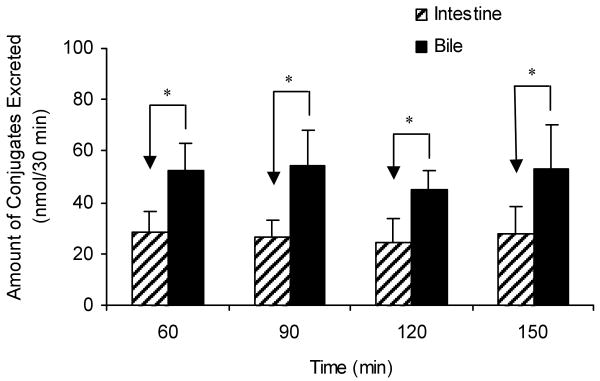
Large amounts of one of the naringenin glucuronides M2 were also found in the bile (Figure 2 and Figure 5). Most of the naringenin were excreted as glucuronide M2 and only minor amounts were excreted as aglycone in bile during the perfusion experiment (detail data in figure 8). No sulfates were found in the bile. Since our earlier studies proposed that intestinal disposition was more important than hepatic disposition in the first-pass metabolism of flavones and isoflavonoids at normal dosage18,19,21, we compared the amount of naringenin glucuronides excreted from bile to that from intestine to estimate the relative contribution of intestine versus liver for naringenin metabolite excretion. The result showed that amount of conjugate excreted into the intestinal lumen or Mgut (37.0 nmol/30 min/10 cm or 11.8% of Mtotal) was about half of that excreted into the bile or Mbile (51.1 nmol/30 min or 22.3% of Mtotal) (Figure 5).
Figure 5.
Relative contribution of intestinal (slashed columns) versus biliary (solid columns) excretion of naringenin conjugates. In the figure, the time (e.g., 60 min) indicates the time when the sampling ends. Each column represents the average of four determinations. The “*”symbol indicates statistically significant differences (p < 0.05) between the amounts excreted in bile and in intestine according to the Student's t-test.
Figure 8.
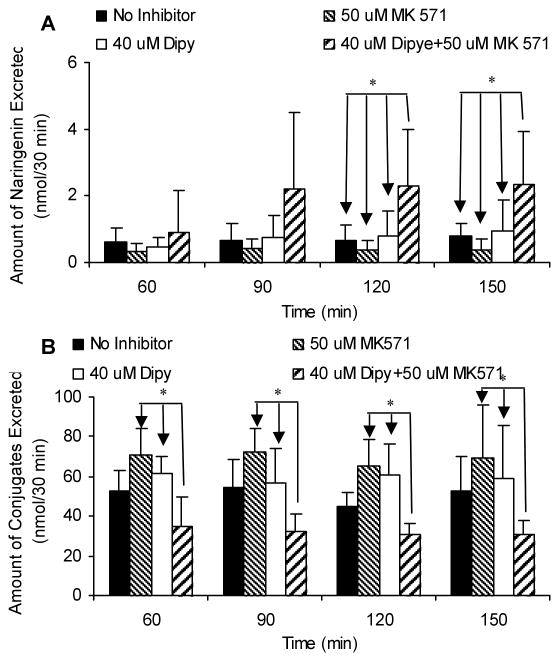
Effects of Mrp2 and Bcrp1 inhibitors on the biliary excretion of naringenin (A) and its glucuronides (B) by using a four-site rat intestinal perfusion model (n = 4). Perfusate containing 10 μM naringenin with or without 50 μM MK-571 (Mrp2 inhibitor) and/or 40 μM dipyridamole (Dipy; Bcrp1 inhibitor) were perfused at a flow rate of 0.191 mL/min. The “*”symbol indicates statistically significant differences (p < 0.05) between amounts excreted in the control and inhibitor experiments according to one-way ANOVA with Tukey-Kramer multiple comparison (posthoc) tests.
Glucuronidation of Naringenin in Liver and Intestinal Microsomes
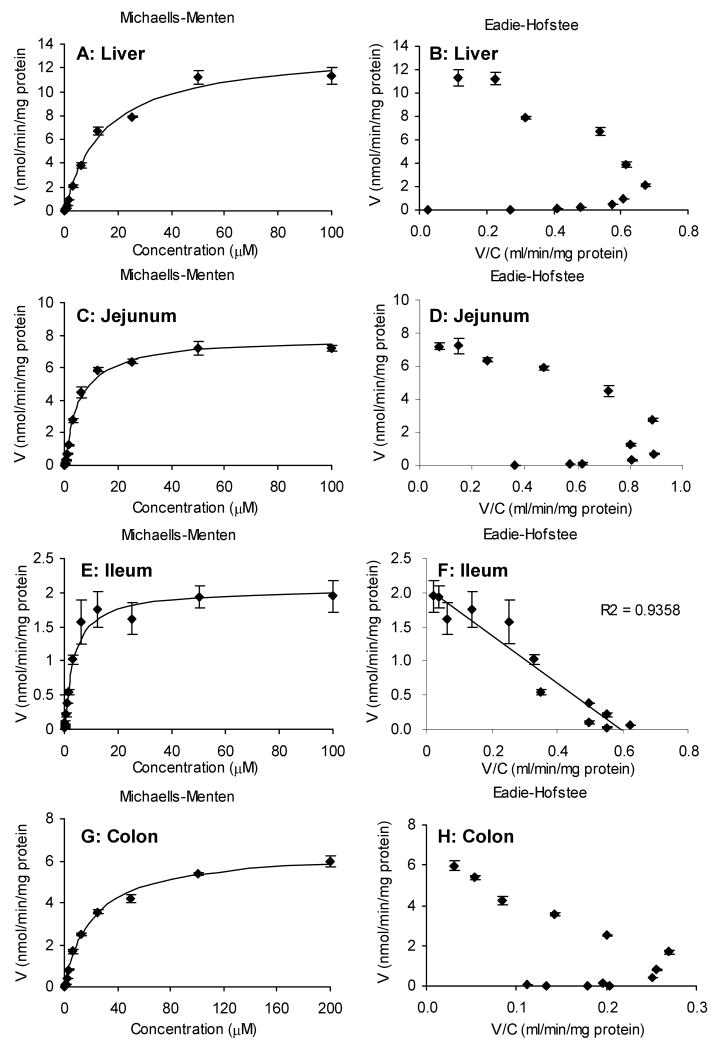
Because intestinal and biliary excretion of glucuronides is the result of enzyme reaction and subsequent efflux by transporters, glucuronidation of naringenin was determined using liver and intestinal microsomes to study the enzymatic reactions only. Intestinal microsomes prepared from jejunum, ileum and colon along with liver microsomes were used and reaction was determined in the concentration range of 48.8 nM to 100 μM for rat liver, jejunum and ileum microsomes and from 48.8 nM to 200 μM for colon microsomes (Figure 6). The results showed that glucuronidation of naringenin were concentration-dependent and approached saturation at higher concentration. The apparent kinetic parameters of the glucuronidation of naringenin using different microsomes are shown in Table 1. The apparent Km was smaller for small intestinal microsomes than liver and colon microsomes, suggesting that the intestinal UGTs have higher affinity for naringenin. The Vmax value of glucuronidation was the largest in liver microsomes and the smallest in ileum, indicating that liver has the largest capability to metabolize naringenin. Taken together, the intrinsic clearance value (Vmax/Km) was the highest for jejunum and the lowest for colon.
Figure 6.
Glucuronidation rates of naringenin in rat liver (A), jejunum (C), ileum (E), and colon (G) microsome as a function of concentration (n = 3). Rates of metabolism were determined from 48.8 nM to 100 μM for all the microsomes except from 48.8 nM to 200 μM for colon microsomes. The final protein concentrations were 13 μg/ml for liver and jejunum microsome, 26 μg/ml for colon microsomes, and 52 μg/ml for ileum microsome. The reaction time was 30 min for liver, jejunum, and colon microsome and 40 min for ileum microsome as described in the methods. Eadie-Hofstee plots (B, D, F, H) were generated to determine which equation was used for data fitting.
Table 1.
Kinetic parameters of metabolism for naringenin by rat liver, jejunum, ileum, and colon microsomes.
| Liver | Jejunum | Ileum | Colon | |
|---|---|---|---|---|
| Auto-activation | Auto-activation | Michaelis-Menten | Auto-activation | |
| Vmax (nmol/min/mg protein) | 13.23* | 7.53* | 1.99* | 6.56* |
| Km (μM) | 13.41* | 3.62* | 2.54* | 21.22* |
| Vmax/Km (ml/min/mg protein) | 0.98* | 2.07* | 0.78* | 0.31* |
| R (autoact only) | 0.38 | 0.39 | 1.14 | |
| Vmax-o (nmol/min/mg protein) | 5.83 | 2.00 | 1.08 | |
| Vmax-d (nmol/min/mg protein) | 7.40 | 5.53 | 5.49 | |
| AIC | 12.3 | -18.5 | 1.5 | -10.9 |
Vmax in the autoactivation columns is the sum of Vmax-0 and Vmax-d. The parameters with “*” mark were used to compare with each other.
Effects of Mrp2 or Bcrp1 Inhibitors on Absorption and Excretion of Naringenin in the Rat Perfusion Model
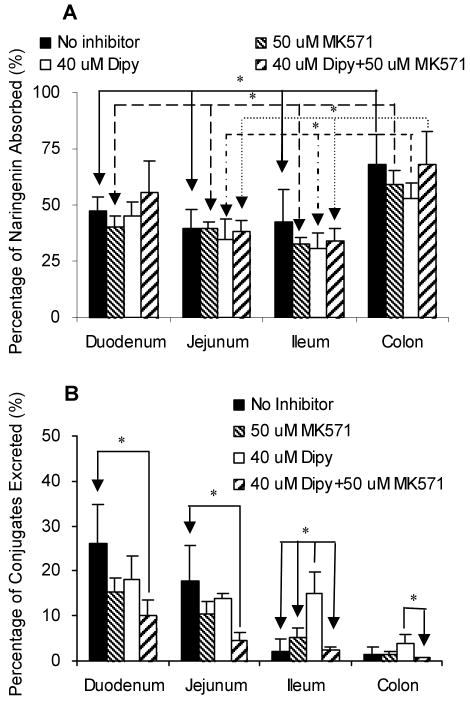
Our previous data showed that efflux transporters, such as Mrp2, played an important role in the efflux of phase II metabolites of apigenin and genistein.17,20,23 Therefore, we determined the excretion of metabolites of naringenin in the absence or presence of Mrp2 and/or Bcrp1 inhibitors to investigate the possible involvement of efflux transporter(s) in the disposition of naringenin. Compare to the results without inhibitors in the same intestinal segments, Mrp2 inhibitor, MK-571, had no effect on the absorption of naringenin or the excretion of naringenin glucuronides into the intestinal lumen (Figure 7). Bcrp1 inhibitor, dipyridamole, did not affect the absorption of aglycone in the four regions of intestine or the efflux of glucuronides in perfused intestinal segments other than ileum (Fig.7). In ileum, dipyridamole unexpectedly increased the excretion of naringenin glucuronides (Figure 7B). When these two inhibitors were used together, the efflux of glucuronides decreased substantially in duodenum and jejunum (p < 0.05) (Figure 7B) while the absorption of naringenin did not change (Figure 7A). The absorption of naringenin from rat intestinal segments was not affected by both efflux transporter chemical inhibitors used with an exception of duodenal and colon absorption. In the presence of dipyridamole alone or in combination with MK-571, the difference in naringenin absorption from duodenum and colon lost statistical significance (Figure 7A). To further investigate the effects of the inhibitors, we measured how excretion changed as a function of time. The results indicated that the efflux of glucuronides appears to be slightly increasing (p>0.05) with time in ileum and colon in the presence of 40 μM dipyridamole. The excretion rates of glucuronides were not influenced by the time of the sampling, validating the assumption that we are at steady-state with respect to absorption and metabolite excretion in this perfusion model.
Figure 7.
Absorption of naringenin in the absence or presence of Mrp2 and Bcrp1 inhibitors (A) and the effects of inhibitors on the excretion of naringenin conjugates (B) in intestine by using a four-site rat intestinal perfusion model (n = 4). Perfusate containing 10 μM naringenin with or without 50 μM MK-571 (Mrp2 inhibitor) and/or 40 μM dipyridamole (Dipy; Bcrp1 inhibitor) were perfused at a flow rate of 0.191 mL/min. The “*”symbol indicates statistically significant differences (p < 0.05) between amounts excreted in the control and inhibitor experiments according to one-way ANOVA with Tukey-Kramer multiple comparison (posthoc) tests.
Analysis of biliary samples indicated that neither MK-571 nor dipyridamole alone affected the excretion of naringenin glucuronides from bile, although when they were used simultaneously, the excretion of glucuronides was significantly lowered (p < 0.05) (Figure 8B). In addition, the biliary excretion of aglycone increased (p<0.05) in the presence of 50 μM MK-571 and 40 μM dipyridamole in the intestinal perfusate after 90 min (Figure 8A). The time-dependent effects suggested that it took time for these two inhibitors to reach liver in sufficient quantities. Both MK-571 and dipyridamole permeates Caco-2 cell membranes with decent permeabilities close to 10×10-6 cm/sec.20,23
Effects of Mrp2 or Bcrp1 Inhibitors on Metabolism of Naringenin in Liver and Intestinal Microsomes
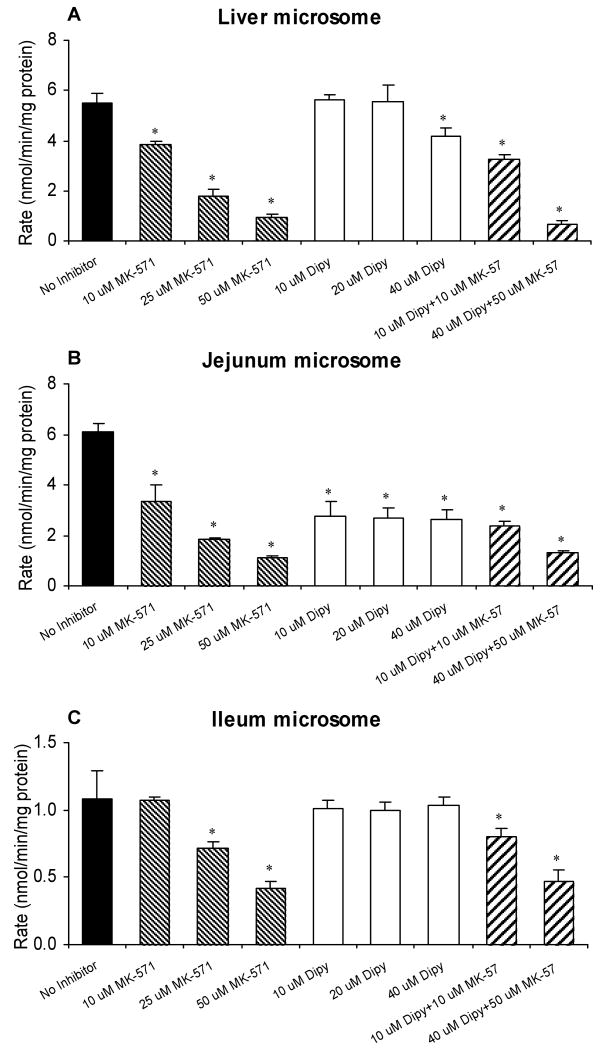
The effects of MK-571 and dipyridamole on the liver and intestinal microsome activities were analyzed in this study to determine if they will affect their metabolism as well, since earlier study has showed MK-571 inhibited glucuronidation of apigenin.18 In liver microsomes, MK-571 concentration-dependently inhibited the glucuronidation of naringenin, while dipyridamole inhibited this reaction only at the highest concentration (40 μM; Figure 9A). Compared with the control, the metabolism rate of naringenin decreased significantly (p < 0.05) in liver microsomes when MK-571 and dipyridamole were used together. In jejunum microsomes, the effect of MK-571 was the same as that in liver microsomes, but dipyridamole dose-independently inhibited the metabolism of naringenin from 10 to 40 μM. Regardless if used separately or simultaneously, MK-571 and dipyridamole inhibited the formation of naringenin glucuronide in jejunal microsomes (Figure 9B). In contrast, the activity of ileum microsome-catalyzed metabolism of naringenin was not as sensitive to either of the inhibitors as jejunum microsomes (Figure 9C). Dipyridamole had no effect on the glucuronidation of naringenin in ileum microsomes and MK-571 had inhibitory effect at higher concentration (25 and 50 μM). When they were used simultaneously, the glucuronidation rates of naringenin were decreased significantly compared to the control (Figure 9C).
Figure 9.
Effects of Mrp2 inhibitor (MK-571) and Bcrp1 inhibitor (dipyridamole, Dipy) on the metabolism of 10 μM naringenin in liver (A), jejunum (B), and ileum (C) microsome (n = 3). Incubation samples without inhibitors were used as controls. The “*”symbol indicates statistically significant differences (p < 0.05) between amounts excreted in the control and inhibitor experiments according to one-way ANOVA with Tukey-Kramer multiple comparison (posthoc) tests.
Effects of MK 571 and Dipyridamole on Steady-State Blood Concentration of Naringenin and its Glucuronides
The intact naringenin was not detected in blood collected from the rat tail vein after perfusion with 10 μM naringenin for 2.5 h. The blood concentrations of naringenin glucuronides after perfusion with 10 μM naringenin, 10 μM naringenin + 50 μM MK-571, 10 μM naringenin + 40 μM dipyridamole, and 10 μM naringenin + 50 μM MK + 40 μM dipyridamole, were 604.6 ± 207.6 nM, 436.9 ± 103.6 nM, 443.3 ± 99.0 nM, and 540.1 ± 55.0 nM, respectively. There were no significant differences in blood concentration between different treatment conditions.
Discussion
The results showed that naringenin was rapidly absorbed in intestine and its absorption was comparable to other flavonoid aglycones such as apigenin and genistein, two compounds that were shown to be rapidly absorbed.18 It is consistent with our previous conclusion that poor absorption is not the reason for poor bioavailabilities of flavonoids including flavanones. On the other hand, the absorption of naringenin was site-dependent (Figure 4A), which was different from site-independent absorption of apigenin shown previously.18 Therefore, this result suggests that the absence of double bond in the benzopyrone ring (Figure1) affected flavonoid absorption, especially from the colon.
We found that the extensive first-pass metabolism of flavanones was the reason for its poor bioavailabilities in rats and the main metabolites in rat intestinal perfusate and bile were mono-glucuronides of naringenin. The site of glucuronidation are most likely at 7-OH or 4′-OH position based MS spectrum data (Figure 2 and Figure 3) and literature information.29,38,39 These glucuronides of naringenin were excreted via bile or four perfused segments of the intestine (Figure 4B and 5), suggesting both organs are important contributors to the naringenin first-pass metabolism. The excretion of naringenin glucuronides was expressed as a sum of mono-glucuronides M1 and M2 in UPLC because of the lack of metabolic standards for these two metabolites and difficulty to separate one from the other. Since the major aims of this study were to characterize the poor bioavailability of flavonoids and to determine the effects of efflux transporters and enzymes on the disposition of naringenin, we decided that it was worthwhile to elucidate how UGTs and efflux transporters affect the disposition of two naringenin mono-glucuronides as a whole.
We found that excretion of naringenin glucuronides was rapid in upper small intestine, which was faster than that in the lower intestine (ileum and colon). This finding was consistent with our own published data showing slower colonic/ileal excretion of apigenin glucuronides than its small intestinal excretion 18,19. This similarity suggests that naringenin and apigenin probably shared some of the same UGTs and efflux transporters.
When directly comparing the excretion of naringenin glucuronides from the liver versus from the intestine, the hepatic metabolism appeared to be more efficient than intestinal metabolism (at 10 μM), because there were much more glucuronides in 30 min bile sample (22.3% of Mtotal) than in 30 min perfusate (11.8% of Mtotal) (Figure 5). However, only 30 cm of 80 cm rat small intestine was perfused in this experiment as described in detail in our previous study18. If 100% of the small intestine (i.e., more than double the length) were perfused, the contribution from intestinal and biliary excretion might be more comparable. A closer examination of the data revealed that the actual contribution of intestinal excretion could be even higher than biliary excretion. This was due to the fact that naringenin would have been absorbed in the upper small intestine after oral administration (top 20-30 cm), where the metabolism was much more extensive than what occurred in terminal ileum and colon (Figure 4). Indeed, up to 39% (average of 27%) of Mtotal was excreted into the duodenum as glucuronides and up to 24% (average of of 18%) of Mtotal was excreted into the jejunum. The fact that intestinal metabolism contributed to the systemic glucuronide level is consistent with a study of O'Leary et al.,40 who have shown that HepG2 liver cells can uptake phase II conjugates of flavones, although the specific OATP involved was unclear since Western blot analysis did not corroborate with the indocyanine-green effects. These results suggest that a portion of biliary glucuronides could come from glucuronides formed in the intestine. Hence, intestinal conjugation is at least one of two most important components if not the most important component in the first-pass metabolism of naringenin (10 μM).
The notion that intestinal metabolism is more important than liver metabolism is especially true at lower concentration we believe, as glucuronidation in the jejunum microsomes was much faster than liver microsomes at low concentrations (< 5 μM) (Figure 6). Furthermore, the concentration of naringenin in the enterocytes was likely to be much higher than that in the portal vein, which means the apparent rates of metabolism of naringenin in the intestine might be much higher than that in the liver. Taken together, these data are consistent with our earlier dispositional studies of apigenin and genistein,19,19,22 all of which strongly supported the hypothesis that intestinal disposition contributed more to the poor bioavailabilities of dietary flavonoids than hepatic disposition.
The above discussion clearly showed that intestinal disposition is very important for naringenin glucuronidation at lower concentrations. We then determined the rate-limiting or dominant step in intestinal disposition: glucuronidation or excretion of hydrophilic metabolites. The results showed that efflux transporter is the rate-limiting step, even though excretion of naringenin glucuronides tends to react differently to the same inhibitors when present at different regions of the perfused intestine. The reasons are as follows. In the upper small intestine, inhibition of glucuronide formation by 50 μM MK-571 or 40 μM dipyridamole did not result in a change in amounts of glucuronides excreted (Figure 7 and Figure 9), suggest that reduced rate of metabolism still provided sufficient amounts of metabolites for efflux. When both inhibitors were used simultaneously, however, the excretion amounts did decrease significantly, even though the two inhibitors used together did not result in further decrease in glucuronide formation rates when compared to using either compound alone (Figure 7 and Figure 9). These results suggest that formation is not the rate-limiting step. On the other hand, the fact that the excretion rates of glucuronides only decreased in the presence of two inhibitors, each capable of inhibiting one of the two most important efflux transporters: Mrp2 (by MK-571) or Bcrp1 (by dipyridamole), suggest that there is a possible compensation between the two efflux transporters as inhibition of either transporter alone did not result in a significant decrease in glucuronide excretion. However, this suggestion is tempered by the fact that dipyridamole is probably not the most specific inhibitor of Bcrp1 and may interact with other efflux transporters.
We believe that this transporter compensation also occurs at the distal part of the small intestine (i.e., ileum) since use of 40 μM dipyridamole, which did not suppress glucuronide formation in the ileum microsomes (Figure 9), increases the glucuronide excretion (Figure 7). The latter is probably the result of increased Mrp2 function due to Bcrp1 inhibition by dipyridamole. The same can be said of colonic excretion of naringenin glucuronides, which were also stimulated by dipyridamole (Figure 7). We believe that the Mrp2 is involved here because an increase in dipyridamole-stimulated glucuronide excretion from the apical side was suppressed by MK-571, a well-known inhibitor of Mrp2. We do not believe that the decrease is due to MK-571 suppression of glucuronidation alone since the inhibitory effect was only 50% (in ileum microsomes) at a concentration of 50 μM (which is likely to be higher than intracellular MK-571 concentration during perfusion) (Figure 9), whereas the decrease in efflux was more than 80% (Figure 7).
The important role played by the efflux transporter is also evident in the colon, where excretion of naringenin glucuronide is very slow under normal condition, which is approximately 14 times less than jejunum. In contrast, naringenin glucuronidation rates in colon microsomes at 10 μM was only about 2.5 times slower than that in jejunum microsomes (Figure 6C and G). This result suggests that the large intestine was probably deficient in certain efflux transporter(s) that were capable of pumping out the hydrophilic glucuronides. The possibility that glucuronides were preferentially effluxed via the basolateral side was less likely, since previous studies in Caco-2 cells showed similar excretion patterns in apical and basolateral excretion,41 in that higher apical excretion of glucuronides was usually corroborated by higher basolateral excretion. We believe that the compensating transporter in lower intestine is Mrp2 since its expression in colon is much lower than the intestine.42,43
Aside from observed inhibition or stimulation of intestinal naringenin glucuronide excretion by selected chemical “inhibitors”, our analysis suggests that steady-state biliary excretion of glucuronides was not impacted by the use of any single inhibitor. Surprisingly, the biliary glucuronide excretion was inhibited when both inhibitors were used (Figure 8B), as we did not expect a large amount of inhibitors (or high concentration of it) to reach the hepatocytes from intestinal perfusion. It is possible that smaller amounts of intestinal glucuronides were excreted from the basolateral side from enterocytes as basolateral Mrp1 and Mrp3 are inhibited by MK-571, but further investigation into this possibility needs to be explored. In any rate, this inhibition of biliary glucuronide excretion eventually led to increase in naringenin (or aglycone) excretion, although it took 30 min more to do so (Figure 9B).
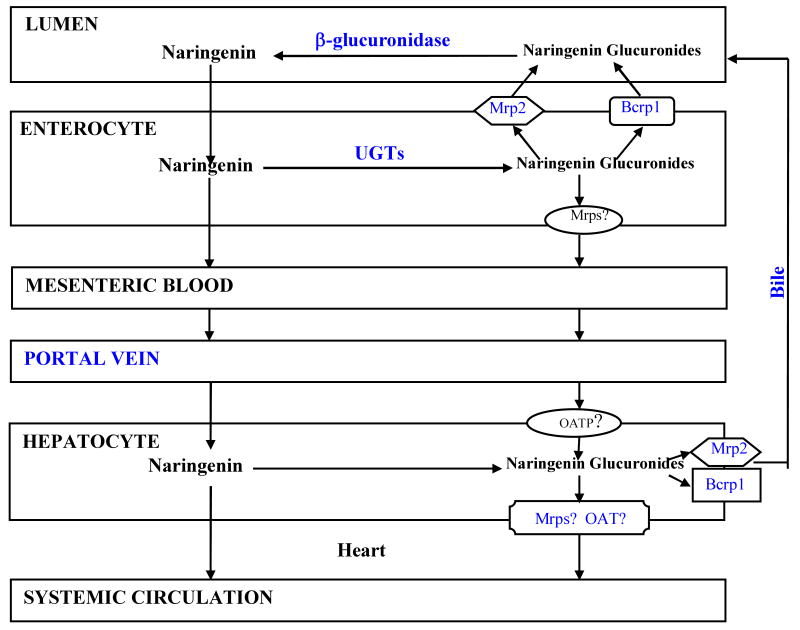
In summary, our intestinal excretion data and microsomal metabolism data continued to lend support to the proposed hypothesis that intestinal disposition of flavonoids was affected by the interplay of efflux transporters and metabolic enzymes, and that this process is often rate-limited by the intestinal efflux transporters (Figure 10). The compensatory functions of the efflux transporters make it difficult to improve oral bioavailabilities of flavonoids via the use of UGT inhibitors as significant UGT inhibition may not result in significant change in blood concentration of flavonoids. Other investigators have shown the bioavailability of topotecan (a Bcrp1 substrate) was not affected by potent Bcrp1 inhibitors chrysin and benzoflavone in MDR-/- mice,44 implicating the presence of compensatory mechanism for efflux transporters as well.
Figure 10.
Schematic representation of intestinal disposition pathways of naringenin and its glucurondies. The transporters involved in transporting naringenin glucuronides to the apical side are depicted here. Additional transporters that move glucuronides to the liver via portal vein remain to be determined and is represented by the question “?” mark.
In conclusion, we have shown the absorption of naringenin was found to be rapid and similar to structurally analogous flavonoids such as apigenin. Like other flavonoids (apigenin and genistein), intestine is likely to be the most important organ responsible for the first-pass metabolism of naringenin at low concentrations. We have also provided evidence to support the novel hypothesis that Mrp2 and Bcrp1 play important roles in the efflux of naringenin glucuronides and that these transporters compensate for each other's functional deficiencies. Taken together, apical efflux transporters are important for the phase II metabolism of flavonoids via glucuronidation. Further studies are needed to determine how basolateral efflux transporters affect glucuronide excretion to achieve an even better understanding of the flavonoid disposition processes in vivo. We believe that an improved understanding of flavonoid disposition will one day lead to better bioavailability, which will help realize the potentials of flavonoids as chemopreventive or chemotherapeutic agents.
Contributor Information
Haiyan Xu, Email: xhy1020@gmail.com.
Kaustubh H. Kulkarni, Email: kkulkarn@central.uh.edu.
Rashim Singh, Email: rashim_niper@yahoo.com.
Zhen Yang, Email: zyang21@mail.uh.edu.
Stephen W.J. Wang, Email: stephen.wang@spcorp.com.
Vincent H. Tam, Email: VHTam@Central.UH.EDU.
Ming Hu, Email: mhu@uh.edu.
References
- 1.Rice-Evans C, Miller NG, Paganga G. Structure antioxidant activity relationships of flavonoids and phenolic acids. Free Radic Biol Med. 1996;20(7):933–956. doi: 10.1016/0891-5849(95)02227-9. [DOI] [PubMed] [Google Scholar]
- 2.Lee SH, Park YB, Bae KH, Bok SH, Kwon YK, Lee ES, Choi MS. Cholesterol-lowering activity of naringenin via inhibition of 3-hydroxy-3-methylglutaryl coenzyme A reductase and acyl coenzyme A: cholesterol acyltransferase in rats. Ann Nutr Metab. 1999;43(3):173–180. doi: 10.1159/000012783. [DOI] [PubMed] [Google Scholar]
- 3.Santos KF, Oliveira TT, Nagem TJ, Pinto AS, Oliveira MG. Hypolipidaemic effects of naringenin, rutin, nicotinic acid and their associations. Pharmacol Res. 1999;40(6):493–496. doi: 10.1006/phrs.1999.0556. [DOI] [PubMed] [Google Scholar]
- 4.Franke AA, Cooney RV, Henning SM, Custer LJ. Bioavailability and antioxidant effects of orange juice components in humans. J Agric Food Chem. 2005;53(13):5170–5178. doi: 10.1021/jf050054y. [DOI] [PMC free article] [PubMed] [Google Scholar]
- 5.Kanno S, Tomizawa A, Hiura T, Osanai Y, Shouji A, Ujibe M, Ohtake T, Kimura K, Ishikawa M. Inhibitory effects of naringenin on tumor growth in human cancer cell lines and sarcoma S-180-implanted mice. Biol Pharm Bull. 2005;28(3):527–530. doi: 10.1248/bpb.28.527. [DOI] [PubMed] [Google Scholar]
- 6.Williamson-Hughes PS, Flickinger BD, Messina MJ, Empie MW. Isoflavone supplements containing predominantly genistein reduce hot flash symptoms: a critical review of published studies. Menopause. 2006;13(5):831–839. doi: 10.1097/01.gme.0000227330.49081.9e. [DOI] [PubMed] [Google Scholar]
- 7.Benavente-Garcia O, Castillo J, Alcaraz M, Vicente V, Del Rio JA, Ortuno A. Beneficial action of Citrus flavonoids on multiple cancer-related biological pathways. Curr Cancer Drug Targets. 2007;7(8):795–809. doi: 10.2174/156800907783220435. [DOI] [PubMed] [Google Scholar]
- 8.Kelly GE, Joannou GE, Reeder AY, Nelson C, Waring MA. The variable metabolic response to dietary isoflavones in humans. Proc Soc Exp Biol Med. 1995;208(1):40–43. doi: 10.3181/00379727-208-43829. [DOI] [PubMed] [Google Scholar]
- 9.Setchell KD. Phytoestrogens: the biochemistry, physiology, and implications for human health of soy isoflavones. Am J Clin Nutr. 1998;68(6 Suppl):1333S–1346S. doi: 10.1093/ajcn/68.6.1333S. [DOI] [PubMed] [Google Scholar]
- 10.Birt DF, Hendrich S, Wang W. Dietary agents in cancer prevention: flavonoids and isoflavonoids. Pharmacol Ther. 2001;90(2-3):157–177. doi: 10.1016/s0163-7258(01)00137-1. [DOI] [PubMed] [Google Scholar]
- 11.Setchell KD, Brown NM, Desai P, Zimmer-Nechemias L, Wolfe BE, Brashear WT, Kirschner AS, Cassidy A, Heubi JE. Bioavailability of pure isoflavones in healthy humans and analysis of commercial soy isoflavone supplements. J Nutr. 2001;131(4 Suppl):1362S–1375S. doi: 10.1093/jn/131.4.1362S. [DOI] [PubMed] [Google Scholar]
- 12.Busby MG, Jeffcoat AR, Bloedon LT, Koch MA, Black T, Dix KJ, Heizer WD, Thomas BF, Hill JM, Crowell JA, Zeisel SH. Am J Clin Nutr. 1. Vol. 75. 2002. Clinical characteristics and pharmacokinetics of purified soy isoflavones: single-dose administration to healthy men; pp. 126–136. [DOI] [PubMed] [Google Scholar]
- 13.Chen L, Zhang HY. Cancer preventive mechanisms of the green tea polyphenol (-)-epigallocatechin-3-gallate. Molecules. 2007;12(5):946–957. doi: 10.3390/12050946. [DOI] [PMC free article] [PubMed] [Google Scholar]
- 14.Hadi SM, Bhat SH, Azmi AS, Hanif S, Shamim U, Ullah MF. Oxidative breakage of cellular DNA by plant polyphenols: a putative mechanism for anticancer properties. Semin Cancer Biol. 2007;17(5):370–376. doi: 10.1016/j.semcancer.2007.04.002. [DOI] [PubMed] [Google Scholar]
- 15.Kurzer MS, Xu X. Dietary phytoestrogens. Annu Rev Nutr. 1997;17:353–381. doi: 10.1146/annurev.nutr.17.1.353. [DOI] [PubMed] [Google Scholar]
- 16.Yang CS, Landau JM, Huang MT, Newmark HL. Inhibition of carcinogenesis by dietary polyphenolic compounds. Annu Rev Nutr. 2001;21:381–406. doi: 10.1146/annurev.nutr.21.1.381. [DOI] [PubMed] [Google Scholar]
- 17.Liu Y, Hu M. Absorption and metabolism of flavonoids in the caco-2 cell culture model and a perused rat intestinal model. Drug Metab Dispos. 2002;30(4):370–377. doi: 10.1124/dmd.30.4.370. [DOI] [PubMed] [Google Scholar]
- 18.Chen J, Lin H, Hu M. Metabolism of flavonoids via enteric recycling: role of intestinal disposition. J Pharmacol Exp Ther. 2003;304(3):1228–1235. doi: 10.1124/jpet.102.046409. [DOI] [PubMed] [Google Scholar]
- 19.Chen J, Wang S, Jia X, Bajimaya S, Tam VH, Hu M. Disposition of flavonoids via recycling: comparison of intestinal versus hepatic disposition. Drug Metab Dispos. 2005;33(12):1777–1784. doi: 10.1124/dmd.105.003673. [DOI] [PubMed] [Google Scholar]
- 20.Hu M, Chen J, Lin H. Metabolism of flavonoids via enteric recycling: mechanistic studies of disposition of apigenin in the Caco-2 cell culture model. J Pharmacol Exp Ther. 2003;307(1):314–321. doi: 10.1124/jpet.103.053496. [DOI] [PubMed] [Google Scholar]
- 21.Jia X, Chen J, Lin H, Hu M. Disposition of flavonoids via enteric recycling: enzyme-transporter coupling affects metabolism of biochanin A and formononetin and excretion of their phase II conjugates. J Pharmacol Exp Ther. 2004;310(3):1103–1113. doi: 10.1124/jpet.104.068403. [DOI] [PubMed] [Google Scholar]
- 22.Wang SW, Chen J, Jia X, Tam VH, Hu M. Disposition of Flavonoids via Enteric Recycling: Structural Effects and Lack of Correlations between in Vitro and in Situ Metabolic Properties. Drug Metab Dispos. 2006;34(11):1837–1848. doi: 10.1124/dmd.106.009910. [DOI] [PubMed] [Google Scholar]
- 23.Wang SW, Chen Y, Joseph T, Hu M. Variable isoflavone content of red clover products affects intestinal disposition of biochanin A, formononetin, genistein, and daidzein. J Altern Complement Med. 2008;14(3):287–297. doi: 10.1089/acm.2007.0617. [DOI] [PMC free article] [PubMed] [Google Scholar]
- 24.Crespy V, Morand C, Manach C, Besson C, Demigne C, Remesy C. Part of quercetin absorbed in the small intestine is conjugated and further secreted in the intestinal lumen. Am J Physiol. 1999;277(1):G120–126. doi: 10.1152/ajpgi.1999.277.1.G120. [DOI] [PubMed] [Google Scholar]
- 25.Walle UK, Galijatovic A, Walle T. Transport of the flavonoid chrysin and its conjugated metabolites by the human intestinal cell line Caco-2. Biochem Pharmacol. 1999;58(3):431–438. doi: 10.1016/s0006-2952(99)00133-1. [DOI] [PubMed] [Google Scholar]
- 26.Andlauer W, Kolb J, Furst P. Absorption and metabolism of genistin in the isolated rat small intestine. FEBS Lett. 2000;475(2):127–130. doi: 10.1016/s0014-5793(00)01642-2. [DOI] [PubMed] [Google Scholar]
- 27.Andlauer W, Kolb J, Furst P. Isoflavones from tofu are absorbed and metabolized in the isolated rat small intestine. J Nutr. 2000;130(12):3021–3027. doi: 10.1093/jn/130.12.3021. [DOI] [PubMed] [Google Scholar]
- 28.Totta P, Acconcia F, Leone S, Cardillo I, Marino M. Mechanisms of naringenin-induced apoptotic cascade in cancer cells: involvement of estrogen receptor alpha and beta signalling. IUBMB Life. 2004;56(8):491–499. doi: 10.1080/15216540400010792. [DOI] [PubMed] [Google Scholar]
- 29.Brett GM, Hollands W, Needs PW, Teucher BR, Dainty J, Davis BD, Brodbelt JS, Kroon PA. Absorption, metabolism and excretion of flavanones from single portions of orange fruit and juice and effects of anthropometric variables and contraceptive pill use on flavanone excretion. Br J Nutr. 2008;19:1–12. doi: 10.1017/S000711450803081X. [DOI] [PMC free article] [PubMed] [Google Scholar]
- 30.Kanaze FI, Bounartzi MI, Georgarakis M, Niopas I. Pharmacokinetics of the citrus flavanone aglycones hesperetin and naringenin after single oral administration in human subjects. Eur J Clin Nutr. 2007;61(4):472–477. doi: 10.1038/sj.ejcn.1602543. [DOI] [PubMed] [Google Scholar]
- 31.Hu M, Sinko PJ, deMeere AL, Johnson DA, Amidon GL. Membrane permeability parameters for some amino acids and beta-lactam antibiotics: application of the boundary layer approach. J Theor Biol. 1988;131(1):107–114. doi: 10.1016/s0022-5193(88)80124-3. [DOI] [PubMed] [Google Scholar]
- 32.Hu M, Roland K, Ge L, Chen J, Li Y, Tyle P, Roy S. Determination of absorption characteristics of AG337, a novel thymidylate synthase inhibitor, using a perfused rat intestinal model. J Pharm Sci. 1998;87(7):886–890. doi: 10.1021/js970251e. [DOI] [PubMed] [Google Scholar]
- 33.Houston JB, Kenworthy KE. In vitro-in vivo scaling of CYP kinetic data not consistent with the classical Michaelis-Menten model. Drug Metab Dispos. 2000;28(3):246–254. [PubMed] [Google Scholar]
- 34.Hutzler JM, Tracy TS. Atypical kinetic profiles in drug metabolism reactions. Drug Metab Dispos. 2002;30(4):355–362. doi: 10.1124/dmd.30.4.355. [DOI] [PubMed] [Google Scholar]
- 35.D'Argenio DZ, Schumitzky A. Biomedical Simulations Resource. University of Southern California; Los Angeles: 1997. ADAPT II User's Guide: Pharmacokinetic/ Pharmacodynamic Systems Analysis Software. [Google Scholar]
- 36.Yamaoka K, Nakagawa T, Uno T. Application of Akaike's information criterion (AIC) in the evaluation of linear pharmacokinetic equations. J Pharmacokinet Biopharm. 1978;6(2):165–175. doi: 10.1007/BF01117450. [DOI] [PubMed] [Google Scholar]
- 37.Akaike H. Information theory and an extension of the maximum likelihood principle. In: Petrov BN, Csaki F, editors. 2nd International Symposium on Information Theory; Akademia Kiado: Budapest; 1973. pp. 267–281. [Google Scholar]
- 38.Davis BD, Needs PW, Kroon PA, Brodbelt JS. Identification of isomeric flavonoid glucuronides in urine and plasma by metal complexation and LC-ESI-MS/MS. J Mass Spectrom. 2006;41(7):911–920. doi: 10.1002/jms.1050. [DOI] [PubMed] [Google Scholar]
- 39.Silberberg M, Gil-Izquierdo A, Combaret L, Remesy C, Scalbert A, Morand C. Flavanone metabolism in healthy and tumor-bearing rats. Biomed Pharmacother. 2006;60(9):529–535. doi: 10.1016/j.biopha.2006.07.083. [DOI] [PubMed] [Google Scholar]
- 40.O'Leary KA, Day AJ, Needs PW, Mellon FA, O'Brien NM, Williamson G. Metabolism of quercetin-7- and quercetin-3-glucuronides by an in vitro hepatic model: the role of human beta-glucuronidase, sulfotransferase, catechol-O-methyltransferase and multi-resistant protein 2 (Mrp2) in flavonoid metabolism. Biochem Pharmacol. 2003;65(3):479–491. doi: 10.1016/s0006-2952(02)01510-1. [DOI] [PubMed] [Google Scholar]
- 41.Chen J, Lin H, Hu M. Absorption and metabolism of genistein and its five isoflavone analogs in the human intestinal Caco-2 model. Cancer Chemother Pharmacol. 2005;55(2):159–169. doi: 10.1007/s00280-004-0842-x. [DOI] [PubMed] [Google Scholar]
- 42.Rost D, Mahner S, Sugiyama Y, Stremmel W. Expression and localization of the multidrug resistance-associated protein 3 in rat small and large intestine. Am J Physiol. 2002;282(4):G720–726. doi: 10.1152/ajpgi.00318.2001. [DOI] [PubMed] [Google Scholar]
- 43.Takano M, Yumoto R, Murakami T. Expression and function of efflux drug transporters in the intestine. Pharmacol Ther. 2006;109(1-2):137–161. doi: 10.1016/j.pharmthera.2005.06.005. [DOI] [PubMed] [Google Scholar]
- 44.Zhang S, Wang X, Sagawa K, Morris ME. Flavonoids chrysin and benzoflavone, potent breast cancer resistance protein inhibitors, have no significant effect on topotecan pharmacokinetics in rats or mdr1a/1b (-/-) mice. Drug Metab Dispos. 2005;33(3):341–348. doi: 10.1124/dmd.104.002501. [DOI] [PubMed] [Google Scholar]


