Abstract
Ifosfamide (IF) and cyclophosphamide (CP) are common chemotherapeutic agents. Interestingly, while the two drugs are isomers, only IF treatment is known to cause nephrotoxicity and neurotoxicity. Therefore, it was anticipated that a comparison of IF and CP drug metabolites in the mouse would reveal reasons for this selective toxicity. Drug metabolites were profiled by ultra-performance liquid chromatography-linked electrospray ionization quadrupole time-of-flight mass spectrometry (UPLC-ESI-QTOFMS), and the results analyzed by multivariate data analysis. Of the total 23 drug metabolites identified by UPLC-ESI-QTOFMS for both IF and CP, five were found to be novel. Ifosfamide preferentially underwent N-dechloroethylation, the pathway yielding 2-chloroacetaldehyde, while cyclophosphamide preferentially underwent ring-opening, the pathway yielding acrolein (AC). Additionally, S-carboxymethylcysteine and thiodiglycolic acid, two downstream IF and CP metabolites, were produced similarly in both IF- and CP-treated mice. This may suggest that other metabolites, perhaps precursors of thiodiglycolic acid, may be responsible for IF encephalopathy and nephropathy.
Keywords: Ifosfamide, Cyclophosphamide, Metabolomics, Ultra-performance liquid chromatography, Time-of-flight mass spectrometry, Tandem mass spectrometry
1. Introduction
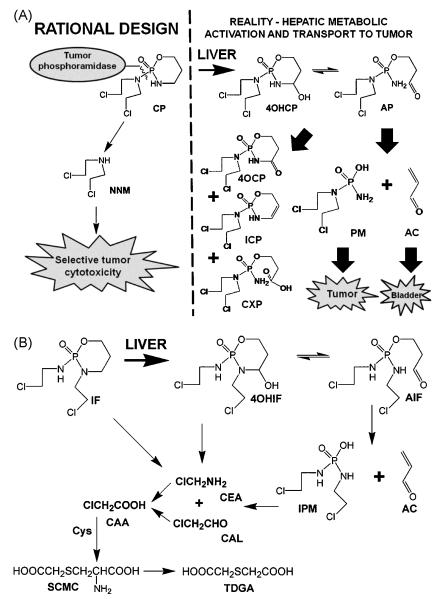
Cyclophosphamide (CP) and ifosfamide (IF) are isomeric oxazaphosphorine cytostatic drugs used widely in the chemotherapy of various cancers. CP was developed over 50 years ago as a innovative example of a pro-drug that might be transported to the tumor and then activated by tumor-specific enzymes, a strategy that had proven valuable for the treatment of prostate carcinoma with stilbestrol diphosphate [1]. High tumor expression and activity of phosphoramidase was the rational design principle [2] that lead to the incorporation of the highly cytotoxic nornitrogen mustard (NNM) into a stable and apparently inert oxazaphosphorine ring (Fig. 1A). It soon transpired that NNM was generated only in trace amounts but rather CP was converted in the liver into a transported metabolite that could be readily taken up by tumors [3]. A somewhat complex hepatic metabolic scheme gradually unfolded with CP converted to 4-hydroxycyclophosphamide (4OHCP) [4], which in turn taumomerized to aldophosphamide (AP) [5] that β-eliminated AC [6-7] to yield phosphoramide mustard (PM) [7-8]. This pathway can readily be reconciled with other observed metabolites of CP, such as 4-oxocyclophosphamide (4-ketocyclophosphamide; 4OCP) [9], iminocyclophosphamide (ICP) [10], and carboxyphosphamide (CXP) [11] (Fig. 1A). Both AP [7] and PM [11] were postulated as transport forms of CP. Ifosfamide (IF) was developed a decade after CP [12] and its metabolic transformation was reported to bear similarities to its isomer CP (Fig. 1B). Specifically, phenobarbital-induced rat liver microsomes converted IF to AC [7, 13] after the prior formation of 4-hydroxyifosfamide (4OHIF) [7], which was later reported to be in equilibrium with its tautomer aldoifosfamide (AIF) [14]. However, a major metabolic pathway for IF was side-chain dealkylation to yield 2- and 3-dechloroethylifosfamide (2-DCIF and 3-DCIF), both in vitro [7] and in vivo [15], together with 2-chloroacetaldehyde (CAL) [16] and 2-chloroethylamine (CEA) [17-18]. These two-carbon metabolites had been reported at only low levels in CP-treated rodents [11, 19-20]. Later reports demonstrated side-chain dealkylation yielding 2-DCIF and 3-DCIF as a major pathway of IF metabolism in both pediatric [21-23] and adult patients [24-26]. While the systemic toxicity of the aldehyde product of CP and IF metabolism AC had been mitigated by the introduction of mesna [27-28], the issue of host toxicity due to CAL was not immediately addressed [16].
Fig. 1.
Metabolic activation and transport of IF and CP in vivo. (A) Rational design of CP based upon its supposed metabolism in tumor tissue versus a contemporary view of CP metabolism. (B) A contemporary view of IF metabolism, including the N-dechloroethylation reactions that lead to two-carbon metabolites and ultimately SCMS and TDGA.
The differential metabolism of CP and IF most likely plays a central role in the differing toxicity profiles of these isomeric drugs. While the general pattern of intact oxazaphosphorine metabolites is similar for CP and IF, a key difference is the number and abundance of two-carbon metabolites that derive from side-chain dealkylation. It was proposed that CAL underlies both the neurotoxicity [16, 29-30] and nephrotoxicity [31] of IF. Additionally, CEA was proposed as a toxic metabolite [29-30] and has been reported to derive directly from IF by chemical hydrolysis and also reacting with bicarbonate to form 1,3-oxazolidin-2-one [17]. CAL has been reported to be converted to 2-chloroacetic acid (CAA) by human kidney [31] and rabbit heart [32]. In turn, CAA may react with cellular thiols to yield S-carboxymethylcysteine (SCMC) and its metabolite thiodiglycolic acid (TDGA) [15] (Fig. 1B). Other cysteine derived metabolites have also been observed [32]. What role this panoply of small IF metabolites plays in the selective toxicity and efficacy of IF is poorly understood.
What is clear is that CP and IF are two potent drugs which are inactive per se and whose effects on both the tumor and the host are determined by metabolism. Despite the large number of published studies on the metabolism of CP and IF both in vitro and in vivo and in a variety of species including Man (Table 1), a comprehensive comparative analysis of their metabolism is indicated. We have chosen to do this in the mouse for the sole reason that such a study lends itself to further investigation in animals humanized for various metabolic enzymes and the nuclear receptors that regulate their tissue expression [33]. We have also employed ultra-performance chromatography-linked electrospray ionization quadrupole time-of-flight mass spectrometry (UPLC-ESI-QTOFMS), which has proven successful in studies involving metabolomic protocols to uncover unforeseen drug metabolites of PhIP [34], melatonin [35], aminoflavone [36], acetaminophen [37], and the areca alkaloids [38-39].
Table 1.
Reported metabolites of IF and CP in vivo and in vitro
| Year | Drug | Metabolite | Species | Reference |
|---|---|---|---|---|
| 1967 | CP | Nornitrogen mustard 2-Chloroethylaziridine (decomposition products of unknown primary metabolite) |
Rat (iv) | [3] |
| 1967 | CP | Hydracrylic acid | PB-induced rats (ip) | [53] |
| 1971 | CP | Carboxycyclophosphamide 4-Oxocyclophosphamide |
Dog (iv), Human (iv) | [9] |
| 1971 | CP | Acrolein | Liver microsomes | [9] |
| 1972 | IF | Acrolein | PB-induced rat liver microsomes |
[13] |
| 1972 | CP | Aldophosphamide | Uninduced mouse liver microsomes |
[5] |
| 1973 | CP | 4-Hydroxycyclophosphamide [tautomer of aldophosphamide] |
PB-induced rat liver microsomes |
[4] |
| 1973 | CP | Phosphoramide mustard | PB-induced mouse liver microsomes |
[8] |
| 1974 | IF | 2-Dechloroethylifosfamide 3-Dechloroethylifosfamide 4-Hydroxyifosfamide |
PB-induced rat liver microsomes |
[7] |
| 1975 | IF | 2-Chloroethylamine | Rat (iv), Human (iv) | [54] |
| 1975 | CP | 3-(2-Chloroethyl)oxazolidone (from nornitrogen mustard + CO2) 1,4-Di(2-chloroethyl)piperazine |
Human (iv) | [55] |
| 1975 | CP | 4-Oxocyclophosphamide Alcophosphamide 2-Dechloroethylcyclophosphamide Carboxyphosphamide Phosphoramide mustard Nornitrogen mustard |
Mice (ip) | [11] |
| 1976 | CP | 3-Hydroxypropylmercapturic acid | Rat | [56] |
| IF | [metabolite of acrolein] | |||
| 1976 | IF | Carboxyifosfamide (1.4%) 2-Dechloroethylifosfamide (6.2%) 3-Dechloroethylifosfamide (12.5%) S-Carboxymethylcysteine (10.4%) Thiodiglycolic acid (4.7%) |
Human (iv) | [15] |
| 1976 | CP | 4-Hydroxycyclophosphamide Aldophosphamide Phosphoramide mustard 4-Oxocyclophosphamide |
Rat (ip), Mouse (ip) | [57] |
| 1978 | CP | Phosphoramide mustard Nornitrogen mustard (?artifact) |
Human (iv) | [58] |
| 1982 | CP | Iminocyclophosphamide | Immobilized rabbit liver P450 | [10] |
| 1983 | CP | 2-Chloroacetaldehyde | Rat (iv) | [20] |
| 1986 | CP | 3-(2-chloroethyl)-l,3-oxazolidin-2-one 3-(2-chloroethyl)-4-hydroxy-1,3- oxazolidin-2-one 3-(2-hydroxyethyl)-l,3-oxazolidin-2-one |
Rat (iv) | [59] |
| 1986 | IF | 2-Chloroacetaldehyde | Human (iv) | [16] |
| 1988 | CP | 4-Oxocyclophosphamide Carboxyphosphamide Phosphoramide mustard |
Human (iv) | [60-61] |
| 1992 | CP | Dechloroethylcyclophosphamide 4-Oxocyclophosphamide Carboxyphosphamide Phosphoramide mustard |
Human (iv) | [62] |
| 1992 | CP | Acrolein [dose- and strain-dependency] |
ICR mouse (ip) C57BL/6N mouse (ip) |
[63] |
| 1992 | IF | Isophosphoramide mustard Carboxyifosfamide 2-Dechloroethylifosfamide 3-Dechloroethylifosfamide 4-Oxoifosfamide |
Human (iv) | [26] |
| 1993 | IF | Isophosphoramide mustard Carboxyifosfamide 2-Dechloroethylifosfamide 3-Dechloroethylifosfamide 4-Oxoifosfamide |
Human [children] (iv) | [21, 23] |
| 1994 | CP | 4-Glutathionylcyclophosphamide | Incubation of 4-hydroxy- cyclophosphamide with GSTs and GSH |
[52] |
| Monochloromonoglutathionyl phosphoramide mustard |
Incubation of phosphoramide mustard with GST A1-1 and GSH |
|||
| 1995 | IF | 2-Chloroethylamine 1,3-Oxazolidin-2-one |
Human (iv) | [17] |
| 1995 | IF | Isophosphoramide mustard Carboxyifosfamide 2-Dechloroethylifosfamide 3-Dechloroethylifosfamide 4-Oxoifosfamide |
Human [adults] (iv) | [25] |
| 1995 | IF | Isophosphoramide mustard Aldoifosfamide [NO 4-glutathionyl ifosfamide] |
Incubation of 4- hydroxyifosfamide with GSH |
[14] |
| Monoglutathionyl isophosphoramide mustard |
Incubation of isophosphoramide mustard with GST P1-1 and GSH |
|||
| Diglutathionyl isophosphoramide mustard |
||||
| 1995 | IF | Isophosphoramide mustard 2-Dechloroethylifosfamide 3-Dechloroethylifosfamide Alcoifosfamide 4-Hydroxy-2-dechloroethyl-ifosfamide 4-Hydroxy-3-dechloroethyl-ifosfamide N-Dechloroethylisophosphoramide mustard 2,3-Didechloroethylifosfamide |
Rat (iv) | [64] |
| 1995 | CP | Carboxyphosphamide Dechloroethylcyclophosphamide 4-Oxocyclophosphamide |
Human [children] (iv) | [65] |
| 1996 | acrolein | 3-Hydroxypropylmercaprturic acid 2-Carboxyethylmercapturic acid |
Rat (inhalation) Rat (ip) |
[66] |
| 1998 | IF | 2-Chloroethylamine 2-Dechloroethylifosfamide 3-Dechloroethylifosfamide |
Human (po and iv) | [67] |
2. Materials and Methods
2.1. Materials
IF (ifosfamide), CP (cyclophosphamide), SCMC (S-carboxymethylcysteine), TDGA (thiodiglycolic acid), and 4-nitrobenzoic acid were purchased from Sigma-Aldrich (St. Louis, MO). Solvents and other chemicals were of the highest grade commercially available.
2.2. Animals and treatments
Male C57BL/6 mice were obtained from the NCI-Frederick Animal Production Program. Mice were maintained under standard 12 h light/12 h dark cycle with water and chow provided ad libitum. Handling and treatment was in accordance with an animal study protocol approved by the National Cancer Institute Animal Care and Use Committee. IF (50 mg/kg) and CP (50 mg/kg) were dissolved in saline solution and administered by intraperitoneal injection. Control mice were treated with saline alone. Urine (24 h) samples were collected from mice housed individually in glass metabolic chambers (Jencons, Leighton Buzzard, UK).
2.3. UPLC-ESI-QTOFMS profiling of urinary metabolites
Urine samples were prepared by mixing 10 μl of urine with 90 μl of 50% aqueous acetonitrile and centrifuging at 18,000 x g for 10 min to remove protein and particulates. A 5 μl aliquot of supernatant was injected into a Waters UPLC-ESI-QTOFMS system (Milford, MA). An Acquity UPLC BEH C18 column (Waters) was used to separate chemical components, including IF, CP and their metabolites. The mobile phase was comprised of 0.1% formic acid (A) and acetonitrile containing 0.1% formic acid (B). A 0.5 ml/min flow rate was maintained during a 10 min run. The QTOF Premier mass spectrometer was operated in electrospray positive ionization mode (ESI+). Capillary voltage and cone voltage were maintained at 3 kV and 20 V, respectively. Source temperature and desolvation temperature were set at 120 °C and 350 °C, respectively. Nitrogen was used as both cone gas (50 l/h) and desolvation gas (600 l/h), and argon was used as collision gas. Sulfadimethoxine was used as the lock mass (m/z 311.0814+) for accurate mass calibration in real time. As for MS/MS fragmentation of target ions, collision energy ranging from 10 to 40 eV was applied. Mass chromatograms and mass spectral data were acquired using MassLynx software (Waters) in centroid format. IF, CP and their urinary metabolites were identified through accurate mass measurement and the analysis of the MS/MS fragmentation patterns. Since IF and CP each have two chlorines, IF and CP metabolites could be identified and distinguished from endogenous metabolites based on the chlorine isotope ratio. For example, metabolites containing a single chlorine would be expected to exhibit a chlorine isotope ratio of 3:1. Metabolites containing two chlorines would be expected to have a chlorine isotope ratio of 9:6:1.
2.4. Data processing and multivariate data analysis (MDA)
The mass chromatographic data were deconvoluted using MarkerLynx software (Waters), and a data matrix was generated for MDA. The ion intensity was calculated as the percentage of total ion counts (TIC) in the whole chromatogram. The data matrix was exported into SIMCA-P software (Umetrics, Kinnelon, NJ) for MDA. In order to separate drug metabolites from endogenous metabolites in urine, the integrated ions in vehicle group and treatment group were analyzed using an orthogonal projection to latent structures (OPLS) model. OPLS analysis was conducted to represent the major latent variables in the data matrix and was described in a scores scatter plot after data were Pareto scaled. Identification of IF, CP and their metabolites was performed by analyzing the loadings plot and contribution table, as previously described [34-39]. The general protocol for the identification of xenobiotic metabolites using metabolomics has recently been reviewed [40].
2.5.Tandem LC-MS quantitation of SCMC and TDGA
Samples from IF- or CP-treated mice were prepared by mixing 20 μl of urine with 80 μl of 50% aqueous acetonitrile and centrifuging at 18,000 x g for 10 min. 10 μl was injected for LC-MS/MS analysis. LC-MS/MS analysis was performed on an Applied Biosystems API 2000 ESI triple quadrupole mass spectrometer (Applied Biosystems, Foster City, CA). A Luna 3-μm C18 50 mm x 46 mm internal diameter column (Phenomenex, Torrance, CA) was used to separate SCMC, TDGA, and 4-nitrobenzoic acid (internal standard). The flow rate was 0.2 ml/min with 95% aqueous acetonitrile containing 0.1% formic acid. The mass spectrometer was operated in negative ion (ESI−) mode. The turbo ion spray temperature was maintained at 350 °C, and a voltage of 5 kV was applied to the sprayer needle. Nitrogen was used as the turbo ionspray and nebulizing gas. The detection and quantitation of SCMC, TDGA and 4-nitrobenzoic acid (internal standard) were accomplished by multiple reaction monitoring with the transitions m/z 178.0/77.9 (SCMC), 149.0/92.7 (TDGA) and 165.9/109.6 (4-nitrobenzoic acid).
2.6. Relative quantitation of the metabolites of IF and CP
Although the authentic standards of metabolites were unavailable, it was possible to determine their approximate abundance in the urine. Using several assumptions [38-39], including that the metabolites were equivalently eluted and ionized (ESI+) over the entire chromatographic range, with equivalent degrees of ion suppression, it was possible to approximate the relative excretion of IF, CP, and their metabolites in the urine. These assumptions have been validated in a metabolomics study of the metabolism of (±)-arecoline 1-oxide in the mouse [39]. However, it is accepted that such estimates of relative concentration may be error-prone.
2.7. Statistical analysis
Experimental values are expressed as mean ± standard deviation (S.D.). Statistical analysis was performed using independent Student’s t tests or ANOVA. P-values less than 0.05 were considered significant.
3. Results
3.1. Metabolomic analysis of mouse urine after IF and CP administration
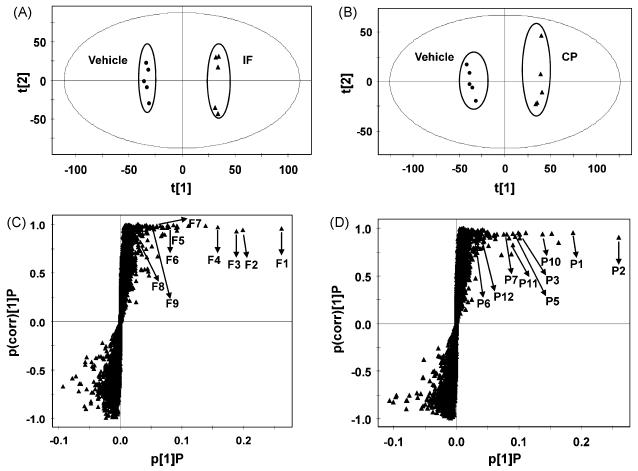
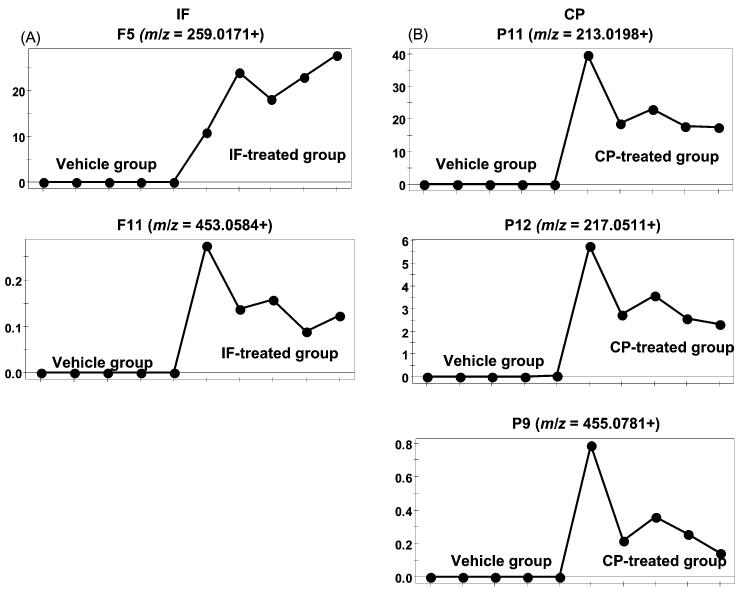
After urine samples from the treated and control groups were analyzed by UPLC-ESI-QTOFMS, data were deconvoluted, and analyzed using OPLS. The advantage of OPLS is that the model is rotated so that class (treated and control) separation is found in the first predictive component, tp, also referred to as the correlated variation [41]. This multivariate model was built to determine the relationship between the treated and control groups, and the contribution of each detected urinary ion to the model. As shown in the scores scatter plot (Fig. 2A-B), urine samples from IF and CP treatment were clearly separated from the control in the first component (t[1]), driven predominantly by the presence of drug and drug-related metabolites (Fig. 2C-D). The trend plots of ions from putative drug-related metabolites were used to display graphically the absence of those ions in vehicle-treated animals (Fig. 3A-E). The increased ions were further determined as drug-related or endogenous metabolites based on the mass defect shifts [42]. In general, the mass defects of phase I and II drug metabolites were over the range of −50 mDa and +50 mDa compared with the parent drug. After drug metabolites were determined, their chemical structures could be elucidated through MS/MS.
Fig. 2.
Identification of urinary IF and CP metabolites through LC-MS-based metabolomics. (A) Scores plot of an OPLS model from control and IF-treated mice. Each point represents an individual mouse urine (B) Scores plot of a OPLS model from control and CP-treated mice. Each point represents an individual mouse urine (C) OPLS loadings S-plot of urinary ions from control and IF-treated mice. Each point represents a urinary ion (D) OPLS loadings S-plot of chemical ions from control and CP-treated mice. Each point represents a urinary ion.
Fig. 3.
Trend plots of ions from novel metabolites in the treatment groups. (A) Novel IF metabolites with m/z values of 259.0171 (F5) and 453.0584 (F11). (B) Novel CP metabolites with m/z values 213.0198 (P11), 217.0511 (P12), and 455.0781 (P9). Note the absence of suspected drug metabolites in the vehicle-treated group. Metabolite codes correspond to those in Fig. 4.
3.2. Identification and structural elucidation of the urinary metabolites of IF and CP
After the metabolites were screened using OPLS and accurate mass measurement, their chemical structures were identified on the basis of the MS/MS fragmentation. Overall, IF (F1), CP (P1) and their 23 metabolites were identified in the urine samples from mice (Tables 2 and 3). Eighteen of them (F2, F3, F4, F6, F7, F8, F9, F10, F12, F13, P2, P3, P4, P5, P6, P7, P8 and P10) are known metabolites, and five of them (F5, F11, P9, P11 and P12) were novel metabolites. MS/MS spectra of the five novel metabolites (F5, F11, P9, P11 and P12) are presented in Fig. 4.
Table 2.
IF metabolites ions identified in the LC-MS-based metabolomic analysis of urine samples from IF-treated mice
| Symbol | Rt (min) | m/z ( ESI+) | Formula | Mass Error (ppm) | Identity | Peak area (Mean ± SD) |
|---|---|---|---|---|---|---|
| F1 | 4.36 | 261.0322 | C7H15Cl2N2O2P | −1.5 | Ifosfamide | 836.0 ± 357.0 |
| F2 | 2.42 | 199.0405 | C5H12ClN2O2P | 1.0 | 2-Dechloroethylifosfamide | 529.0 ± 272.5 |
| F3 | 2.14 | 199.0403 | C5H12ClN2O2P | 0.0 | 3-Dechloroethylifosfamide | 472.2 ± 238.7 |
| F4 | 3.33 | 293.0221 | C7H15Cl2N2O4P | −1.4 | Carboxylifosfamide | 370.8 ± 107.9 |
| F5 | 3.20 | 259.0171 | C7H13Cl2N2O2P | 0.4 | Iminoifosfamide | 113.4 ± 43.9 |
| F6 | 3.51 | 279.0377 | C7H17Cl2N2O3P | −19.7 | Alcoifosfamide | 92.6 ± 53.4 |
| F7 | 3.32 | 275.0170 | C7H13Cl2N2O3P | 18.5 | 4-Ketoifosfamide | 74.6 ± 18.4 |
| F8 | 3.16 | 277.0272 | C7H15Cl2N2O3P | −1.4 | Aldoifosfamide | 11.2 ± 2.2 |
| F9 | 1.69 | 221.0014 | C4H11Cl2N2O2P | 0.5 | Ifosforamide mustard | 17.4 ± 8.2 |
| F10 | 2.78 | 277.0270 | C7H15Cl2N2O3P | −2.2 | 4-Hydroxyifosfamide | 37.4 ± 12.3 |
| F11 | 3.47 | 453.0584 | C13H23Cl2N2O9P | −2.6 | 4-Hydroxyifosfamide glucuronide | 1.5 ± 1.0 |
Table 3.
CP metabolite ions identified in the LC-MS-based metabolomic analysis of urine samples from CP-treated mice
| Symbol | Rt (min) | m/z ( ESI+) | Formula | Mass Error (ppm) | Identity | Peak area (Mean ± SD) |
|---|---|---|---|---|---|---|
| P1 | 4.53 | 261.0333 | C7H15Cl2N2O2P | 2.7 | Cyclophosphamide | 1047.2 ± 311.5 |
| P2 | 3.57 | 293.0227 | C7H15Cl2N2O4P | 0.7 | Carboxyphosphamide | 2105.4 ± 416.9 |
| P3 | 2.42 | 199.0405 | C5H12ClN2O2P | 1.0 | Dechloroethylcyclophosphamide | 333.6 ± 68.3 |
| P4 | 3.81 | 277.0267 | C7H15Cl2N2O3P | −3.2 | Aldophosphamide | 7.6 ± 3.2 |
| P5 | 3.73 | 279.0437 | C7H17Cl2N2O3P | 1.8 | Alcophosphamide | 251.8 ± 27.8 |
| P6 | 3.20 | 259.0171 | C7H13Cl2N2O2P | 0.4 | Iminocyclophosphamide | 31.8 ± 7.7 |
| P7 | 3.32 | 221.0019 | C4H11Cl2N2O2P | 2.7 | Phosphamide mustard | 7.6 ± 4.4 |
| P8 | 3.01 | 277.0279 | C7H15Cl2N2O3P | 1.1 | 4-Hydroxycyclophosphamide | 7.6 ± 2.4 |
| P9 | 3.19 | 455.0781 | C13H25Cl2N2O9P | 2.6 | Alcophosphamide glucuronide | 5.8 ± 1.5 |
| P10 | 3.58 | 275.0100 | C7H13Cl2N2O3P | −6.9 | 4-Ketocyclophosphamide | 455.8 ± 69.3 |
| P11 | 1.83 | 213.0198 | C5H10ClN2O3P | 0.9 | Dechloroethylketocyclophosphamide | 117.2 ± 24.3 |
| P12 | 1.86 | 217.0511 | C5H14ClN2O3P | 0.9 | Dechloroethylalcophosphamide | 23.2 ± 3.8 |
Fig. 4.
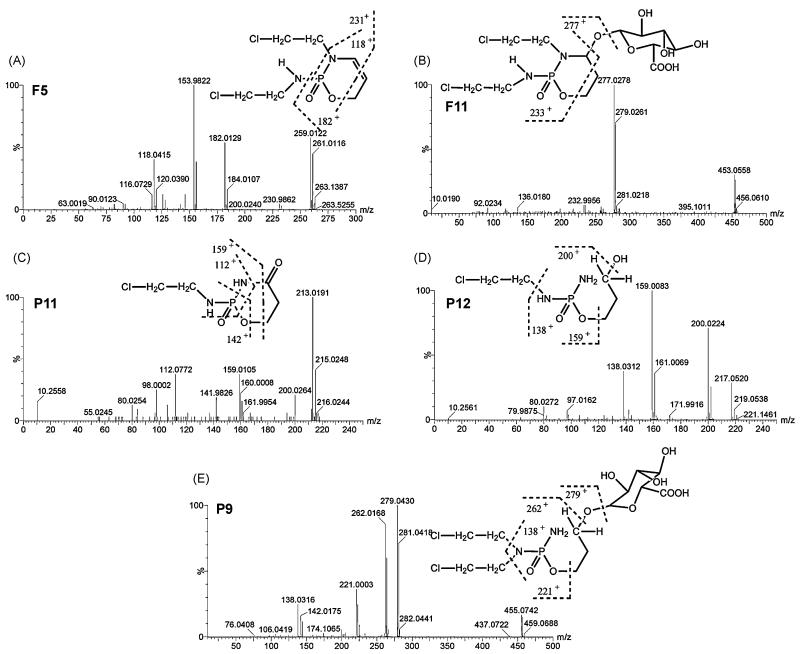
Tandem MS and chemical structures of novel CP and IF metabolites. (A) Iminoifosfamide (F5). (B) 4-Hydroxyifosfamide glucuronide (F11). (C) Dechloroethylketocyclophosphamide (P11). (D) Dechloroethylalcophosphamide (P12). (E) Alcophosphamide glucuronide (P9). Note the chlorine isotope ratios depending on the presence of a one (3:1 ratio) or two (9:6:1) chlorine atoms.
The empirical formula of F5 (iminoifosfamide), a new metabolite of IF, was calculated as C7H13Cl2N2O2P (0.4 ppm mass error) based on the accurate mass measurement, m/z 259.0171+. Compared with the chemical composition of IF (C7H15Cl2N2O2P), it was concluded that F5 was a dehydrogenated form of IF. As seen from Fig. 4A, its molecular ion peak showed three chlorine isotope peaks m/z 259.012+, 261.012+ and 263.138+ with the ratio of ion intensity 9:6:1, showing that F5 contained two chlorines. Tandem mass spectrometry (MS/MS) revealed four major fragment ions at m/z 230.986+, 182.013+, 153.982+ (base peak), 118.042+. The fragment ion at m/z 182.013+ was generated by the cleavage of the exo P-N bond to eliminate one chloroethylamine. The ion at m/z 118.042+ was formed by the elimination of another chloroethyl group. It suggested that the double bond occurred in the oxazaphosphorine ring. The parent ions produced the peak at m/z 230.986+ through the loss of ethylene at the C5-C6 bond of the oxazaphosphorine ring. The base peak at m/z 153.982+ occurred from the ion at m/z 182.013+ by the same cleavage pattern. It was more stable for the double bond between the C4 and C5 than that between the C3 and C4, which was consistent with the base peak. Therefore, F5 was identified as iminoifosfamide.
F11 (4-hydroxyifosfamide glucuronide), a new metabolite of IF, was calculated as C13H23Cl2N2O9P (2.6 ppm mass error) based on the accurate mass measurement, m/z 453.0584+. As seen from Fig. 4B, its molecular ion peak showed three chlorine isotope peaks m/z 453.056, 455.060+ and 457.069+ with the ratio of ion intensity 9:6:1, indicating that F11 contained two chlorines. It was clear that the base peak at m/z 277.028+ was produced from its [M+H]+ ion (m/z 453.056+) by the loss of 176 Da. It was concluded that F11 was the glucuronide conjugate of an hydroxylated metabolite of IF. MS/MS revealed major fragment ions at m/z 232.996+, 136.018+, and 92.023+. The fragment pattern was similar to the metabolite 4-hydroxyifosfamide (F10). Therefore, F11 was identified as 4-hydroxyifosfamide glucuronide.
P9 (alcophosphamide glucuronide), a new metabolite of CP, was calculated as C13H25Cl2N2O9P (2.6 ppm mass error) based on the accurate mass measurement, m/z 455.0765+. As seen from Fig. 4E, its molecular ion showed three chlorine isotope peaks m/z 455.074+, 457.076+ and 459.069+ with the ratio of ion intensity 9:6:1, demonstrating that P9 contained two chlorines. In its MS/MS spectrum, the base peak at m/z 279.043+ was generated from its [M+H]+ ion (m/z 455.074+) by the elimination of 176 Da. It was concluded that P9 was the glucuronide conjugate. MS/MS revealed its major fragments at m/z 262.017+, 221.000+, and 138.032+, which was similar to fragments of the metabolite alcophosphamide (P5). Therefore, P9 was identified as alcophosphamide glucuronide.
P11 (dechloroethylketocyclophosphamide), a novel metabolite of CP, was calculated as C5H10ClN2O3P (0.9 ppm mass error) based on the accurate mass measurement, m/z 213.0198+. Compared with the [M+H]+ ion (m/z 275.010+) of 4-ketocyclophosphamide, P11 was lower by 62 Da than 4-ketocyclophosphamide. N-dechloroethylation was the common pattern in the metabolism of CP through the loss of 62 Da. It was concluded, therefore, that P11 was generated from alcophosphamide through the elimination of the chloroethyl group. As seen from Fig. 4C, its molecular ion peak showed two chlorine isotope peaks m/z 213.019+ and 215.025+ with the ratio of ion intensity 3:1, showing that P11 contained one chlorine. MS/MS revealed its major fragments at m/z 159.011+, 141.983+ and 112.077+, which was similar to the major fragments of 4-ketocyclophosphamide. Therefore, P11 was identified as dechloroethylketocyclophosphamide.
P12 (dechloroethylalcophosphamide), a novel metabolite of CP, was calculated as C5H14ClN2O3P (0.9 ppm mass error) based on the accurate mass measurement, m/z 217.0511+. The [M+H]+ ion of P12 was lower by 62 Da than that of alcophosphamide (m/z 279.0437+). Compared with the metabolite P11, P12 was supposed to be the N-dechloroethylated product of alcophosphamide. As seen in Fig. 4D, its molecular ion showed two chlorine isotope peaks, m/z 217.052+ and 219.054+ with the ratio of ion intensity 3:1, demonstrating that P12 contained only one chlorine. MS/MS revealed its major fragments at m/z 200.022+, 159.008+, and 138.031+. The base peaks at m/z 159.008+ was produced by the cleavage of the -CH2CH2OH group at the C-O bond. The fragment at m/z 200.022+ was generated from the loss of the hydroxyl group. The fragment at m/z 138.031+ was produced from the hydroxylation and chloroethylation of P12. The cleavage pattern was similar to the alcophosphamide. Therefore, P12 was identified as dechloroethylalcophosphamide.
3.3. Estimation of relative concentrations of IF and CP metabolites by chromatographic analysis
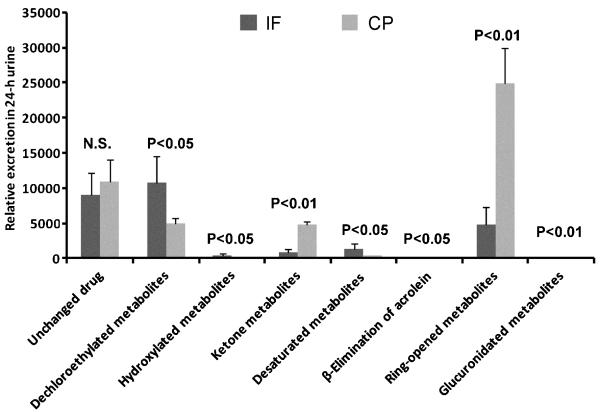
Based on their exact masses, peaks were extracted from the UPLC chromatograms, and areas integrated (Tables 2 and 3). The metabolites of IF and CP were grouped by metabolic transformation, as follows: dechloroethylation, hydroxylation, ketonization, dehydroxylation, alkylation, ring-opening, and conjugation reactions (Table 4). As shown in Fig. 5, the excretion of the unchanged IF in mouse urine was similar to the excretion of CP. The dechloroethylated metabolites of IF were present in higher concentrations than CP (2-fold). The ring-opened and ketonization metabolites of CP were present at higher concentrations than IF (5-fold and 3-fold, respectively). In addition, although the hydroxylated, dehydroxylated, alkylated, and conjugated metabolites were different between IF and CP, their relative abundance in the urine was very low following treatment with either IF or CP.
Table 4.
Major metabolic reactions and corresponding metabolites in mouse urine following treatment with IF and CP
| Metabolic reaction | IF | CP |
|---|---|---|
| Unchanged drug | F1 | P1 |
| Dechloroethylation | F2, F3 | P2, P11, P12 |
| Hydroxylation | F11 | P8 |
| Ketonization | F7 | P10 |
| Desaturation | F5 | P6 |
| β-Elimination of acrolein | F9 | P7 |
| Ring-opening | F4, F6, F8 | P2, P4, P5 |
| Glucuronic acid conjugation | F11 | P9 |
Fig. 5.
Relative quantitation of urinary metabolites from different groups of metabolic pathways in mouse urine following the treatment of IF and CP. Except for unchanged IF and CP, there were significant differences in these metabolites with similar chemical structures from IF and CP. NS, not significant. Note that the β-elimination of acrolein (IF>CP; P<0.05) and glucuronidation (CP>IF; P<0.01) pathways were very minor compared to other pathways, but nevertheless showed statistically significant differences.
3.4. Urinary excretion of SCMC and TDGA
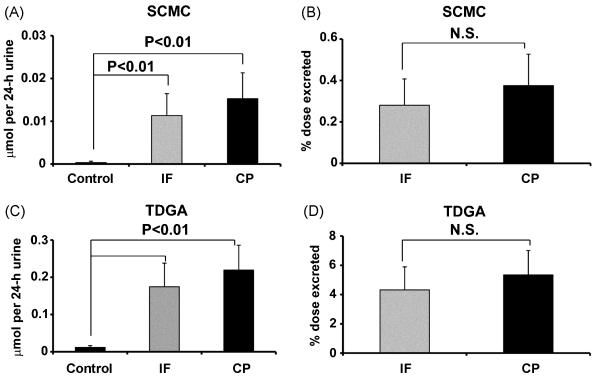
After the treatment of mice with either IF or CP, SCMC (F12) and TDGA (F13) excretion was increased above endogenous levels. Because of their low molecular weight and weak acidity, SCMC and TDGA could be detected in negative ion mode of using UPLC-ESI-QTOF-MS. However, their concentration was determined by triple quadrupole mass spectrometry. From Fig. 6A, it can be seen that SCMC excretion was increased 32-fold and 44-fold in urine above endogenous levels, respectively, after treatment with IF and CP. TDGA excretion was also increased in urine by 14-fold and 17-fold following IF and CP treatment, respectively. Therefore, both isomeric drugs show surprisingly similar profiles with respect to these metabolites.
Fig. 6.
The amount (μmol/24h) and % dose excreted for SCMC and TDGA in 0-24 h mouse urines following treatment with IF and CP. (A) The μmol/24h of SCMC from IF- and CP-treated mice. (B) Percent dose excretion of SCMC from IF- and CP-treated mice. (C) The μmol/24h of TDGA from IF- and CP-treated mice. (D) Percent dose excretion of TDGA from IF- and CP-treated mice. N.S. means not significant. Note the small amounts of SCMC and TDGA excreted in blank (control) 0-24 h mouse urines.
4. Discussion
Metabolomics is an invaluable tool for profiling biological fluids for small molecules, and with respect to pharmacology, metabolomics has provided substantial insight into drug metabolism pathways. For example, the metabolic map of acetaminophen (which had been studied for over 40 years) was recently expanded by three metabolites [37]. Similarly, the metabolic maps of IF and CP were expanded (two IF and three CP new metabolites) and 18 known metabolites that otherwise had taken over 40 years to identify (Table 1) are also reported here. This demonstrates the power of UPLC-ESI-QTOFMS-based metabolomics applied to the study of drug metabolism.
IF and CP are prodrugs that are converted to their active forms during metabolic biotransformation [43]. Their biological activity is mediated through their active metabolites, including 4-hydroxyifosfamide and 4-hydroxycyclophosphamide, both of which were detected in this study. Because of their respective equilibrium with aldoifosfamide and aldophosphamide, a minor amount of 4-hydroxyifosfamide and 4-hydroxyclophosphamide were excreted in the urine. Aldoifosfamide was both reduced and oxidized to alcoifosfamide and carboxyifosfamide, respectively, presumably by the action of alcohol dehydrogenase and aldehyde dehydrogenase [26]. In a similar manner, aldophosphamide was both reduced and oxidized to alcophosphamide and carboxyphosphamide, respectively [44]. It can be seen from Fig. 5 that ring-opened metabolites were produced to a greater extent from CP than from IF, and this was the major difference between the two drugs. However, in compensation, the dechloroethylated metabolites of IF were excreted to a greater extent than from CP. SCMC and TDGA, both normal products of endogenous metabolism, were found at low concentrations in control urine. Following treatment with IF and CP, SCMC and TDGA were significantly elevated in vivo (Fig. 6). It is known that CAA can lead to the formation of SCMC through conjugation with cysteine or glutathione, and SCMC is further transformed to TDGA [45]. SCMC has been reported to activate the α-amino-3-hydroxy-5-methyl-4-isoxazolepropionic acid (AMPA)/kainite receptor and induce cellular acidification which may be responsible for the reported encephalopathy [46-47]. In addition, TDGA can cause mitochondrial dysfunction which may also contribute to the side-effects associated with IF treatment [48]. However, there have been no reports that SCMC and TDGA resulting from the treatment by CP lead to toxicity. Here, SCMC and TDGA were detected in urine from the CP-treated mice. The generation of CAA from IF was greater than from CP, according to the significantly higher rate of N-dechloroethylation of IF (Fig. 5) Surprisingly therefore, there were no significant differences in SCMC and TDGA production in IF- and CP-treated mice (Fig. 6B and D). However, it was previously reported that TDGA is the major urinary metabolite in cancer patients treated with IF and this was suggested as the causative IF metabolite of encephalopathy [48]. Apparently, TDGA is an inconsequential urinary metabolite of CP (A. Küpfer, unpublished observation). However, TDGA was determined in these human studies by lyophilization and derivatization of urines with BF3/methanol at 60°C, in contrast to the studies described here where diluted urines were injected directly into the tandem mass spectrometer. It is therefore possible that TDGA is formed during the heating process, either by spontaneous decarboxylation of the α-keto acid of SCMC (S-carboxymethyl-3-thiopyruvic acid; SCMTPA) [46-47] or from an acid- or heat-labile ester, such as the carnitine ester of TDGA.
Previous studies suggested that IF treatment resulted in changes in the excretion patterns of low molecular weight endogenous metabolites (hippuric acid, trimethylamine N-oxide, glycine, lactate, histidine and glucose), which were regarded as biomarkers of IF nephrotoxicity and encephalopathy [49]. The current findings suggest that IF-induced side-effects may result directly from CAA rather than from SCMC and TDGA. Studies have reported that CAA can result in neurotoxicity and nephrotoxicity [50-51]. This observation may offer one potential mechanism to explain IF-related neurotoxicity and nephrotoxicity.
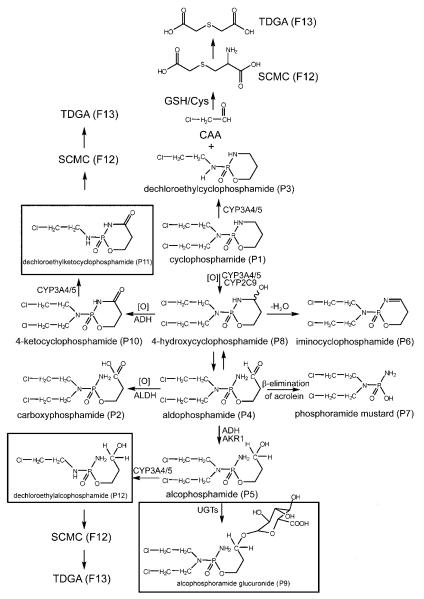
Despite the large number of published in vitro and in vivo CP and IFO metabolism studies, five novel metabolites (F5, F11, P9, P11 and P12) were found by metabolomic analysis in this study. Iminoifosfamide from IF corresponded to iminocyclophosphamide (F6) from CP. Previous studies reported some conjugated metabolites with GSH from IF and CP, such as ifosforamide mustard and cyclophosphamide [14, 52]. However, there was no GSH conjugation detected in either urine and serum. Here, two minor glucuronide conjugate metabolites (F11 and P9) were found from IF- and CP-treated mice. Furthermore, two new N-dechloroethylated (P11 and P12) metabolites from CP were found in the urine (Fig. 8). Inspection of the loadings S-plot in Fig. 2D suggests that P11 has a similar abundance to the principal N-dechloroethylated metabolite P3, while P12 is a much more minor metabolite.
Fig. 8.
Major in vivo CP metabolic pathways showing the enzyme systems that are believed to produce each metabolite. Boxed structures represent novel metabolites.
The metabolomic studies described here were carried out in the mouse. As shown in Table 1, rat and human have been the principal species studied historically for CP and IF metabolism. There are relatively few data in the mouse. Nevertheless, the value of the mouse is that future studies may be conducted in genetically modified mice, that permit direct questions to be asked about the role of discrete enzymes and the nuclear receptors that control their expression in the liver and other tissues [33]. It may be envisaged that data from mice humanized for CP and IF metabolizing enzyme genes could be compared with actual clinical data for these drugs, thus refining and improving animal modeling of cancer chemotherapy.
In conclusion, the present study investigated IF and CP in mice using a metabolomic approach, which gave a comprehensive understanding of their metabolism in vivo. Twenty three urinary metabolites, including five novel drug metabolites, were identified and structurally elucidated by mass fragmentography. Their metabolic pathways in vivo were presented. Although they went through similar metabolic processes, the amount of metabolites in urine was significantly different between IF and CP, in particular, the N-dechloroethylated and ring-opened metabolites. SCMC and TDGA, that have been regarded as the toxic metabolites, specifically of IF [46-48], were also found in similar amounts in the urine of IF- and CP-treated mice. Future studies are needed to examine the potential of CAA, SCMTPA or TDGA carnitine ester to be the causative factors in IF-associated neuro- and nephrotoxicity.
Fig. 7.
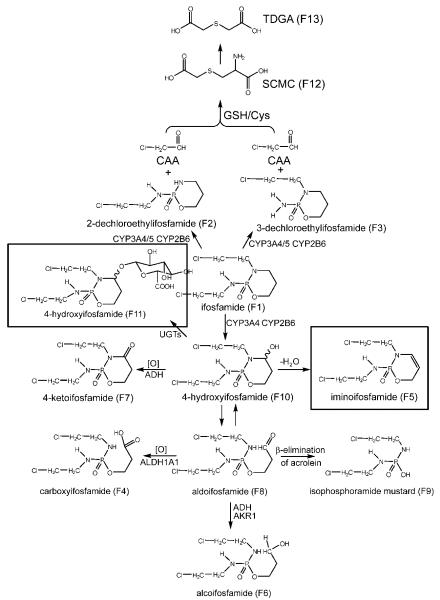
Major in vivo IF metabolic pathways showing the enzyme systems that are believed to produce each metabolite. Boxed structures represent novel metabolites.
Acknowledgements
This work was supported in part by the Intramural Research Program of the Center for Cancer Research, National Cancer Institute, National Institutes of Health. JRI is grateful to the U.S. Smokeless Tobacco Company for a grant for collaborative research. The authors thank Professor Adrian Küpfer, University of Bern, for helpful discussions.
Footnotes
Publisher's Disclaimer: This is a PDF file of an unedited manuscript that has been accepted for publication. As a service to our customers we are providing this early version of the manuscript. The manuscript will undergo copyediting, typesetting, and review of the resulting proof before it is published in its final citable form. Please note that during the production process errors may be discovered which could affect the content, and all legal disclaimers that apply to the journal pertain.
References
- [1].Druckrey H, Raabe S. Specific chemotherapy of carcinoma of the prostate. Klin Wochenschr. 1952;30:882–4. doi: 10.1007/BF01471475. [DOI] [PubMed] [Google Scholar]
- [2].Arnold H, Bourseaux F, Brock N. Chemotherapeutic action of a cyclic nitrogen mustard phosphamide ester (B 518-ASTA) in experimental tumours of the rat. Nature. 1958;181:931. doi: 10.1038/181931a0. [DOI] [PubMed] [Google Scholar]
- [3].Brock N, Hohorst HJ. Metabolism of cyclophosphamide. Cancer. 1967;20:900–4. doi: 10.1002/1097-0142(1967)20:5<900::aid-cncr2820200552>3.0.co;2-y. [DOI] [PubMed] [Google Scholar]
- [4].Sladek NE. Evidence for an aldehyde possessing alkylating activity as the primary metabolite of cyclophosphamide. Cancer Res. 1973;33:651–8. [PubMed] [Google Scholar]
- [5].Hill DL, Laster WR, Jr., Struck RF. Enzymatic metabolism of cyclophosphamide and nicotine and production of a toxic cyclophosphamide metabolite. Cancer Res. 1972;32:658–65. [PubMed] [Google Scholar]
- [6].Alarcon RA, Meienhofer J. Formation of the cytotoxic aldehyde acrolein during In vitro degradation of cyclophosphamide. Nature New Biol. 1971;233:250–2. doi: 10.1038/newbio233250b0. [DOI] [PubMed] [Google Scholar]
- [7].Connors TA, Cox PJ, Farmer PB, Foster AB, Jarman M. Some studies of the active intermediates formed in the microsomal metabolism of cyclophosphamide and isophosphamide. Biochem Pharmacol. 1974;23:115–29. doi: 10.1016/0006-2952(74)90318-9. [DOI] [PubMed] [Google Scholar]
- [8].Colvin M, Padgett CA, Fenselau C. A biologically active metabolite of cyclophosphamide. Cancer Res. 1973;33:915–8. [PubMed] [Google Scholar]
- [9].Struck RF, Kirk MC, Mellett LB, el Dareer S, Hill DL. Urinary metabolites of the antitumor agent cyclophosphamide. Mol Pharmacol. 1971;7:519–29. [PubMed] [Google Scholar]
- [10].Fenselau C, Lehman JP, Myles A, Brandt J, Yost GS, Friedman OM, et al. Iminocyclophosphamide as a chemically reactive metabolite of cyclophosphamide. Drug Metab Dispos. 1982;10:636–40. [PubMed] [Google Scholar]
- [11].Struck RF, Kirk MC, Witt MH, Laster WR., Jr. Isolation and mass spectral identification of blood metabolites of cyclophosphamide: evidence for phosphoramide mustard as the biologically active metabolite. Biomed Mass Spectrom. 1975;2:46–52. doi: 10.1002/bms.1200020109. [DOI] [PubMed] [Google Scholar]
- [12].Brock N. New nitrogen mustard phosphamide esters and their cytostatic activity. Laval Med. 1968;39:696–701. [PubMed] [Google Scholar]
- [13].Alarcon RA, Meienhofer J, Atherton E. Isophosphamide as a new acrolein-producing antineoplastic isomer of cyclophosphamide. Cancer Res. 1972;32:2519–23. [PubMed] [Google Scholar]
- [14].Dirven HA, Megens L, Oudshoorn MJ, Dingemanse MA, van Ommen B, van Bladeren PJ. Glutathione conjugation of the cytostatic drug ifosfamide and the role of human glutathione S-transferases. Chem Res Toxicol. 1995;8:979–86. doi: 10.1021/tx00049a012. [DOI] [PubMed] [Google Scholar]
- [15].Norpoth K. Studies on the metabolism of isophosphamide (NSC-109724) in man. Cancer Treat Rep. 1976;60:437–43. [PubMed] [Google Scholar]
- [16].Goren MP, Wright RK, Pratt CB, Pell FE. Dechloroethylation of ifosfamide and neurotoxicity. Lancet. 1986;2:1219–20. doi: 10.1016/s0140-6736(86)92227-0. [DOI] [PubMed] [Google Scholar]
- [17].Highley MS, Momerency G, Van Cauwenberghe K, Van Oosterom AT, de Bruijn EA, Maes RA, et al. Formation of chloroethylamine and 1,3-oxazolidine-2-one following ifosfamide administration in humans. Drug Metab Dispos. 1995;23:433–7. [PubMed] [Google Scholar]
- [18].Norpoth K, Raidt H, Witting U, Muller G, Norpoth R. Side chain oxidation of ifosfamide in man. Klin Wochenschr. 1975;53:1075–6. doi: 10.1007/BF01614384. [DOI] [PubMed] [Google Scholar]
- [19].Shaw IC, Graham MI, McLean AE. 2-Chloroacetaldehyde: a metabolite of cyclophosphamide in the rat. Cancer Treat Rev. 1983;10(Suppl A):17–24. doi: 10.1016/s0305-7372(83)80003-6. [DOI] [PubMed] [Google Scholar]
- [20].Shaw IC, Graham MI, McLean AE. 2-Chloroacetaldehyde, a metabolite of cyclophosphamide in the rat. Xenobiotica. 1983;13:433–7. doi: 10.3109/00498258309052281. [DOI] [PubMed] [Google Scholar]
- [21].Boddy AV, Yule SM, Wyllie R, Price L, Pearson AD, Idle JR. Pharmacokinetics and metabolism of ifosfamide administered as a continuous infusion in children. Cancer Res. 1993;53:3758–64. [PubMed] [Google Scholar]
- [22].Boddy AV, Yule SM, Wyllie R, Price L, Pearson AD, Idle JR. Comparison of continuous infusion and bolus administration of ifosfamide in children. Eur J Cancer. 1995;31A:785–90. doi: 10.1016/0959-8049(95)00090-6. [DOI] [PubMed] [Google Scholar]
- [23].Boddy AV, Yule SM, Wyllie R, Price L, Pearson AD, Idle JR. Intrasubject variation in children of ifosfamide pharmacokinetics and metabolism during repeated administration. Cancer Chemother Pharmacol. 1996;38:147–54. doi: 10.1007/s002800050463. [DOI] [PubMed] [Google Scholar]
- [24].Boddy AV, Cole M, Pearson AD, Idle JR. The kinetics of the auto-induction of ifosfamide metabolism during continuous infusion. Cancer Chemother Pharmacol. 1995;36:53–60. doi: 10.1007/BF00685732. [DOI] [PubMed] [Google Scholar]
- [25].Boddy AV, Proctor M, Simmonds D, Lind MJ, Idle JR. Pharmacokinetics, metabolism and clinical effect of ifosfamide in breast cancer patients. Eur J Cancer. 1995;31A:69–76. doi: 10.1016/0959-8049(94)00300-t. [DOI] [PubMed] [Google Scholar]
- [26].Martino R, Crasnier F, Chouini-Lalanne N, Gilard V, Niemeyer U, De Forni M, et al. A new approach to the study of ifosfamide metabolism by the analysis of human body fluids with 31P nuclear magnetic resonance spectroscopy. J Pharmacol Exp Ther. 1992;260:1133–44. [PubMed] [Google Scholar]
- [27].Brock N, Pohl J, Stekar J. Detoxification of urotoxic oxazaphosphorines by sulfhydryl compounds. J Cancer Res Clin Oncol. 1981;100:311–20. doi: 10.1007/BF00410691. [DOI] [PMC free article] [PubMed] [Google Scholar]
- [28].Brock N, Stekar J, Pohl J, Niemeyer U, Scheffler G. Acrolein, the causative factor of urotoxic side-effects of cyclophosphamide, ifosfamide, trofosfamide and sufosfamide. Arzneimittelforschung. 1979;29:659–61. [PubMed] [Google Scholar]
- [29].Aeschlimann C, Cerny T, Kupfer A. Inhibition of (mono)amine oxidase activity and prevention of ifosfamide encephalopathy by methylene blue. Drug Metab Dispos. 1996;24:1336–9. [PubMed] [Google Scholar]
- [30].Kupfer A, Aeschlimann C, Cerny T. Methylene blue and the neurotoxic mechanisms of ifosfamide encephalopathy. Eur J Clin Pharmacol. 1996;50:249–52. doi: 10.1007/s002280050102. [DOI] [PubMed] [Google Scholar]
- [31].Dubourg L, Michoudet C, Cochat P, Baverel G. Human kidney tubules detoxify chloroacetaldehyde, a presumed nephrotoxic metabolite of ifosfamide. J Am Soc Nephrol. 2001;12:1615–23. doi: 10.1681/ASN.V1281615. [DOI] [PubMed] [Google Scholar]
- [32].Loqueviel C, Malet-Martino M, Martino R. A 13C NMR study of 2-(13)C-chloroacetaldehyde, a metabolite of ifosfamide and cyclophosphamide, in the isolated perfused rabbit heart model. Initial observations on its cardiotoxicity and cardiac metabolism. Cell Mol Biol (Noisy-le-grand) 1997;43:773–82. [PubMed] [Google Scholar]
- [33].Cheung C, Gonzalez FJ. Humanized mouse lines and their application for prediction of human drug metabolism and toxicological risk assessment. J Pharmacol Exp Ther. 2008;327:288–99. doi: 10.1124/jpet.108.141242. [DOI] [PMC free article] [PubMed] [Google Scholar]
- [34].Chen C, Ma X, Malfatti MA, Krausz KW, Kimura S, Felton JS, et al. A comprehensive investigation of 2-amino-1-methyl-6-phenylimidazo[4,5-b]pyridine (PhIP) metabolism in the mouse using a multivariate data analysis approach. Chem Res Toxicol. 2007;20:531–42. doi: 10.1021/tx600320w. [DOI] [PMC free article] [PubMed] [Google Scholar]
- [35].Ma X, Chen C, Krausz KW, Idle JR, Gonzalez FJ. A metabolomic perspective of melatonin metabolism in the mouse. Endocrinology. 2008;149:1869–79. doi: 10.1210/en.2007-1412. [DOI] [PMC free article] [PubMed] [Google Scholar]
- [36].Chen C, Meng L, Ma X, Krausz KW, Pommier Y, Idle JR, et al. Urinary metabolite profiling reveals CYP1A2-mediated metabolism of NSC686288 (aminoflavone) J Pharmacol Exp Ther. 2006;318:1330–42. doi: 10.1124/jpet.106.105213. [DOI] [PMC free article] [PubMed] [Google Scholar]
- [37].Chen C, Krausz KW, Idle JR, Gonzalez FJ. Identification of novel toxicity-associated metabolites by metabolomics and mass isotopomer analysis of acetaminophen metabolism in wild-type and Cyp2e1-null mice. J Biol Chem. 2008;283:4543–59. doi: 10.1074/jbc.M706299200. [DOI] [PMC free article] [PubMed] [Google Scholar]
- [38].Giri S, Idle JR, Chen C, Zabriskie TM, Krausz KW, Gonzalez FJ. A metabolomic approach to the metabolism of the areca nut alkaloids arecoline and arecaidine in the mouse. Chem Res Toxicol. 2006;19:818–27. doi: 10.1021/tx0600402. [DOI] [PMC free article] [PubMed] [Google Scholar]
- [39].Giri S, Krausz KW, Idle JR, Gonzalez FJ. The metabolomics of (+/−)-arecoline 1-oxide in the mouse and its formation by human flavin-containing monooxygenases. Biochem Pharmacol. 2007;73:561–73. doi: 10.1016/j.bcp.2006.10.017. [DOI] [PubMed] [Google Scholar]
- [40].Patterson AD, Gonzalez FJ, Idle JR. Xenobiotic metabolism: A view through the metabolometer. Chem Res Toxicol. 2010 doi: 10.1021/tx100020p. doi: 10.1021/tx100020p. [DOI] [PMC free article] [PubMed] [Google Scholar]
- [41].Wiklund S, Johansson E, Sjostrom L, Mellerowicz EJ, Edlund U, Shockcor JP, et al. Visualization of GC/TOF-MS-based metabolomics data for identification of biochemically interesting compounds using OPLS class models. Anal Chem. 2008;80:115–22. doi: 10.1021/ac0713510. [DOI] [PubMed] [Google Scholar]
- [42].Zhang H, Zhang D, Ray K, Zhu M. Mass defect filter technique and its applications to drug metabolite identification by high-resolution mass spectrometry. J Mass Spectrom. 2009;44:999–1016. doi: 10.1002/jms.1610. [DOI] [PubMed] [Google Scholar]
- [43].Zhang J, Tian Q, Yung Chan S, Chuen Li S, Zhou S, Duan W, et al. Metabolism and transport of oxazaphosphorines and the clinical implications. Drug Metab Rev. 2005;37:611–703. doi: 10.1080/03602530500364023. [DOI] [PubMed] [Google Scholar]
- [44].Joqueviel C, Martino R, Gilard V, Malet-Martino M, Canal P, Niemeyer U. Urinary excretion of cyclophosphamide in humans, determined by phosphorus-31 nuclear magnetic resonance spectroscopy. Drug Metab Dispos. 1998;26:418–28. [PubMed] [Google Scholar]
- [45].Steventon GB. Diurnal variation in the metabolism of S-carboxymethyl-L-cysteine in humans. Drug Metab Dispos. 1999;27:1092–7. [PubMed] [Google Scholar]
- [46].Chatton JY, Idle JR, Vagbo CB, Magistretti PJ. Insights into the mechanisms of ifosfamide encephalopathy: drug metabolites have agonistic effects on alpha-amino-3-hydroxy-5-methyl-4-isoxazolepropionic acid (AMPA)/kainate receptors and induce cellular acidification in mouse cortical neurons. J Pharmacol Exp Ther. 2001;299:1161–8. [PubMed] [Google Scholar]
- [47].Lerch S, Kupfer A, Idle JR, Lauterburg BH. Cerebral formation in situ of S-carboxymethylcysteine after ifosfamide administration to mice: a further clue to the mechanism of ifosfamide encephalopathy. Toxicol Lett. 2006;161:188–94. doi: 10.1016/j.toxlet.2005.09.002. [DOI] [PubMed] [Google Scholar]
- [48].Visarius TM, Bahler H, Kupfer A, Cerny T, Lauterburg BH. Thiodiglycolic acid is excreted by humans receiving ifosfamide and inhibits mitochondrial function in rats. Drug Metab Dispos. 1998;26:193–6. [PubMed] [Google Scholar]
- [49].Foxall PJ, Singer JM, Hartley JM, Neild GH, Lapsley M, Nicholson JK, et al. Urinary proton magnetic resonance studies of early ifosfamide-induced nephrotoxicity and encephalopathy. Clin Cancer Res. 1997;3:1507–18. [PubMed] [Google Scholar]
- [50].Springate JE. Ifosfamide metabolite chloroacetaldehyde causes renal dysfunction in vivo. J Appl Toxicol. 1997;17:75–9. doi: 10.1002/(sici)1099-1263(199701)17:1<75::aid-jat397>3.0.co;2-c. [DOI] [PubMed] [Google Scholar]
- [51].Woodland C, Ito S, Granvil CP, Wainer IW, Klein J, Koren G. Evidence of renal metabolism of ifosfamide to nephrotoxic metabolites. Life Sci. 2000;68:109–17. doi: 10.1016/s0024-3205(00)00915-2. [DOI] [PubMed] [Google Scholar]
- [52].Dirven HA, van Ommen B, van Bladeren PJ. Involvement of human glutathione S-transferase isoenzymes in the conjugation of cyclophosphamide metabolites with glutathione. Cancer Res. 1994;54:6215–20. [PubMed] [Google Scholar]
- [53].Rauen HM, Norpoth K. High tension electrophoretic studies on metabolites of N,N-bis(2-chlorethyl)-N’,O-propylenephosphoric acid ester-diamide from the serum of rats. Arzneimittelforschung. 1967;17:599–602. [PubMed] [Google Scholar]
- [54].Norpoth K, Addicks HW, Witting U, Muller G, Raidt H. Quantitative determination of cyclophosphamide, ifosfamide, and trofosfamide and their stable metabolites on TLC-plates with the aid of 4-pyridine-aldehyde-2-benzothiazolyl-hydrazone (PBH) (author’s transl) Arzneimittelforschung. 1975;25:1331–6. [PubMed] [Google Scholar]
- [55].Cox PJ, Levin L. Novel metabolic products of cyclophosphamide in human urine. Biochem Pharmacol. 1975;24:1233–5. doi: 10.1016/0006-2952(75)90068-4. [DOI] [PubMed] [Google Scholar]
- [56].Alarcon RA. Studies on the in vivo formation of acrolein: 3-hydroxy-propylmercapturic acid as an index of cyclophosphamide (NSC-26271) activation. Cancer Treat Rep. 1976;60:327–35. [PubMed] [Google Scholar]
- [57].Voelcker G, Wagner T, Hohorst HJ. Identification and pharmacokinetics of cyclophosphamide (NSC-26271) metabolites in vivo. Cancer Treat Rep. 1976;60:415–22. [PubMed] [Google Scholar]
- [58].Jardine I, Fenselau C, Appler M, Kan MN, Brundrett RB, Colvin M. Quantitation by gas chromatography-chemical ionization mass spectrometry of cyclophosphamide, phosphoramide mustard, and nornitrogen mustard in the plasma and urine of patients receiving cyclophosphamide therapy. Cancer Res. 1978;38:408–15. [PubMed] [Google Scholar]
- [59].Chan KK, Hong SC, Watson E, Deng SK. Identification of new metabolites of phosphoramide and nor-nitrogen mustards and cyclophosphamide in rat urine using ion cluster techniques. Biomed Environ Mass Spectrom. 1986;13:145–54. doi: 10.1002/bms.1200130310. [DOI] [PubMed] [Google Scholar]
- [60].Hadidi AH, Coulter CE, Idle JR. Phenotypically deficient urinary elimination of carboxyphosphamide after cyclophosphamide administration to cancer patients. Cancer Res. 1988;48:5167–71. [PubMed] [Google Scholar]
- [61].Hadidi AH, Idle JR. Combined thin-layer chromatography-photography-densitometry for the quantitation of cyclophosphamide and its four principal urinary metabolites. J Chromatogr. 1988;427:121–30. doi: 10.1016/0378-4347(88)80110-5. [DOI] [PubMed] [Google Scholar]
- [62].Boddy AV, Idle JR. Combined thin-layer chromatography-photography-densitometry for the quantification of ifosfamide and its principal metabolites in urine, cerebrospinal fluid and plasma. J Chromatogr. 1992;575:137–42. doi: 10.1016/0378-4347(92)80514-q. [DOI] [PubMed] [Google Scholar]
- [63].Fraiser L, Kehrer JP. Murine strain differences in metabolism and bladder toxicity of cyclophosphamide. Toxicology. 1992;75:257–72. doi: 10.1016/0300-483x(92)90007-2. [DOI] [PubMed] [Google Scholar]
- [64].Wang JJ, Chan KK. Analysis of ifosfamide, 4-hydroxyifosfamide, N2-dechloroethylifosfamide, N3-dechloroethylifosfamide and iphosphoramide mustard in plasma by gas chromatography-mass spectrometry. J Chromatogr B Biomed Appl. 1995;674:205–17. doi: 10.1016/0378-4347(95)00309-6. [DOI] [PubMed] [Google Scholar]
- [65].Yule SM, Boddy AV, Cole M, Price L, Wyllie R, Tasso MJ, et al. Cyclophosphamide metabolism in children. Cancer Res. 1995;55:803–9. [PubMed] [Google Scholar]
- [66].Linhart I, Frantik E, Vodickova L, Vosmanska M, Smejkal J, Mitera J. Biotransformation of acrolein in rat: excretion of mercapturic acids after inhalation and intraperitoneal injection. Toxicol Appl Pharmacol. 1996;136:155–60. doi: 10.1006/taap.1996.0019. [DOI] [PubMed] [Google Scholar]
- [67].Aeschlimann C, Kupfer A, Schefer H, Cerny T. Comparative pharmacokinetics of oral and intravenous ifosfamide/mesna/methylene blue therapy. Drug Metab Dispos. 1998;26:883–90. [PubMed] [Google Scholar]


