Abstract
Objective
The aim of this report is to provide accurate nationwide epidemiologic data on primary central nervous system (CNS) tumors in Korea. Despite its importance, there are no accurate statistics on primary CNS tumors in Korea. We analyzed primary CNS tumors diagnosed in 2005 from the nationwide registry.
Methods
Data on primary CNS tumors diagnosed in 2005 were collected from the Korean Central Cancer Registry and the Korean Brain Tumor Society. Crude and age-standardized rates were calculated in terms of gender, age, and histological type. Tumors of uncertain histology were investigated individually at the corresponding hospitals and had their diagnoses confirmed.
Results
A total of 5,692 patients diagnosed with primary CNS tumors in 2005 were included in this study. CNS tumors occurred in females more often than in males (female to male, 1.43 : 1). The most common tumor was meningioma (31.2%). Glioblastoma accounted for 30.7% of all gliomas, and 19.3% of all malignant primary CNS tumors. In children under 19 years of age, both germ cell tumor and embryonal/primitive/medulloblastoma were the most common tumors.
Conclusion
This article is the first nationwide primary CNS tumor epidemiology report in Korea. Data from this study should provide valuable information regarding the understanding of primary CNS tumors epidemiology in Korea.
Keywords: Epidemiology, Brain, Central nervous system, Tumor, Registry, Korea
INTRODUCTION
The conventional definition of central nervous system (CNS) tumors is generally applied to tumors of the brain and spine. However, the International Classification of Diseases for Oncology, Third Edition (ICD-O-3) defined tumors of the meninges, pituitary gland, pineal gland and nerves as CNS tumors7). Brain tumors are defined as neoplasms of the brain parenchyme on the basis of ICD-O-3. CNS tumors in this report encompass both brain and CNS tumors.
Primary CNS tumors are not common. However, the incidence of CNS tumors has increased rapidly2,3,10). These tumors may result in mental alteration and neurologic deficits, and the social burden of CNS tumors is just as large as that of other tumors. Therefore, an accurate understanding of the epidemiology is needed to facilitate early detection/treatment and prevention of CNS tumors. Many countries have established CNS tumors registries, and their descriptive epidemiologies have been reported2,3,6,8,9,15). However, there is yet no accurate nationwide CNS tumor epidemiology in Korea that makes policy-making for tumor screening and early treatment difficult. There have been several trials investigating factors associated with CNS tumors in Korea. However, these studies have been limited to a small number of cases diagnosed in the hospital setting4,5,11,12,14). In 2002, the Korean Neuropathology Study Group analyzed 3,221 cases of CNS tumors diagnosed in 13 centers between 1997 and 199814). Unfortunately, there was no nationwide data available in Korea on CNS tumors at that time.
The Korean Ministry of Health and Welfare started a nationwide, hospital-based cancer registry (Korean Central Cancer Registry, KCCR) in 1980. In 2005, the first national brain cancer statistics encompassing the years between 1999 and 2001 were reported by the KCCR13). The KCCR database is especially useful for showing trends of cancer occurrence in Korea. However, it only provides the incidence of malignant CNS tumors, excluding benign and borderline tumors. Since benign tumors can recur and may be inoperable, non-malignant brain tumors may impose the same cost on the society in terms of medical care and case fatality as malignant brain tumors.
The KCCR and the Brain Tumors Registration Committee (BTRC) of the Korean Brain Tumor Society together estimated the incidence of CNS tumors. In 2004, the KCCR revised its criteria for cancer registration in order to include benign and borderline tumors of the CNS. Such criteria were applied to newly diagnosed cases from 2005.
The objective of this report is to provide an accurate nationwide statistics of primary CNS tumors, inclusive of benign, borderline and malignant tumors in Korea.
MATERIALS AND METHODS
CNS tumor registration
A total of 5,473 cases were registered by 265 hospitals. On reviewing medical records, 266 patients omitted previously were added. Basic information such as the demographic characteristics of patients, date of diagnosis, tools of diagnosis, originating site and histological type according to the ICD-O-3 were included7).
We conducted an ad hoc survey on cases histologically unconfirmed by the BTRC, and 2,812 cases of uncertain histology were referred to each hospital for revision and correction. There were 47 records deleted from the final data analysis : 9 cases invalid site/histology combination and 38 cases confirmed to be non-brain tumors after the survey. As a result, a total of 5,692 cases of newly diagnosed CNS tumors were reported.
The histological verification rate was 58.7%. The radiologic diagnosis rate was 33.0%. The proportion of cases registered based on death certificates only (DCO%) was 6.6%. Pituitary tumor, craniopharyngioma, meningioma, lymphoma, subependymal giant cell astrocytoma were included, without histological confirmation.
Data processing
Primary CNS tumors with the following ICD-O-3 site codes were included in the analysis : brain (C71.0-C71.9), meninges (C70.0-C70.9), spinal cord, cranial nerves and other parts of the CNS (C72.0-C72.9), and pituitary gland, craniopharyngeal duct and pineal gland (C75.1-C75.3). Their behavior was also classified by the ICD-O-3 code, which are divided into 3 groups : benign, uncertain whether benign or malignant, and malignant. Tumors with behavior codes (fifth digit ICD-O morphology) 0, 1 and 3, respectively, were also included. Histology groupings were based on the classification of the Central Brain Tumor Registry of the United States (CBTRUS)3). These groupings were broadly based on the World Health Organization (WHO) categories for brain tumors.
The population size used as a denominator to calculate cancer incidence was the midyear population on 1 July. In this report, we modified the registered population released annually from the national statistics office to obtain the midyear population1). Childhood tumors were defined as those diagnosed in patients less than 19 years of age.
Definition of rates
Incidence measures the occurrence of newly diagnosed cases of disease. Crude Rate is the rate of disease in an entire population. Crude rate is frequently adjusted for age to age-standardized rate to a common standard population, which allows for rate comparisons across regions with different age structures.
RESULTS
Overall incidence
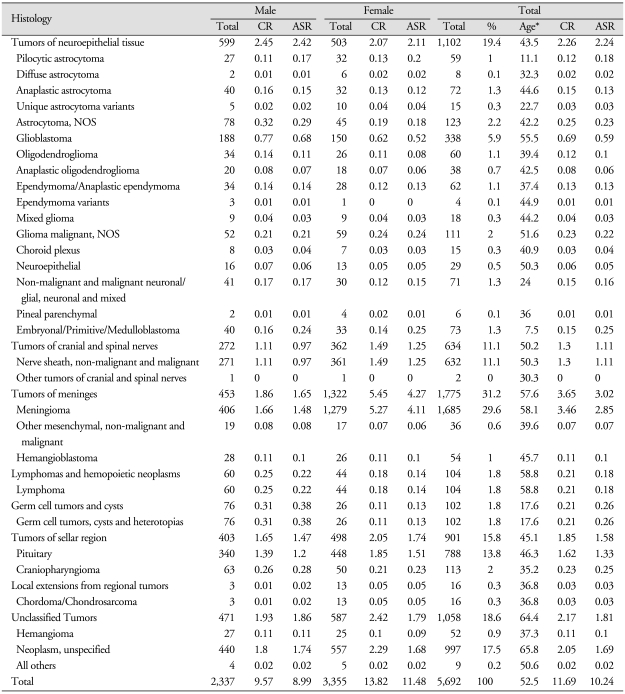
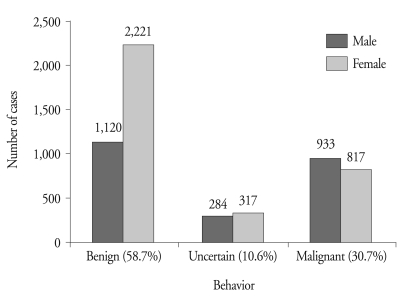
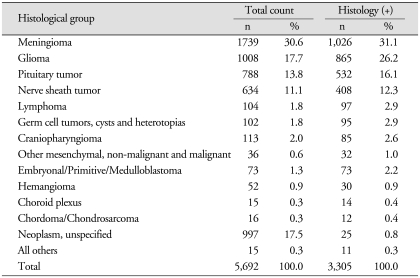
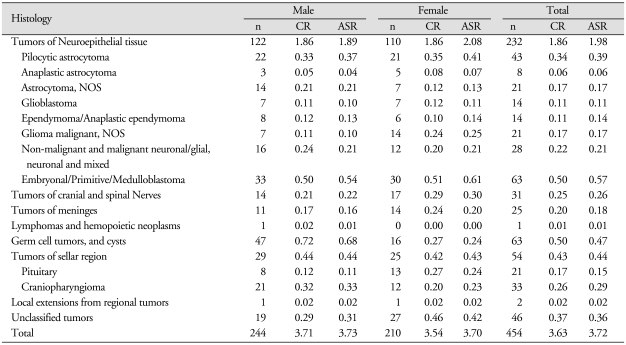
There were 5,692 newly diagnosed CNS tumors from a population of 48.6 million in 2005 (Table 1). Among them, 454 developed in children under 19 years of age. CNS tumors are the seventeenth most common in adults and the second most common in children in Korea1). The overall crude rate of CNS tumors in Korea was 11.69 per 100,000 person-years in 2005, and the rate in children was 3.63 per 100,000 person-years. Tumors classified as benign, uncertain whether benign or malignant, and malignant tumors accounted for 58.7%, 10.6% and 30.7% of all primary CNS tumors, respectively (Fig. 1). Histological confirmation was achieved in 58.1% (3,305 cases). The number of total and histologically confirmed cases is listed in descending order of frequency in Table 2.
Table 1.
Incidences of primary CNS tumors according to histology and sex
*Median age at diagnosis. ASR : age-standardized rate, CR : crude rate
Fig. 1.
Distribution of primary CNS tumors according to sex and ICD-O-3 tumor behavior.
Table 2.
The numbers of total and histologically confirmed cases listed in descending order of frequency
Histology (+) : histologically confirmed cases
Incidence according to tumor biological behavior
The overall incidence according to biological behavior is shown in Fig. 1. The incidence in males was 41.1%, and the incidence in females was 58.9%. The incidence of benign CNS tumors was twice that of malignant tumors in adults. Benign tumors developed nearly twice more frequently in females than in males (M : F = 1120 : 2221). In contrast, the incidences of uncertain and malignant tumors were noted to be similar or more frequent in males.
Distribution of tumors according to the originating site
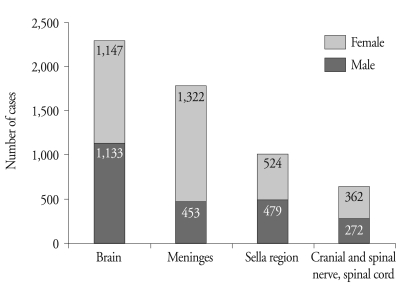
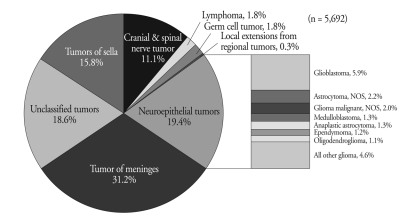
The incidence according to the originating site is shown in Fig. 2. Brain parenchyma (40.1%) was the most common site of primary CNS tumors, followed by the meninges (31.2%), sellar region (17.6%) and nerves (11.1%). Parenchymal brain tumors were most frequently located within the frontal lobe, followed by the cerebellum, temporal lobe and parietal lobe. Meningiomas were most frequently located within the cerebral meninges (82.5%), followed by meninges NOS and spinal meninges. Tumors of the meninges developed 3 times more frequently in females (Fig. 2). The other sites showed no significant differences in incidence according to sex. The majority of sellar tumors originated in the pituitary gland (85%). Tumors of the cranial nerves most commonly originated from the eighth cranial nerve.
Fig. 2.
Distribution of all CNS tumors according to the originating site.
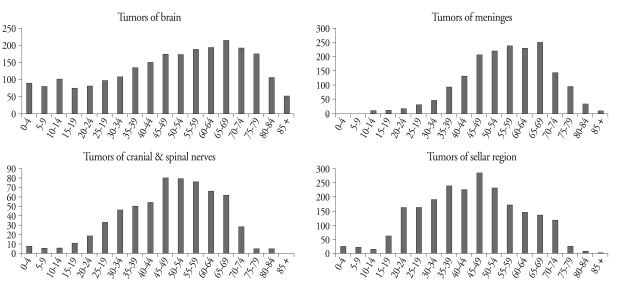
The overall incidence of primary CNS tumors increased with age until the seventh decade. The incidence of each site-specific tumor according to age is shown in Fig. 3. Tumors of the brain parenchyme were observed in all age groups and reached a peak in the seventh decade. Tumors of the meninges seldom occurred in childhood, the incidence of which increased in the third decade and peaked in the seventh decade. Tumors of the nerves occurred in a few children and peaked in the sixth decade. Sellar tumors in children were also reported occasionally. Their incidence increased rapidly in late adolescents and reached a peak in the fifth decade, which decreased thereafter.
Fig. 3.
Distribution of primary CNS tumors according to age and selected histology.
Incidence according to specific histology
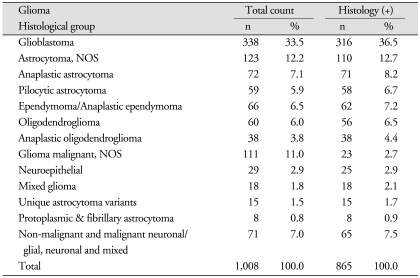
Distribution of the tumors according to histology is shown in Fig. 4. Histologically, tumors of the meninges were the most common (31.2%), and neuroepithelial tumors were the second most common (19.4%). Neuroepithelial tumors were composed of glioma, ganglioneuroma, neurocytoma, primitive neuroectodermal tumor, pineal tumor and retinoblastoma. Most of the neuroepithelial tumors were gliomas (91.5%), which accounted for 17.7% of all primary CNS tumors and were the second most common histology. Glioblastoma accounted for 5.9% of all tumors and 33.5% of all gliomas. Among histologically confirmed cases, glioblastoma accounted for 36.5% of all gliomas (Table 3). Sellar tumors and nerve sheath tumors, which were confirmed by pathologists, accounted for 16.1% and 12.3%, respectively, of all tumors.
Fig. 4.
Distribution of all primary CNS tumors according to the originating site and histology.
Table 3.
The numbers of total and histologically confirmed cases of gliomas
Histology (+), histologically confirmed cases
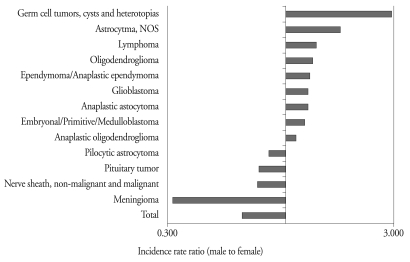
The overall incidence according to gender and histology are presented in Fig. 5. The incidence of meningioma was almost 3 times higher in females than in males. Nerve sheath tumor, pituitary tumor and pilocytic astrocytoma were also more common in females than in males. On the other hand, germ cell tumor, glioma (except pilocytic astrocytoma) and lymphoma were more common in males than in females. We classified tumors according to CBTRUS. Unclassified tumors include unspecified neoplasms and all other tumors. Unspecified neoplasms refer to cases registered based on death certificates only. We did not have any specific data other than neoplasm in those cases. The tumors which classified into all others were tumors that did not meet CBTRUS criteria. Unclassified tumors accounted for 17.5% of all CNS tumors. The detail is described in Table 4. Among the unclassified tumors, benign, borderline and malignant tumors were found in 192, 108 and 697 patients, respectively. As registered according to the ICD-O-3 code, 715 patients were diagnosed with brain parenchymal tumors (C71). Tumors of the brain parenchyme, nerve/spinal cord/meninges, sella and pineal gland were found in 714, 102, 96 and 85 patients, respectively. The other tumors did not meet CBTRUS criteria. Malignant melanoma, cystic lymphangioma and Langerhans histiocytosis were found in 3, 5 and 1 patients, respectively.
Fig. 5.
Incidence according to sex and histology.
Table 4.
Detailed tumor behavior in histologically unclassified tumors and all others
ICD-O-3 : the International Classification of Diseases for Oncology, Third Edition
Distribution of childhood primary CNS tumors according to histology
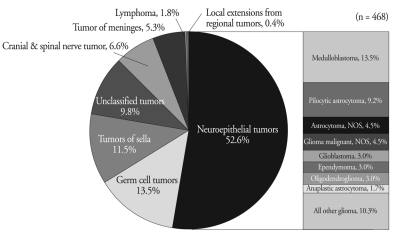
Distribution of tumors according to histology is shown in Table 3 and Fig. 6. The most common histology in children included glioma and germ cell tumor. Glioma accounted for 52.6% of all brain tumors in children. Medulloblastoma was the most common tumor among neuroepithelial tumors in children. Glioblastoma accounted for only 3% of all primary brain tumors in children, in contrast to adults.
Fig. 6.
Distribution of primary CNS tumors according to the originating site and histology in children.
Incidence in children according to age and histology
The age-standardized incidence in children according to histology is shown in Table 5. Among the 0-4 age group, the incidence of primary brain tumors was the highest (3.14 per 100,000 person-years). The crude rate of the 5-9, 10-14 and 15-19 age groups accounted for 2.1, 2.05 and 2.74 per 100,000 person-years, respectively. In childhood, the incidence of medulloblastoma, pilocytic astrocytoma, craniopharyngioma and ependymoma decreased with age. In contrast, the incidence of meningiomas, germ cell tumors and pituitary adenomas increased with age.
Table 5.
Incidences of primary CNS tumors according to histology and sex in children (ages 0-19 years), 2005, Korea
Abbreviation: CR, crude rate; ASR, age-standardized rate
Tumor incidence analysis in children showed different disease patterns according to age. We divided the childhood tumors into 2 groups according to age. Tumor distribution of the 15-19 age group is different from that of the 0-14 age group, but similar to the adult group. Embryonal/primitive/medulloblastomas were the most common in children under 14 years of age, followed by germ cell tumor, pilocytic astrocytoma and craniopharyngioma. Germ cell tumor was reported to be the most common in the ≥ 15 age group, followed by pituitary tumor, nerve sheath tumor and meningioma.
DISCUSSION
This is the first nationwide study on primary CNS tumors, encompassing benign, borderline and malignant tumors in Korea. Primary CNS tumors are not common. However, the diag-nosis rate of tumors increases gradually, and they have a great impact on patients as well as their families. Early detection and treatment are essential for improving the prognosis of primary CNS tumors.
The overall crude rate for CNS tumors in Korea was 11.69 per 100,000 person-years in 2005, and the crude rate in children was 3.63 per 100,000 person-years. The age-standardized rate of all primary CNS tumors in Korea, Japan and the United States accounts for 10.2, 13 and 16.5 per 100,000 person-years, respectively3,6,10). Histologically confirmed diagnoses accounted for 58% of all CNS tumors in Korea compared to 73% in the Unites States and 86% in Japan. This means that a considerable number of the final diagnoses of our cases were made without histological confirmation.
Incidences of most CNS tumors increased with age until the seventh decade. Tumors of the meninges are very rare in childhood. Tumors of the sella and nerves were occasionally reported. They were related to hereditary tumors, such as neurofibromatosis and multiple endocrine tumors. The incidence patterns of embryonal/primitive/medulloblastoma, pilocytic astrocytoma, ependymoma and germ cell tumors reached a peak in early childhood then decreased with age. Regarding incidence according to age, the incidence of primary CNS tumors was different between the <14 and 15-19 age groups. The incidence in the 15-19 age group was similar to that in adults.
Glioblastoma is well known to be the most aggressive and to have the poorest prognosis. It is the most common tumor originating from the neuroepithelium, regardless of sex in all other countries. In 1996, glioblastoma was reported to account for 8.5% of all CNS tumors and 37.3% of all neuroepithelial tumors in Japan. Between 2000 and 2004, glioblastoma was reported to account for 18.5% of all CNS tumors and 51.2% of all neuroepithelial tumors in the Unites States. In Korea, glioblastoma was shown to be 5.9% of all CNS tumors and 30.4% of all neuroepithelial tumors. Glioblastoma can be diagnosed as a high-grade glioma or malignant astrocytoma by magnetic resonance imaging. Therefore, direct comparisons would be limited due to the differences in data collection. Analyzing histologically confirmed cases, glioblastoma accounted for 9.6% of all CNS tumors and 42% of the neuroepithelial tumors. The incidence of glioma in Korea is not significantly different from that in Japan and the Unites States.
Meningioma is the most common tumor of all primary CNS tumors. Meningioma is often benign. It occurs in females predominantly. The female predominance of cases of meningioma has also been reported in the United States and Japan.
The second most common primary CNS tumor was pituitary tumor, followed by cranial and spinal nerve tumors and glioblastoma in Korea. The incidence of CNS tumors in Japan showed the same order of frequency. In contrast, glioblastoma is the second most common CNS tumor in the United States. Glioma is more common in Americans than in Asians.
The limitations of this study are a relatively low rate of histologically confirmed diagnoses and a short-term study period. Long-term data and a precise reporting system are needed to obtain more precise epidemiology.
CONCLUSION
We reported the first nationwide statistics of all CNS tumors in Korea. Epidemiologic data on all primary CNS tumors for the purposes of accurately estimating their incidence are mandatory for facilitating etiologic studies, establishing awareness of the disease, and ultimately, for the control of tumors.
References
- 1.Cancer incidence in 2005 and survival for 1993-2005. Annual report of national cancer registration. [Accessed September 10, 2008]. Available at : http://www.iarc.fr/
- 2.Bauchet L, Rigau V, Mathieu-Daudé H, Figarella-Branger D, Hugues D, Palusseau L, et al. French brain tumor data bank : methodology and first results on 10,000 cases. J Neurooncol. 2007;84:189–199. doi: 10.1007/s11060-007-9356-9. [DOI] [PubMed] [Google Scholar]
- 3.Statistical report : primary brain tumors diagnosed in the United States in 2004-2005. Central Brain Tumor Registry of the United States. [Accessed September 10, 2009]. Available from : http://www.cbtrus.org/
- 4.Chi JG, Khang SK. Central nervous system tumors among Koreans : a statistical study of 697 cases. J Korean Med Sci. 1989;4:77–90. doi: 10.3346/jkms.1989.4.2.77. [DOI] [PMC free article] [PubMed] [Google Scholar]
- 5.Chi JG, Lee HS, Kim MS, Kim CW. Tumors of central nervous system, histological analysis of 327 cases among Koreans. J Korean Cancer Assoc. 1980;12:3–20. [Google Scholar]
- 6.Committee of Brain Tumor Registry of Japan. Report of Brain Tumor Registry of Japan (1969-1996) Neurol Med Chir (Tokyo) 2003;43:1–111. [PubMed] [Google Scholar]
- 7.Fritz A, Percy C, Jack A, Shanmugaratnam K, Sobin L, Parkin DM, et al. International classification of diseases for oncology. 3rd ed. Vol. Geneva, Switzerland: World Health Organization; 2000. [Google Scholar]
- 8.Hoffman S, Propp JM, McCarthy BJ. Temporal trends in incidence of primary brain tumors in the United States, 1985-1999. Neuro Oncol. 2006;8:27–37. doi: 10.1215/S1522851705000323. [DOI] [PMC free article] [PubMed] [Google Scholar]
- 9.Johannesen TB, Angell-Andersen E, Tretli S, Langmark F, Lote K. Trends in incidence of brain and central nervous system tumors in Norway, 1970-1999. Neuroepidemiology. 2004;23:101–109. doi: 10.1159/000075952. [DOI] [PubMed] [Google Scholar]
- 10.Kaneko S, Nomura K, Yoshimura T, Yamaguchi N. Trend of brain tumor incidence by histological subtypes in Japan : estimation from the Brain Tumor Registry of Japan, 1973-1993. J Neurooncol. 2002;60:61–69. doi: 10.1023/a:1020239720852. [DOI] [PubMed] [Google Scholar]
- 11.Kim TS. Clinicopathological study of tumors of the nervous system among Korean. Korean J Pathol. 1976;10:555–564. [Google Scholar]
- 12.Lee HS, Ham EK, Kim JM, Lee SK. A histological study of tumors of the central nervous system. Korean J Pathol. 1972;6:157–165. [Google Scholar]
- 13.Shin HR, Won YJ, Jung KW, Kong HJ, Yim SH, Lee JK, et al. Nationwide cancer incidence in Korea, 1999-2001; first result using the national cancer incidence database. Cancer Res Treat. 2005;37:325–331. doi: 10.4143/crt.2005.37.6.325. [DOI] [PMC free article] [PubMed] [Google Scholar]
- 14.Suh YL, Koo H, Kim TS, Chi JG, Park SH, Khang SK, et al. Tumors of the central nervous system in Korea a multicenter study of 3221 cases. J Neurooncol. 2002;56:251–259. doi: 10.1023/a:1015092501279. [DOI] [PubMed] [Google Scholar]
- 15.Wöhrer A, Waldhör T, Heinzl H, Hackl M, Feichtinger J, Gruber-Mösenbacher U, et al. The Austrian Brain Tumour Registry : a cooperative way to establish a population-based brain tumour registry. J Neurooncol. 2009;95:401–411. doi: 10.1007/s11060-009-9938-9. [DOI] [PubMed] [Google Scholar]


