

Abstract
There is a growing concern about chronic diseases and other health problems related to diet including obesity and cancer. The need to accurately measure diet (what foods a person consumes) becomes imperative. Dietary intake provides valuable insights for mounting intervention programs for prevention of chronic diseases. Measuring accurate dietary intake is considered to be an open research problem in the nutrition and health fields. In this paper, we describe a novel mobile telephone food record that will provide an accurate account of daily food and nutrient intake. Our approach includes the use of image analysis tools for identification and quantification of food that is consumed at a meal. Images obtained before and after foods are eaten are used to estimate the amount and type of food consumed. The mobile device provides a unique vehicle for collecting dietary information that reduces the burden on respondents that are obtained using more classical approaches for dietary assessment. We describe our approach to image analysis that includes the segmentation of food items, features used to identify foods, a method for automatic portion estimation, and our overall system architecture for collecting the food intake information.
Index Terms: Classification, diet record method, dietary assessment, image texture, feature extraction, mobile device, mobile telephone, pattern recognition, volume estimation
I. Introduction
There is a growing concern about chronic diseases and other health problems related to diet including obesity and cancer. Dietary intake, the process of determining what someone eats during the course of a day, provides valuable insights for mounting intervention programs for prevention of many chronic diseases. Measuring accurate dietary intake is considered to be an open research problem in the nutrition and health fields. The increasing prevalence of obesity among the youth is of great concern [1] and has been linked to an increase in type 2 diabetes mellitus [2]. Accurate methods and tools to assess food and nutrient intake are essential in monitoring the nutritional status of this age group for epidemiological and clinical research on the association between diet and health.
The collection of food intake and dietary information provides some of the most valuable insights into the occurrence of disease and subsequent approaches for mounting intervention programs for prevention. The assessment of food intake in adolescents has been evaluated in the past by a food record (FR), the 24-hour dietary recall (24 HR), and a food frequency questionnaire (FFQ) with external validation by doubly-labeled water (DLW) and urinary nitrogen [3]–[7]. Currently, there are too few validation studies in children to justify one particular method over another for any given study design.
The accurate assessment of diet is problematic, especially in adolescents [3]. The availability of “smart” mobile telephones with higher resolution imaging capability, improved memory capacity, network connectivity, and faster processors allow these devices to be used in health care applications. Mobile telephones can provide a unique mechanism for collecting dietary information that reduces burden on record keepers. A dietary assessment application for a mobile telephone would be of value to practicing dietitians and researchers [8]. Previous results among adolescents showed that dietary assessment methods using a technology-based approach, e.g., a personal digital assistant with or without a camera or a disposable camera, were preferred over the traditional paper food record [9]. This suggests that for adolescents, dietary methods that incorporate new mobile technology may improve cooperation and accuracy. To adequately address these challenges, we describe a mobile telephone food record [10] that we have developed using a mobile device (e.g., a mobile telephone or PDA-like device) to provide an accurate account of daily food and nutrient intake. Fig. 1 shows the overall architecture of our proposed system, which we describe in detail in Section V. Our goal is to use a mobile device with a built-in camera, network connectivity, integrated image analysis and visualization tools with a nutrient database, to allow a user to discretely record foods eaten. Images acquired before and after foods are eaten can be used to estimate the amount of food and nutrients consumed [11], [12]. We have deployed a prototype system on an iPhone. This prototype system is available only for testing, not for commercial distribution, and it is currently being tested by dietitians and nutritionists in the Department of Foods and Nutrition at Purdue University for various adolescent and adult controlled diet studies.
Fig. 1.

Overall system architecture for dietary assessment.
The paper is organized as follows. Section II reviews current dietary assessment methods. Section III describes the image analysis methods used for our system. Section IV illustrates methods for automatic portion estimation and visual refinement. Section V describes the deployment of our dietary assessment system on a mobile device. In Section VI, we present experimental results. We conclude with the discussion of our system, and future work in Section VII.
II. Review of Current Dietary Assessment Methods
A review of some of the most popular dietary assessment methods is provided in this section. The objective here is to analyze the advantages and major drawbacks of these methods. This will demonstrate the significance of our mobile telephone food record which can be used for population and clinical based studies to improve the understanding of diet among adolescents.
A. 24-Hour Dietary Recall
The 24-hour dietary recall (24 HR) consists of a listing of foods and beverages consumed the previous day or the 24 hours prior to the recall interview. Foods and amounts are recalled from memory with the aid of an interviewer who has been trained in methods for soliciting dietary information. A brief activity history may be incorporated into the interview to facilitate probing (i.e., asking questions) for foods and beverages consumed. The Food Surveys Research Group (FSRG) of the United States Department of Agriculture (USDA) has devoted considerable effort to improving the accuracy of this method.
The major drawback of the 24 HR is the issue of underreporting of the food consumed [13]. Factors such as obesity, gender, social desirability, restrained eating and hunger, education, literacy, perceived health status, age, and race/ethnicity have been shown to be related to under-reporting [14]–[17]. Youth, in particular, are limited in their abilities to estimate portion sizes accurately [3]. The most common method of evaluating the accuracy of the 24 HR with children is through observation of school lunch and/or school breakfast [18] and comparing foods recalled with foods either observed as eaten or foods actually weighed. These recalls have demonstrated both under-reporting and over-reporting, and incorrect identification of foods.
B. Food Record
The 24 HR is useful in population based studies; however, the preferred dietary assessment method for clinical studies is the food record. Depending on the primary nutrient or nutrients or foods of interest, the minimum number of food records needed is rarely less than two days. Training the subjects, telephoning with reminders for recording, reviewing the records for discrepancies, and entering the dietary information into a nutrient database can take a large amount of time and requires trained individuals [19].
The food record is especially vulnerable to under-reporting due to the complexity of recording food [20], [21]. A study among 10–12 year old children found significant under-reporting of total energy intake (TEI) when the intake was compared against an external marker, doubly-labeled water (DLW) [22]. As adolescents snack frequently, have unstructured eating patterns, and consume greater amounts of food away from the home, their burden of recording is much greater compared to adults. It has been suggested that these factors, along with a combination of forgetfulness and irritation and boredom caused by having to record intake frequently may be contributing to the under-reporting in this age group [23]. Dietary assessment methods perceived as less burdensome and time-consuming may improve compliance [23].
C. Portion Size Estimation
Portion size estimation may be one contributor to under-reporting. In [24], it was found that 45 minutes of training in portion-size estimation among 9–10 year olds significantly improved estimates for solid foods which were measured by dimensions or cups, and liquids estimated by cups. Amorphous foods were estimated least accurately even after training and some foods still exhibited an error rate of over 100%. Thus, training can improve portion size estimation; however, more than one session may be needed and accuracy may be unattainable.
D. Evaluation of Dietary Assessment Methods
The number of days needed to estimate a particular nutrient depends on the variability of the nutrient being assessed and the degree of accuracy desired for the research question [25]–[28]. Most nutrients require more than four days for a reliable estimate [26], [28]. However, most individuals weary of keeping records beyond four days which may decrease the quality of the records [20].
Another challenge in evaluating dietary assessment methods is comparing the results of the dietary assessment method to some measure of “truth.” This is best achieved by identifying a biomarker of a nutrient or dietary factor [21], [29]. The underlying assumption of a biomarker is that it responds to intake in a dose-dependent relationship [27]. The two methods that have widest consensus as valid biomarkers are DLW for energy [21], [30] and 24-hour urinary nitrogen for protein intake [6], [31], [32]. A biomarker does not rely on a self-report of food intake; thus, theoretically the measurement errors of the biomarker are not likely to be correlated with those of the dietary assessment method. Other biomarkers collected from urine samples include potassium and sodium [31]. Plasma or serum biomarkers that have been explored are levels of ascorbic acid for vitamin C intake [31], [33], β-carotene for fruits and vegetables or antioxidants [33]–[35]. These latter markers are widely influenced by factors such as other metabolic pathways, smoking status and supplement use; thus, their interpretation to absolute intake is limited.
As one can see from the above discussion, measuring accurate dietary intake is considered to be an open research problem in the nutrition and health fields. There is a tremendous need for new methods for collecting dietary information. Preliminary studies have indicated that the use of a mobile device using a camera to obtain images of the food consumed may provide a more accurate method for dietary assessment. This is the goal of the mobile telephone food record described in the next sections.
III. Image Analysis System
There has been previous work reported for automatic recognition of some types of food items. Jimenez et al. [36] described an automatic fruit recognition system, which recognized spherical fruits in different situations such as shadows, bright areas, occlusions, and overlapping fruits. A three-dimensional scanner was used to scan the scene and generate five images to represent the azimuth and elevation angles, range, attenuation, and reflectance. The position of the fruits obtained by thresholding and clustering and the Circular Hough Transform was used to identify the center and radius of the fruits. A robust method to segment the food items from the background of color images was proposed in [37]. A color image was converted to a high-contrast grayscale image from an optimal linear combination of the RGB color components. The image is then segmented using a global threshold estimated by a statistical approach to minimize the intraclass variance. The segmented regions were subjected to a morphological process to remove small objects, to close the binary image by dilation followed by erosion and to fill the holes in the segmented regions.
We have developed methods to automatically estimate the food consumed at a meal from images acquired using a mobile device. Our goal is to identify food items using a single image acquired from the mobile device. The system must be easy to use and not place a burden on the user by having to take multiple images, carry another device, or attaching other sensors to their mobile device. Our approach is shown in Fig. 2. Each food item is segmented, identified, and its volume is estimated. “Before” meal and “after” meal images can be used to estimate the food intake. From this information, the energy and nutrients consumed can be determined. In this section, we describe our methods some of which were presented earlier in [10], [11].
Fig. 2.

Ideal food image analysis system.
Our goal is to automatically determine the regions in an image where a particular food is located (segmentation) and correctly identify the food type based on its features (classification or food labeling). Automatic identification of food items in an image is not an easy problem. We fully understand that we will not be able to recognize every food. Some food items look very similar, e.g., margarine and butter. In other cases, the packaging or the way the food is served will present problems for automatic recognition. For example, if the food is in an opaque container then the we will not be able to identify it.
In some cases, if a food is not correctly identified or its volume is incorrect it may not make much difference with respect to the energy or nutrients consumed. For example, if our system identifies a “brownie” as “chocolate cake” there is not a significant amount of differences in the energy or nutrient content. Similarly, if we incorrectly estimate the amount of lettuce consumed this will also have little impact on the estimate of the energy or nutrients consumed in the meal due to the low energy content of lettuce [8], [9]. Again, we emphasize that our goal is to provide a tool for better assessment of dietary intake to professional dietitians and researchers that is currently available using existing methods.
A. Image Segmentation
Our system uses various approaches to segment the food items in the image. In particular, we use connected component analysis, active contours, and normalized cuts. Since we are interested in measuring the amount of food in the image, we have developed a very simple protocol for users of our system [8], [9]. This protocol involves the use of a calibrated fiducial marker consisting of a checkerboard (color checkerboard) that is placed in the field of view of the camera. This allow us to do geometric and color correction to the images so that the amount of food present can be estimated.
Connected Component Labeling
We have investigated a two step approach to segment food items using connected components [11]. In the first step, the color image is converted to grayscale and thresholded to form a binary image. Our goal here is to separate the plate from the tablecloth. The plate was empirically found assuming it was brighter than the table cloth (similar process can be used if the plate is darker than the tablecloth). For segmenting the food items on the plate, the binary image is searched in eight-point connected neighbors for the low intensity value (i.e., 0) in the thresholded image. Since we used a fixed threshold, pixels corresponding to the food items might be labeled as the plate. As a result, we need to refine the estimates of the food locations. Next, the RGB image is converted to the YCbCr color space. Using the chrominance components, Cb and Cr, the mean value of the histogram corresponding to the plate was found. Pixel locations which were not segmented during the first step were compared with the mean value of the color space histogram of the plate to identify potential food items. These pixels were given a different label from that of the plate, then eight-point connected neighbors for the labeled pixels were searched to segment the food items.
Active Contours
Active contours are used to detect objects in an image using techniques of curve evolution. The basic idea is to deform an initial curve to the boundary of the object, under some constraints from the image. The use of active contours to segment food images is described in [38] where a snake model, a controlled continuity spline, is described. Energy functionals are needed to make snakes useful for image analysis problems. Three different energy functionals are used to detect features such as lines, edges and terminations. The edge functional is used in [38] to segment food items such as a pear and a potato. Similar approaches described in [39] and [40] also use the gradients of the image to locate edges. These methods are suitable for images with strong object boundaries, but are generally sensitive to the initialization of the active contour. Therefore, we prefer the region-base models [41]–[43] which identify each region of interest by using a region descriptor to guide the motion of the active contour. These methods are less sensitive to the initialization of the active contour, but tend to rely on intensity homogeneity in each of the regions to be segmented. In particular, we employed the approach described in [44] to partition an image into foreground and background regions. Let ui,0 be the ith channel of an image with i = 1,…, N and C the evolving curve. Let and be two unknown constant vectors. The goal is to minimize the following energy function
| (1) |
where μ > 0 and are parameters for each channel. In our implementation, we used the RGB color components of the image.
The active contours model works well when the food items are separated from each other; however, it sometimes fails to distinguish multiple food items that are connected. We use this approach in some of the controlled diet studies done by the nutritionist where simple types of food are given to test subjects for evaluation.
Normalized Cut
Normalized cut is a graph partition method first proposed by Shi and Malik [45]. This method treats an image pixel as a node of a graph and considers segmentation as a graph partitioning problem. In this method, the image is modeled as a weighted, undirected graph. Each pixel is a node in the graph, and an edge is formed between every pair of pixels. The weight of an edge is a measure of the similarity between the pixels. The image is partitioned into disjoint sets (segments) by removing the edges connecting the segments. The optimal partitioning of the graph is the one that minimizes the weights of the edges that were removed (the cut). Shi's technique seeks to minimize the normalized cut, which is the ratio of the cut to all of the edges in the set. The technique uses a graph-theoretic criterion for measuring the “goodness” of an image partition, where both the total dissimilarity between the different groups as well as the total similarity within the groups are measured. The minimization of this criterion can be formulated as a generalized eigenvalue problem.
Various image features such as intensity, color, texture, contour continuity, motion are treated in one uniform framework. Let X(i) be the spatial location of node i, i.e., the coordinates in the original image I, and F(i) be a feature vector, we can define the graph edge weight connecting the two nodes i and j as
| (2) |
We used intensity and color as the image features for using normalized cut on food images.
B. Food Features
Two types of features are extracted/measured for each segmented food region, color features and texture features. As noted above, as part of the protocol for obtaining food images the subjects are asked to take images with a calibrated fiducial marker consisting of a color checkerboard that is placed in the field of view of the camera. This allows us to correct for color imbalance in the mobile device's camera. For color features, the average value of the pixel intensity (i.e., the gray scale) along with two color components are used. The color components are obtained by first converting the image to the CIELAB color space. The L* component is known as the luminance and the a* and b* are the two chrominance components. For texture features, we use Gabor filters to measure local texture properties in the frequency domain. Gabor filters describe properties related to the local power spectrum of a signal and have been used for texture analysis [46]. A Gabor impulse response in the spatial domain consists of a sinusoidal plane wave of some orientation and frequency, modulated by a two-dimensional Gaussian envelope and is given by
| (3) |
In our work, we use the Gabor filter-bank proposed in [47]. It is highly suitable for our use where the texture features are obtained by subjecting each image (or in our case each block) to a Gabor filtering operation in a window around each pixel and then estimating the mean and the standard deviation of the energy of the filtered image. A Gabor filter-bank consists of Gabor filters with Gaussians of several sizes modulated by sinusoidal plane waves of different orientations from the same Gabor-root filter as defined in (3), it can be represented as
| (4) |
where x̃ = a−m(x cosθ + y sinθ),ỹ = a−m(−x sinθ + y cosθ), θ = nπ/K (K = total orientation, n = 0,1,…, K − 1, and m = 0,1,…,S − 1), and h(·,·) is defined in (3). Given an image IE(r, c) of size H × W, the discrete Gabor filtered output is given by a 2-D convolution
| (5) |
As a result of this convolution, the energy of the filtered image is obtained and then the mean and standard deviation are estimated and used as features. In our implementation, we divide each segmented food item into N × N non-overlapped blocks and use Gabor filters on each block. We use the following Gabor parameters: four scales (S = 4), and six orientations K = 6).
C. Classification
Once the food items are segmented and their features are extracted, the next step is to identify the food items using statistical pattern recognition techniques [48], [49]. For classification of the food item, we use a support vector machine (SVM) [50]–[52]. A classification task usually involves training and testing data. Each element in the training set contains one class label and several “attributes” (features). The feature vectors used for our system contain 51 values, 48 texture features and three color features. The feature vectors for the training images (which contain only one food item in the image) are extracted and a training model is generated using the SVM. We use LIBSVM [53], a library for support vector machines.
The labeled food type along with the segmented image are sent to the automatic portion estimation module where camera parameter estimation and model reconstruction are utilized to determine the volume of food.
IV. Volume Estimation
One of the challenging problems of image-based dietary assessment is the accurate estimation of food portion size from a single image. As we have indicated above, this is done to minimize the burden on the user. We have developed a method to automatically estimate portion size of a variety of foods through volume estimation. These “portion volumes” utilize camera parameter estimation and model reconstruction to determine the volume of food items, from which nutritional content is then determined.
Our volume estimation consists of camera calibration and 3-D volume reconstruction. Fig. 3 illustrates this process. Two images are used as inputs, one is the food image taken by the user, the other image is the segmented image described in the previous section. The camera calibration step estimates camera parameters, comprised of intrinsic parameters (distortion, the principal point, and focal length) and extrinsic parameters (camera translation and orientation). We use the fiducial marker discussed above as a reference for the scale and pose of the food item identified. The fiducial marker is detected in the image and the pose is estimated. The system for volume estimation partitions the space of objects into “geometric classes,” each with their own set of parameters. Feature points are extracted from the segmented region image and unprojected into the 3-D space. A 3-D volume is reconstructed by the unprojected points based on the parameters of the geometric class. Once the volume estimate for a food item is obtained, the nutrient intake consumed is derived from the estimate based on the USDA Food and Nutrient Database for Dietary Studies (FNDDS) [54]. Next, we summarize the methods we have developed. A complete description of our volume estimation methods is presented in [12].
Fig. 3.

Food portion estimation process
A. Spherical and Prismatic Approximation Model
Both a spherical approximation model and a prismatic approximation model have been used to perform 3-D volume reconstruction in our work. Our spherical approximation model is inspired by Dandelin spheres to recover the radius and position of a sphere from a single view [55]. One key to recovering sphere parameters is that the sphere is tangent to the ground plane. The method for fixing the position makes use of a particular arrangement of two spheres, a cone, and a plane, known as Dandelin spheres [55]. The intersection of a plane and a cone forms an elliptical conic section. To estimate the sphere position, feature points from the elliptical region in the screen space are projected onto the table plane. We reorient the resulting points on to a two-dimensional plane to find ellipse parameters. This is achieved by first using the translation vector, followed by the inverse of the rotation matrix, which yields coordinate triples with negligible z-values. The ellipse of the shadow area is usually more elongated than that of the apparent contour. The ellipse parameters for the shadow area are recovered by estimating the ellipse that best fits in a least square sense to the contour points. Under perspective projection, the circumference of the apparent contour of a sphere is smaller than that of the sphere's great circle—the circle that cuts the sphere into two equal halves and shares its center. Thus, it is somewhat more difficult to estimate a radius with a perspective camera than under orthogonal projection. We use the method proposed by Heron [56] which describes the area of a triangle given the length of each side and the semiperimeter of the triangle to obtain the radius of a circle inscribed in this triangle.
To support general shapes of food items, we also developed a prismatic approximation model. We assume that the segmented region representing the food item corresponds exactly to the physical area upon which the food contacts the plate surface. This assumption is valid when the image is taken at a high angle, such that there are no self-occluding boundaries. Alternatively, the assumption is preserved for images acquired at a shallow (oblique) angle by manually supplying surface contact information, or automatic computation by symmetry cues. For each pixel on the boundary of a given segmented region, a vertex in the world space may be calculated as the intersection of back-projected screen rays with the table surface. Fig. 4 illustrates the 3-D volume construction of scrambled eggs using our prismatic approximation model. We obtain feature points on the boundary of a segmented region obtained from image segmentation. Fig. 4(b) shows extracted feature points on the boundary of scrambled eggs. Since the planar shape constructed with the extracted points is not always convex, we triangulate the planar polygon using Delaunay triangulation [57] and sum all the areas of the triangles to obtain the area of the planar polygon. Finally, this area is extruded towards the tangential direction of the table surface to produce the volume of the food item.
Fig. 4.

Volume reconstruction of scrambled eggs using our prismatic approximation model. (a) An input food image, (b) feature points, (c) a base plane constructed using the feature points, and (d) the food volume shape for the scrambled eggs.
B. Visual Refinement
Interactive parameter adjustment enables the user to supply information that may be absent from the two-dimensional scene image with the implicit knowledge that they possess of the scene, as well as correct estimation errors in our reconstruction algorithm. Our visual refinement allows the user to reposition the spherical estimator volume at any point tangent to the table surface and adjust the radius, as shown in Fig. 5. The height of the prismatic estimator can be interactively adjusted with real-time feedback (this will be described in more detail in the next section).
Fig. 5.

User refinement. More accurate estimate is produced by translating and scaling the spherical volume. (a) shows the initial reconstructed sphere for the orange and (b) and (c) show the translated and scaled estimates, respectively. The initial estimated radius is 1.649 inches (original: 1.45) and the final estimate is 1.5 inches.
V. System Architecture
We have developed two different configurations for our dietary assessment system: a standalone configuration and a client-server configuration. Each approach has potential benefits depending on the operational scenario.
A. Client–Server Configuration
The Client–Server configuration is shown in Fig. 1. In most applications this will be the default mode of operation. The process starts with the user sending the image and metadata (e.g., date, time, and perhaps GPS location information) to the server over the network (step 1) for food identification and volume estimation (step 2 and 3), the results of step 2 and 3 are sent back to the client where the user can confirm and/or adjust this information if necessary (step 4). Once the server obtains the user confirmation, food consumption information is stored in another database at the server, and is used for finding the nutrient information using the FNDDS database [54] (step 6), the FNDDS database contains the most common foods consumed in the U.S., their nutrient values, and weights for typical food portions. Finally, these results can be sent to dietitians and nutritionists in the research community or the user for further analysis (step 7). We have implemented our system on the Apple iPhone as the client. A prototype system has been deployed on the Apple iPhone as the client and we have verified its functionality with various combination of foods. A prototype of the client software has also been deployed on the Nokia N810 Internet Tablet.
It is important to note that our system has two modes for user input. In the “automatic mode,” the label of the food item, the segmented image, and the volume estimation can be adjusted/resized after automatic analysis by the user using the touch screen on the mobile device. These corrections will then be used for nutrient estimation using the FNDDS.
The other mode addresses the problem when no image is available. For some scenarios, it might be impossible for users to take meal images. For example, the user may not have their mobile telephone with them or may have forgotten to take meal images. To address these situations, we developed an Alternative Method in our system that is based on user interaction and food search using the FNDDS database [54]. With the help of experts from the Foods and Nutrition Department at Purdue University, the Alternative Method captures sufficient information for a dietitian to perform food and nutrient analysis, including date and time, food name, measure description, and the amount of intake. For a more detailed description of the Alternative Method, please refer to [58].
B. Standalone Configuration
The idea here is to perform all the image analysis and volume estimation on the mobile device. By doing the image analysis on the device, the user does not need to rely on network connectivity. One of the main disadvantages of this approach is the higher battery consumption on the mobile device. Optimization of the image analysis techniques is one of our priorities when designing our system. We are also exploring strategies to perform some parts of the image analysis on the mobile device and others on the server. Having a standalone configuration allows us to determine how each part of the process affects power consumption, processor utilization, and device memory. It also helps us detect what are the most resource demanding tasks so we can implement these tasks on the server.
VI. Experimental Results
Several controlled diet studies were conducted by the Department of Foods and Nutrition at Purdue University whereby participants were asked to take pictures of their food before and after meals [8]. These meal images were used for our experiments. Currently, we have collected more than 3000 food images. To assess the accuracy of our various methods, it is important to develop groundtruth data for the images. For each image, we manually extracted each food item in the scene using a Cintiq Interactive Pen LCD Display and Adobe Photoshop. Given a meal image, we traced the contour of each food item and generated corresponding mask images along with the correct food labels. As a control, different individuals were asked to ground truth the same images and the results were shown to graduate students in the Department of Foods and Nutrition at Purdue University for evaluation. Since these were controlled studies the correct nutrient information was also available.
Figs. 6–8 show sample results from the use of connected component labeling, active contours, and normalized cut segmentation, respectively.
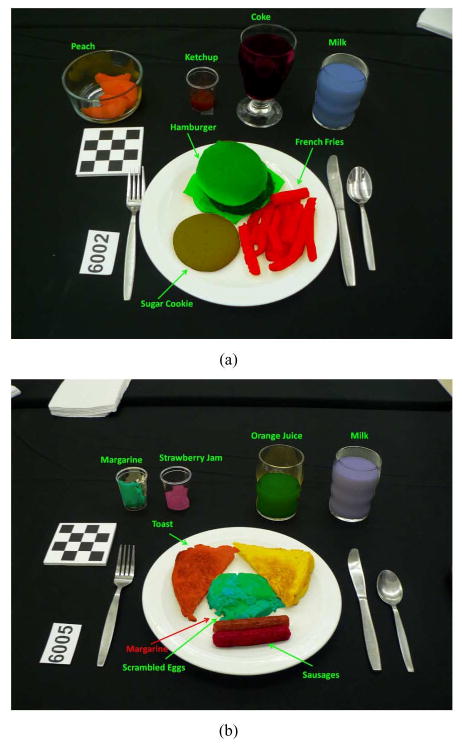
Fig. 6.

Sample results of connect component labeling. (a) A typical image of a meal, (b) food item segmented using a fix threshold (T=127), and (c) additional food item segmented using color information.
Fig. 8.

Sample results of normalized cut. (a) and (c) are the original images, (b) and (d) show the segmented object boundary, and (e)–(h) are the extracted objects, respectively.
For our classification tests we considered 19 food items from three different meal events (a total of 63 images). All images were acquired in the same room with the same lighting conditions. Three experiments were conducted depending on the number of images used for training and the number of images used for testing. For these experiments, we used the groundtruth segmentation data described above to evaluate the performance of the classification. First, we considered 10% of images for training and the rest, 90%, for testing. In the second experiment we used 25% of images for training and 75% for testing. We then considered 50% of images for training and for testing in the third experiment. Table I presents results from the three experiments in terms of average correct classifications for all food items. A tenfold cross-validation is performed to include the mean and variance of the classification results.
TABLE I. Classification Accuracy of Food Items Using Various Number of Training Images.
| Percentage of Training Data | Correct Classification Percentage (Mean) | Correct Classification Percentage (Variance) |
|---|---|---|
| 10% training data | 84.2% | 7.4% |
| 25% training data | 91.7% | 4.3% |
| 50% training data | 95.8% | 1.8% |
Examples of correctly classified objects and misclassified objects are shown in Fig. 9. We randomly select training and testing data; therefore, when we consider only 10% of the data for training purposes, each data item has a large influence on the classifier's performance. Some foods are inherently difficult to classify due to their similarity in the feature space we use. Examples of such errors are scrambled eggs misclassified as margarine and Catalina dressing misclassified as ketchup. We also have shown from our experiments that the performance of the image segmentation plays a crucial role in achieving correct classification results.
Fig. 9.
Examples of classified food items, each item label is shown for corresponding food mask. (a) All food items are successfully classified using SVM. (b) Some food items are misclassified by SVM, i.e., scrambled eggs is misclassified as margarine.
To measure the accuracy of our volume estimation for both spherical and prismatic objects, we used seven food items (five spherical and two prismatic objects) for the experiment. No manual refinement for the spherical objects was performed in this experiment. The average error rates are summarized in Table II. Estimated radii had good agreement with measured radii in the spherical trials, falling within 0.07 inches for every fruit but one (the nectarine (considered the least spherical of the fruits) was overestimated by 0.14 inches). Nectarine radii derived from cross-sectional areas were within 0.01 inches of the direct radius measurement, the estimation error may be due partly to the choice of the cross-section used. The average volume error in the nectarine, by the use of a water displacement ground truth method (0.51%), was the smallest of all the fruits. However, by the radius method (7.17%), it was surpassed only by that of the plum (14.6%), for which there was fairly high disagreement between the two ground truth methods of obtaining volume estimates. The average error rate of volume estimates for oranges was smaller than those of the other spherical fruits as oranges were almost spherical objects. As shown in the experiment, it is often the case that the fruit deviates from the ideal spherical object. Hence, ellipsoid based approximation methods would be a better estimation. However, it is very challenging to extract the major diameter and minor diameter of a spherical object from a single view image in perspective projection. Whereas, volume estimation results on synthetic spheres were highly accurate, as ground truth values for volume are known exactly.
TABLE II. Percentage Error Rates for Estimated Versus Measured Volumes.
| Grapefruit | Apple | Nectarine | Orange | Plum | Jell-O | Brownie | Mean | Std.Dev. | |
|---|---|---|---|---|---|---|---|---|---|
| Radius | 0.67% | 0.8% | 2.10% | 0.29% | 4.65% | 0.02% | 0.02% | 1.71% | 1.78% |
| Area | – | – | – | – | – | 0.33% | 1.25% | 0.79% | 0.65% |
| Height | – | – | – | – | – | 2.22% | 11.52% | 6.87% | 6.57% |
| Volume by Method 1† | 7.38% | 0.84% | 0.51% | 2.10% | 17.55% | – | – | 5.68% | 7.19% |
| Volume by Method 2‡ | 1.95% | 2.46% | 1.17% | 0.86% | 14.60% | 2.03% | 10.45% | 5.65% | 5.25% |
Method 1Is Measured Using Water Displacement,
Method 2Is Computed Using Measured Radius
For prismatic objects, as shown in Table II, prismatic area and height were not as accurate with 10% volume error in the worst trial although the Jell-O estimation fared well. The brownie volume errors ranged from 6% to 14% as compared to the nominal volume. The error rates of the brownies were higher than those of the Jell-Os. This was attributed from the image segmentation since the boundary of the segmented regions for the brownies were not smooth. We also performed an experiment for analyzing the accuracy of gram weights estimated from the volume estimates, produced from our volume estimation process. We chose two food items, a garlic bread and a yellow cake. Table III shows the error rates between estimated and measured gram weights.
TABLE III. Percentage Error Rates for Estimated versus Measured Mass.
| Food Name | Volume Estimation (in3) | FNDDS Derived Density (g/in3) | Calculated Mass (g) | Measured Mass (g) | Error (%) |
|---|---|---|---|---|---|
| Garlic Bread (a) | 12.70 | 3.9 | 49.53 | 51.3 | 3.4 |
| Garlic Bread (b) | 6.39 | 3.9 | 24.91 | 57.1 | 56.4 |
| Yellow Cake (a) | 12.52 | 8.1 | 101.47 | 74.3 | 36.6 |
| Yellow Cake (b) | 8.98 | 8.1 | 72.75 | 68 | 7.0 |
Nutrient information and meal images were collected from the controlled studies where a total of 78 participants (26 males, 52 females) ages 11 to 18 years used our system. The energy intake measured from the known food items for each meal was used to validate the performance of our system. Based on the number of images used for training, we estimated the mean percentage error of our automatic methods compared to nutrient data collected from the studies. With 10% training data, the automatic method reported within 10% margin of the correct nutrient information. With 25% training data, the automatic method improved to within 3% margin of the correct nutrient information. With 50% training data, the improvement was within 1% margin of the correct nutrient information. Our experimental results indicated that the use of a mobile device using a camera to obtain images of the food consumed is a valid and accurate tool for dietary assessment.
VII. Conclusion and Discussion
In this paper, we described the development of a dietary assessment system using mobile devices. As we indicated, measuring accurate dietary intake is considered to be an open research problem in the nutrition and health fields. We feel we have developed a tool that will be useful for replacing the traditional food record methods currently used. We are continuing to refine and develop the system to increase its accuracy and usability.
Fig. 7.

Sample results of active contours. (a) and (b) each contains the original image (upper left), initial contour (upper right), segmented object boundary (lower left), and binary mask (lower right).
Acknowledgments
The authors would like to thank their colleagues and collaborators, T. Schap and B. Six of the Department of Foods and Nutrition and J. Chae and K. Ostmo of the School of Electrical and Computer Engineering at Purdue University for their help in collecting and processing the images used in their studies. More information about their project can be found at www.tadaproject.org.
This work was supported by the National Institutes of Health under Grants NIDDK 1R01DK073711-01A1 and NCI 1U01CA130784-01.The associate editor coordinating the review of this manuscript and approving it for publication was Prof. Vikram Krishnamurthy.
Biographies

Fengqinq Zhu (S'05) received the B.S. and M.S. degrees in electrical and computer engineering from Purdue University, West Lafayette, IN, in 2004 and 2006, where she is currently pursuing the Ph.D. degree in the area of communications, networking, and signal and image processing.
During the summer of 2007, she was a Student Intern at the Sharp Laboratories of America, Camas, WA. Her research interests include video compression, image/video processing, image analysis, and computer vision.

Marc Bosch (S'05) received the degree on electrical engineering from Technical University of Catalonia (UPC), Barcelona, Spain, in 2007, and the M.S. degree in electrical and computer engineering from Purdue University, West Lafayette, IN, in 2009, where he is currently pursuing the Ph.D. degree.
His research interest include image/video processing, video compression, image analysis, and computer vision.
Mr. Bosch received the Archimedes Award for the best undergraduate engineering thesis from the Science and Education Ministry of Spain.

Insoo Woo received the B.S. degree in computer engineering from Dong-A University, Busan, Korea, in 1998. He is currently pursuing the Ph.D. degree in School of Electrical and Computer Engineering, Purdue University, West Lafayette, IN.
He was a Software Engineer during 1997 to 2006. He is a Research Assistant in the Purdue University Rendering and Perception Lab. His research interest is GPU-aided techniques for computer graphics and visualization.

SungYe Kim received the B.S. and M.S. degrees from Chung-Ang University, Seoul, Korea, in 1998 and 2000, respectively, both in computer science and engineering. She is currently pursing the Ph.D. degree in electrical and computer engineering at Purdue University, West Lafayette, IN,
She is a Research Assistant in the Purdue University Rendering and Perception Lab. From 2000 to 2006, she was a Research Engineer on a computer graphics team in the Electronics Telecommunications Research Institute in Korea. Her research interests include computer graphics, rendering techniques, illustrative visualization, mobile graphics, and mobile visual analytics.

Carol J. Boushey received the B.Sc. from the University of Washington, Seattle, the M.P.H. degree from the University of Hawaii, Manoa, and the Ph.D. degree from the University of Washington through the interdisciplinary nutrition program and the epidemiology program.
She is an Associate Professor at Purdue University, West Lafayette, IN. She is a member of the National Community Engagement Steering Committee of the Clinical and Translational Science Awards (CTSA) and the executive committee of the Community Health Engagement Program of Indiana's Clinical and Translational Sciences Institute. Her research interests include dietary assessment methods, adolescent dietary behaviors, school-based interventions, food insecurity, and applications of quantitative methods. Her career as a practicing dietitian included working for the Washington State Health Department, the Waianae Coast Comprehensive Health Center on Oahu, and the University of Hawaii. As a university faculty member, she has directed two multi-site randomized school trials, “No Bones About It!” and “Eat Move Learn”; and the statewide Safe Food for the Hungry program in Indiana. She serves on the Board of Editors of the Journal of The American Dietetic Association. She is the coeditor for the second edition of the Elsevier publication, Nutrition in the Treatment and Prevention of Disease, released in the spring of 2008. Her published research has appeared in book chapters and journals, such as Pediatrics, the Journal of Nutrition, and JAMA. She has presented on numerous occasions at regional, statewide, national, and international meetings. While pursuing the M.PH. degree, she was a Research Assistant with the Epidemiology Branch of the Cancer Research Center of Hawaii. Currently, she is a Registered Dietitian with the Commission on Dietetic Registration.

David S. Ebert (S'87–M'87–SM'04–F'09) is the Silicon Valley Professor of Electrical and Computer Engineering at Purdue University, West Lafayette, IN, a University Faculty Scholar, and Director of the Visual Analytics for Command Control and Interoperability Center (VACCINE), the Visualization Science team of the Department of Homeland Security's Command Control and Interoperability Center of Excellence. He performs research in novel visualization techniques, visual analytics, volume rendering, information visualization, perceptually based visualization, illustrative visualization, mobile graphics and visualization, and procedural abstraction of complex, massive data.
Prof. Ebert has been very active in the visualization community, teaching courses, presenting papers, cochairing many conference program committees, serving on the ACM SIGGRAPH Executive Committee, serving as Editor-in-Chief of the IEEE Transactions on Visualization and Computer Graphics, serving as a member of the IEEE Computer Society's Publications Board, serving on the IEEE Computer Society Board of Governors, and successfully managing a large program of external funding to develop more effective methods for visually communicating information.

Edward J. Delp (S'70–M'79–SM'86–F'97) was born in Cincinnati, OH. He received the B.S.E.E. (cum laude) and M.S. degrees from the University of Cincinnati and the Ph.D. degree from Purdue University, West Lafayette, IN. In May 2002, he received an Honorary Doctor of Technology from Tampere University of Technology, Tampere, Finland.
From 1980 to 1984, he was with the Department of Electrical and Computer Engineering, University of Michigan, Ann Arbor. Since August 1984, he has been with the School of Electrical and Computer Engineering and the School of Biomedical Engineering, Purdue University. In 2002, he received a Chaired Professorship and currently is The Silicon Valley Professor of Electrical and Computer Engineering and Professor of Biomedical Engineering. His research interests include image and video compression, multimedia security, medical imaging, multimedia systems, communication, and information theory.
Dr. Delp is a Fellow of SPIE, the Society for Imaging Science and Technology (IS&T), and the American Institute of Medical and Biological Engineering. He is Co-Chair of the SPIE/IS&T Conference Security, Steganography, and Watermarking of Multimedia Contents that has been held since January 1999. He was the Program Co-Chair of the IEEE International Conference Image Processing that was held in Barcelona in 2003. In 2000, he was selected a Distinguished Lecturer of the IEEE Signal Processing Society. He received the Honeywell Award in 1990, the D. D. Ewing Award in 1992, and the Wilfred Hesselberth Award in 2004, all for excellence in teaching. In 2001, he received the Raymond C. Bowman Award for fostering education in imaging science from the Society for Imaging Science and Technology (IS&T). In 2004, he received the Technical Achievement Award from the IEEE Signal Processing Society. In 2002 and 2006, he was awarded Nokia Fellowships for his work in video processing and multimedia security.
Footnotes
Color versions of one or more of the figures in this paper are available online at http://ieeexplore.ieee.org.
Contributor Information
Fengqing Zhu, School of Electrical and Computer Engineering, Purdue University, West Lafayette, IN 47907 USA (ace@ecn.purdue.edu).
Marc Bosch, Email: ace@ecn.purdue.edu, School of Electrical and Computer Engineering, Purdue University, West Lafayette, IN 47907 USA (ace@ecn.purdue.edu).
Insoo Woo, School of Electrical and Computer Engineering, Purdue University, West Lafayette, IN 47907 USA (ace@ecn.purdue.edu).
SungYe Kim, School of Electrical and Computer Engineering, Purdue University, West Lafayette, IN 47907 USA (ace@ecn.purdue.edu).
Carol J. Boushey, Department of Foods and Nutrition, Purdue University, West Lafayette, IN 47907 USA
David S. Ebert, School of Electrical and Computer Engineering, Purdue University, West Lafayette, IN 47907 USA (ace@ecn.purdue.edu).
Edward J. Delp, School of Electrical and Computer Engineering, Purdue University, West Lafayette, IN 47907 USA (ace@ecn.purdue.edu).
References
- 1.Ogden C, Carrol M, Curtin L, Lamb M, Flegal K. Prevalence of high body mass index in us children and adolescents, 2007–2008. J Amer Med Assoc. 2010 Jan;303(3):242–249. doi: 10.1001/jama.2009.2012. [DOI] [PubMed] [Google Scholar]
- 2.Fagot-Campagna A, Saadinem J, Flegal K, Beckles G. Diabetes, impaired fasting glucose, and elevated hba1c in US adolescents: The third national health and nutrition examination survey. Diabetes Care. 2001;24:834–837. doi: 10.2337/diacare.24.5.834. [DOI] [PubMed] [Google Scholar]
- 3.Livingstone M, Robson P, Wallace J. Issues in dietary intake assessment of children and adolescents. British J Nutrition. 2004;92:S213–S222. doi: 10.1079/bjn20041169. [DOI] [PubMed] [Google Scholar]
- 4.Rockett H, Berkey C, Colditz G. Evaluation of dietary assessment instruments in adolescents. Current Opinion in Clinical Nutrition Metabol Care. 2003;6:557–562. doi: 10.1097/00075197-200309000-00009. [DOI] [PubMed] [Google Scholar]
- 5.McPherson R, Hoelscher D, Alexander M, Scanlon K, Serdula M. Dietary assessment methods among school-aged children: Validity and reliabality. Preventive Med. 2000;31:S11–S33. [Google Scholar]
- 6.Larsson C, Westerterp K, Johansson G. Validity of reported energy expenditure and energy and protein intakes in Swedish adolescent vegans and omnivores. Amer J Clinical Nutrition. 2002;75:268–274. doi: 10.1093/ajcn/75.2.268. [DOI] [PubMed] [Google Scholar]
- 7.Bandini L, Must A, Cyr H, Anderson S, Spadano J, Dietz W. Longitudinal changes in the accuracy of reported energy intake in girls 10–15 y of age. Amer J Clinical Nutrition. 2003;78:480–484. doi: 10.1093/ajcn/78.3.480. [DOI] [PubMed] [Google Scholar]
- 8.Six B, Schap T, Zhu F, Mariappan A, Bosch M, Delp E, Ebert D, Kerr D, Boushey C. Evidence-based development of a mobile telephone food record. J Amer Dietetic Assoc. 2010 Jan;:74–79. doi: 10.1016/j.jada.2009.10.010. [DOI] [PMC free article] [PubMed] [Google Scholar]
- 9.Boushey C, Kerr D, Wright J, Lutes K, Ebert D, Delp E. Use of technology in children's dietary assessment. Eur J Clinical Nutrition. 2009:S50–S57. doi: 10.1038/ejcn.2008.65. [DOI] [PMC free article] [PubMed] [Google Scholar]
- 10.Zhu F, Mariappan A, Kerr D, Boushey C, Lutes K, Ebert D, Delp E. Technology-assisted dietary assessment. Proc IS&T/SPIE Conf Comput Imaging VI; San Jose, CA. Jan. 2008; [DOI] [PMC free article] [PubMed] [Google Scholar]
- 11.Mariappan A, Bosch M, Zhu F, Boushey CJ, Kerr DA, Ebert DS, Delp EJ. Personal dietary assessment using mobile devices. Proc IS&T/SPIE Conf Comput Imaging VII; San Jose, CA. Jan. 2009; [DOI] [PMC free article] [PubMed] [Google Scholar]
- 12.Woo I, Otsmo K, Kim S, Ebert DS, Delp EJ, Boushey CJ. Automatic portion estimation and visual refinement in mobile dietary assessment. Proc IS&T/SPIE Conf Comput Imaging VIII; San Jose, CA. Jan. 2010; [DOI] [PMC free article] [PubMed] [Google Scholar]
- 13.Klesges R, Eck L, Ray J. Who underreports dietary intake in a dietary recall? Evidence from the second national health and nutrition examination survey. J Consulting Clinical Psychol. 1995;63:438–444. doi: 10.1037//0022-006x.63.3.438. [DOI] [PubMed] [Google Scholar]
- 14.Johnson R, Soultanakis R, Matthews D. Literacy and body fatness are associated with underreporting of energy intake in US low-income women using the multiple-pass 24-hour recall: A doubly labeled water study. J Amer Dietetic Assoc. 1998;98:1136–1140. doi: 10.1016/S0002-8223(98)00263-6. [DOI] [PubMed] [Google Scholar]
- 15.Tooze J, Subar A, Thompson F, Troiano R, Schatzkin A, Kipnis V. Psychosocial predictors of energy underreporting in a large doubly labeled water study. Amer J Clinical Nutrition. 2004;79:795–804. doi: 10.1093/ajcn/79.5.795. [DOI] [PubMed] [Google Scholar]
- 16.Bathalon G, Tucker K, Hays N, Vinken A, Greenberg A, McCrory M, Roberts S. Psychological measures of eating behavior and the accuracy of 3 common dietary assessment methods in healthy post-menopausal women. Amer J Clinical Nutrition. 2000;71:739–745. doi: 10.1093/ajcn/71.3.739. [DOI] [PubMed] [Google Scholar]
- 17.Sawaya A, Tucker K, Tsay R, Willett W, Saltzman E, Dallal G, Roberts S. Evaluation of four methods for determining energy intake in young and older women: Comparison with doubly labeled water measurements of total energy expenditure. Amer J Clinical Nutrition. 1996;63:491–499. doi: 10.1093/ajcn/63.4.491. [DOI] [PubMed] [Google Scholar]
- 18.Baxter S, Thompson W, Litaker M, Frye F, Guinn C. Low accuracy and low consistency of fourth-graders' school breakfast and school lunch recalls. J Amer Dietetic Assoc. 2002;102:386–395. doi: 10.1016/s0002-8223(02)90089-1. [DOI] [PMC free article] [PubMed] [Google Scholar]
- 19.Bolland J, Ward J, Bolland T. Improved accuracy of estimating food quantities up to 4 weeks after training. J Amer Dietetic Assoc. 1990;90:1402–1407. [PubMed] [Google Scholar]
- 20.Rebro S, Patterson R, Kristal A, Cheney C. The effect of keeping food records on eating patterns. J Amer Dietetic Assoc. 1998;98:1163–1165. doi: 10.1016/S0002-8223(98)00269-7. [DOI] [PubMed] [Google Scholar]
- 21.Trabulsi J, Schoeller D. Evaluation of dietary assessment instruments against doubly labeled water, a biomarker of habitual energy intake. Amer J Physiol—Endocrinol Metabolism. 2001;281:E891–E899. doi: 10.1152/ajpendo.2001.281.5.E891. [DOI] [PubMed] [Google Scholar]
- 22.Champagne C, Baker N, DeLany J, Harsha D, Bray G. Assessment of energy intake underreporting by doubly labeled water and observations on reported nutrient intakes in children. J Amer Dietetic Assoc. 1998;98:426–433. doi: 10.1016/S0002-8223(98)00097-2. [DOI] [PubMed] [Google Scholar]
- 23.Livingstone M, Black A. Validation of estimates of energy intake by weighed dietary record and diet history in children and adolescents. J Nutrition. 2003;133:S895. doi: 10.1093/ajcn/56.1.29. –. [DOI] [PubMed] [Google Scholar]
- 24.Weber J, Cunningham-Sabo L, Skipper B, Lytle L, Stevens J, Gittelsohn J, Anliker J, Heller K, Pablo J. Portion-size estimation training in second and third-grade American Indian children. Amer J Clinical Nutrition. 1999;69:782S–787S. doi: 10.1093/ajcn/69.4.782S. [DOI] [PubMed] [Google Scholar]
- 25.Liu K, Stamler J, Dyer A, McKeever J, McKeever P. Statistical methods to assess and minimize the role of intra-individual variability in obscuring the relationship between dietary lipids and serum cholesterol. J Chronic Diseases. 1978;31:399–418. doi: 10.1016/0021-9681(78)90004-8. [DOI] [PubMed] [Google Scholar]
- 26.Nelson M, Black A, Morris J, Cole T. Between- and within-subject variation in nutrient intake from infancy to old age: Estimating the number of days required to rank dietary intakes with desired precision. Amer J Clinical Nutrition. 1989;50:155–167. doi: 10.1093/ajcn/50.1.155. [DOI] [PubMed] [Google Scholar]
- 27.Willett W. Nutritional Epidemiology. New York: Oxford Univ Press; 1998. [Google Scholar]
- 28.Beaton G, Milner J, Corey P, McGuire V, Cousins M, Stewart E, deRamos M, Hewitt D, Grambsch P, Kassim N, Little J. Sources of variance in 24-hour dietary recall data: Implications for nutrition study design and interpretation. Amer J Clinical Nutrition. 1979;32:2546–2549. doi: 10.1093/ajcn/32.12.2546. [DOI] [PubMed] [Google Scholar]
- 29.Freudenheim JGE. Biomarkers of nutritional exposure and nutritional status. J Nutrition. 2003;133:871S–973S. doi: 10.1093/jn/133.3.873S. Supplement. [DOI] [PubMed] [Google Scholar]
- 30.Black A, Prentice A, Goldberg G, Jebb S, Bingham S, Livingstone M, Coward W. Measurements of total energy expenditure provide insights into the validity of dietary measurements of energy intake. J Amer Dietetic Assoc. 1993;93:572–579. doi: 10.1016/0002-8223(93)91820-g. [DOI] [PubMed] [Google Scholar]
- 31.McKeown N, Day N, Welch A, Runswick S, Luben R, Mulligan A, McTaggart A, Bingham S. Use of biological markers to validate self-reported dietary intake in a random sample of the European prospective investigation into cancer United Kingdom Norfolk Cohort. Amer J Clinical Nutrition. 2001;74:188–196. doi: 10.1093/ajcn/74.2.188. [DOI] [PubMed] [Google Scholar]
- 32.Bingham SA. Urine nitrogen as a biomarker for the validation of dietary protein intake. J Nutrition. 2003;133:921S–924S. doi: 10.1093/jn/133.3.921S. [DOI] [PubMed] [Google Scholar]
- 33.Mayne S. Antioxidant nutrients and chronic disease: Use of biomarkers of exposure and oxidative stress status in epidemiologic research. J Nutrition. 2003;133:933S–940S. doi: 10.1093/jn/133.3.933S. [DOI] [PubMed] [Google Scholar]
- 34.Townsend M, Kaiser L, Allen L, Joy A, Murphy S. Selecting items for a food behavior checklist for a limited-resource audience. J Nutrition Educat Behavior. 2003;35:69–77. doi: 10.1016/s1499-4046(06)60043-2. [DOI] [PubMed] [Google Scholar]
- 35.Murphy S, Kaiser L, Townsend M, Allen L. Evaluation of validity of items for a food behavior checklist. J Amer Dietetic Assoc. 2001;101:761. doi: 10.1016/S0002-8223(01)00189-4. –. [DOI] [PubMed] [Google Scholar]
- 36.Jimenez A, Jain A, Ceres R, Pons J. Automatic fruit recognition: A survey and new results using range/attenuation images. Pattern Recognition. 1999;32:1719–1736. [Google Scholar]
- 37.Mery D, Pedreschi F. Segmentation of colour food images using a robust algorithm. J Food Eng. 2005;66:353–360. [Google Scholar]
- 38.Kass M, Witkin A, Terzopoulos D. Snakes: Active contour models. Int J Comput Vis. 1998;1:321–331. [Google Scholar]
- 39.Caselles V, Kimmel R, Sapiro G. Geodesic active contours. Int J Comput Vis. 1997;22(1):61–79. [Google Scholar]
- 40.Malladi R, et al. Shape modeling with front propagation: A level set approach. IEEE Trans Pattern Anal Mach Intell. 1995 Feb;17(2):158–175. [Google Scholar]
- 41.Chan T, Vese L. Active contours without edges. IEEE Trans Image Process. 2001 Feb;10(2):266–277. doi: 10.1109/83.902291. [DOI] [PubMed] [Google Scholar]
- 42.Tsai A, Yezzi A, Willsky A. Curve evolution implementation of the Mumford-Shah functional for image segmentation, denoising, interpolation, and magnification. IEEE Trans Image Process. 2001 Aug;10(8):1169–1186. doi: 10.1109/83.935033. [DOI] [PubMed] [Google Scholar]
- 43.Zhu S, Yuille A. Region competition: Unifying snakes, region growing, and Bayes/MDL for multiband image segmentation. IEEE Trans Pattern Anal Mach Intell. 1996 Sep;18(9):884–900. [Google Scholar]
- 44.Chan T, Sandberg B, Vese L. Active contours without edges for vector-valued images. J Vis Commun Image Represent. 2000;11(2):130–141. [Google Scholar]
- 45.Shi J, Malik J. Normalized cuts and image segmentation. IEEE Tran Pattern Anal Mach Intell. 2000 Aug;22(8):888–905. [Google Scholar]
- 46.Kruizinga P, Petkov N, Grigorescu SE. Comparison of texture features based on Gabor filters. Proc 10th Int Conf Image Anal Process; Washington, DC. Sep. 1999; pp. 142–147. [DOI] [PubMed] [Google Scholar]
- 47.Jain A, Farrokhnia F. Unsupervised texture segmentation using Gabor filters. Pattern Recognition. 1991;24(12):1167–1186. [Google Scholar]
- 48.Fukunaga K. Introduction to Statistical Pattern Recognition. San Diego, CA: Academic; 1990. [Google Scholar]
- 49.Duta R, Hart P, Stork D. Pattern Classification. New York, NY: Wiley-Interscience; 2000. [Google Scholar]
- 50.Cristianini N, Taylor J. An Introduction to Support Vector Machines. Cambridge, U.K.: Cambridge Univ Press; 2000. [Google Scholar]
- 51.Burges CJC. A tutorial on support vector machines for pattern recognition. Data Mining Knowl Discov. 1998;2(2):121–167. [Google Scholar]
- 52.Muller K, Mika S, Ratsch G, Tsuda K, Scholkopf B. An introduction to kernel-based learning algorithms. IEEE Trans Neural Netw. 2001 Mar;12(2):181–201. doi: 10.1109/72.914517. [DOI] [PubMed] [Google Scholar]
- 53.Chang CC, Lin CJ. LIBSVM: A Library for Support Vector Machines. 2001 [Online]Available: http://www.csie.ntu.edu.tw/cjlin/libsvm, software available at.
- 54.Usda Food and Nutrient Database for Dietary Studies, 3.0. Beltsville, MD: Agricultural Research Service, Food Surveys Research Group; 2004. [Google Scholar]
- 55.Ogilvy C. Excursions in Geometry. New York: Dover; 1990. [Google Scholar]
- 56.Dunham W. Journey Through Genius: The Great Theorems of Mathematics. New York: Wiley; 1990. [Google Scholar]
- 57.Guibas L, Stolfi J. Primitives for the manipulation of general subdivisions and the computation of Voronoi. ACM Trans Graphics (TOG) 1985;4(2):123–141. [Google Scholar]
- 58.Kim S, Woo I, Zhu F, Ostmo K, Boushey CJ, Delp EJ, Ebert D. Interactive and image-based dietary assessment system using mobile devices. Internal Rep, Purdue Univ. available from the authors. [Google Scholar]