Abstract
The Epidemiology of Hearing Loss Study (EHLS) conducted in Beaver Dam, Wisconsin, was a population-based study that focused on the prevalence of hearing loss among 3,753 participants between 1993 and 1996. This paper reports the results of several auditory measures from 999 veteran and 590 non-veteran males 48 to 92 years of age included in the EHLS. The auditory measures included pure-tone thresholds, tympanometry and acoustic reflexes, word recognition in quiet and in competing message, and the Hearing Handicap Inventory for the Elderly (HHIE-S). Hearing loss in the auditory domains of pure-tone thresholds, word recognition in quiet, and word recognition in competing message increased with age but were not significantly different for the veterans and non-veterans. There were no significant differences between participant groups on the HHIE-S with mixed differences regarding hearing-aid usage.
Keywords: auditory domains, dizziness, hearing aid, non-veteran, pure-tone thresholds, smoking, tinnitus, veteran, word-recognition in competing, message, word-recognition in quiet
Introduction
Hearing loss is one of the most common chronic health conditions among older individuals. Studies indicate the prevalence of hearing loss in the elderly population (>65 years) ranges from 27% to 45% and increases with age (Bunch, 1929; Hinchcliffe, 1959; Goetzinger et al., 1961; Corso, 1963; Cooper and Owen, 1976; Gates et al., 1990). The results from one population-based study focusing on the prevalence of hearing loss is the Epidemiology of Hearing Loss Study (EHLS) conducted in Beaver Dam, Wisconsin (Cruickshanks et al., 1998) indicated that 46% of older adults were affected by hearing loss. The prevalence of hearing loss increased with age and was more common in men than women. Anecdotally, the percept is that because of noise exposure experienced in the military service, veterans have more hearing loss than non-veterans. To date no studies have focused on the prevalence of hearing loss among the veteran population.
The population based EHLS was an outgrowth of the Beaver Dam Eye Study of age-related eye disorders that enrolled 4,926 participants between 1988 and 1990 (Linton et al, 1991; Klein et al., 1996). Of the 4,541 available participants at the 5-year follow-up visit of the Eye Study, 3,753 individuals (82.6%) agreed to participate in the hearing study between March, 1993 and July, 1995 (Cruickshanks et al., 1998). The average age was 65.8 years and 57.7% of the participants were women. Because the EHLS queried the participants about their status as a veteran from one of the US military services, the EHLS provides a unique opportunity to examine characteristics of veterans and non-veterans from the same community. In this context, veteran refers to anyone who served in any branch of the military services. Of the 3,753 EHLS participants, 1,021 (27.2%) reported military service with 22 females and 999 males. Because the 22 females were a substantial minority (2.2%), only the data from 1589 males (veterans and non-veterans) were analyzed. This report compares and contrasts several general health parameters and the auditory functioning of 590 male non-veterans (37.1%) and 999 male veterans (62.9%) in the population. Of the veterans, 68.3% served during wartime, most of which were WWII (n = 396), Korea (n = 220), and Vietnam (n = 86).
The primary purpose of this study was to determine the prevalence of hearing loss among male veterans and non-veterans in the 48–90 years age range who were enrolled in the EHLS. The specific questions were:
Is there a higher prevalence of hearing loss for pure tones among veterans compared to non-veterans in the EHLS?
Is there a higher prevalence of hearing impairment for word recognition in quiet and in competing message among veterans compared to non-veterans in the EHLS?
What is the prevalence of self-assessed hearing handicap among veterans compared to non-veterans?
Are veterans more or less likely to utilize hearing health care services (have their hearing tested, try hearing aids, continue to use hearing aids, etc.) compared to non-veterans?
The study was approved by both the joint East Tennessee State University/VA Institutional Review Board (#99-184e) and by the University of Wisconsin-Madison Institutional Review Board (#2000-384). Informed consent was obtained at the time of the examination.
Methods
As detailed by Cruickshanks et al (1998), the auditory examination included a history of ear and hearing related issues, otoscopy, screening tympanometry (Nondahl et al., 1996; Wiley et al., 1996), air-conduction thresholds at the 250–8000 Hz octave intervals and at 3000 and 6000 Hz, bone-conduction thresholds at 500 and 4000 Hz, and word-recognition in quiet and in competing message. Self-assessed hearing handicap was examined with the Hearing Handicap Inventory for the Elderly (HHIE-S, Ventry and Weinstein, 1982). Except for 132 home-bound residents who were tested in their homes, all other auditory testing was completed in a sound booth. The pure-tone audiometry was conducted in accordance with established guidelines (ASHA, 1987b). Word-recognition in quiet and in competing message was evaluated on one ear with the VA female version (Department of Veterans Affairs, 1991; Wilson et al., 1990) of Northwestern University Auditory Test No. 6 (NU No. 6; Tillman and Carhart, 1966). The ear selected for word recognition was either the ear with better pure-tone thresholds or the right ear if the pure-tone thresholds were equal. In quiet the word-recognition materials were presented nominally 36-dB above the 2000-Hz threshold in the test ear. In the competing message condition, sentences spoken by a male were presented 8-dB below the presentation level of the target words, i.e., at a signal-to-noise ratio (SNR) of 8 dB. Historically, pure-tone thresholds are the “gold standard” for expressing hearing loss. In a slightly different take in this report, pure-tone thresholds are considered but one domain of auditory function with other domains including word recognition in quiet and the word recognition in the competing message. The prevalence of hearing loss in the non-veteran and veteran populations of the Beaver Dam cohort was examined in these three domains of auditory function. The analyses used the chi-square test of association for categorical variables, the Mantel Haenszel chi-square test of trend for ordinal data (Mantel, 1963), and t-tests of mean differences for continuous data (SAS Institute, Inc., Gary, NC).
Results
General Demographics
The demographic data in Table 1 provide information about the 590 non-veterans and 999 veterans included in EHLS. The percent of non-veterans and veterans in each of the four age groups varied, which is reflected in the significant χ2. Veterans comprised the majority of the three youngest groups (53.6% of the 48–59 years group, 79.6% of the 60–69 years group, and 66.9% of the 70–79 years group), whereas the non-veterans comprised the majority of the oldest group (72.8%). The non-veteran and veteran groups also were significantly different in the education category. About 30% of both groups were in the two college categories. More non-veterans (32.2%) than veterans (21.3%) reported less than a high school education, whereas more veterans (46.2%) than non-veterans (36.6%) completed high school, which may reflect the often used requirement of a high school diploma for acceptance into a military service. Although the two groups of participants were significantly different in the marriage category, the profiles were strikingly similar with the majority of each group married (non-veterans 78.0% and veterans 83.9%). In the final category in Table 1, the longest held job, which was taken from the 1980 census classifications, the two groups of participants differed significantly that is probably attributable to two of the categories in which the largest differences were observed, viz., service and farming/forestry. The percents of non-veterans and veterans in the other four “longest held job” categories were very similar.
Table 1.
The number and percent of non-veterans and veterans in four demographic categories. All participants were males. The Chi-square was used to generate the p values.
| Category | Non-Veterans | Veterans | p | ||
|---|---|---|---|---|---|
| n | % | n | % | ||
| Age (Years) | <0.0001 | ||||
| 48–59 | 274 | 46.4 | 317 | 31.7 | |
| 60–69 | 102 | 17.3 | 399 | 39.9 | |
| 70–79 | 123 | 20.9 | 249 | 24.9 | |
| 80–90 | 91 | 15.4 | 34 | 3.4 | |
| Total | 590 | 100.0 | 999 | 100.0 | |
| Education | <0.0001 | ||||
| Less than high school | 190 | 32.2 | 213 | 21.3 | |
| High school | 216 | 36.6 | 461 | 46.2 | |
| Some college | 67 | 11.4 | 144 | 14.4 | |
| College or greater | 117 | 19.8 | 181 | 18.1 | |
| Total | 590 | 100.0 | 999 | 100.0 | |
| Marital Status | 0.0030 | ||||
| Married | 440 | 78.0 | 809 | 83.9 | |
| Single | 32 | 5.7 | 27 | 2.8 | |
| Divorced | 37 | 6.6 | 65 | 6.7 | |
| Widowed | 55 | 9.8 | 63 | 6.5 | |
| Total | 564 | 100.0 | 964 | 100.0 | |
| Longest Held Job | <0.0001 | ||||
| Manage/Professional | 113 | 19.9 | 206 | 21.2 | |
| Technician | 71 | 12.5 | 144 | 14.8 | |
| Service | 47 | 8.3 | 139 | 14.3 | |
| Farming/forestry | 78 | 13.7 | 26 | 2.7 | |
| Production | 149 | 26.2 | 250 | 25.7 | |
| Operations/fabricators | 110 | 19.4 | 208 | 21.4 | |
| Total | 568 | 100.0 | 973 | 100.0 | |
Table 2 provides the distributions for four general health categories and two ear-related categories for the two groups of participants. The two groups of participants were significantly different in the Smoking Status category, which is mainly attributable to more veterans (59.5%) than non-veterans (47.9%) with a smoking history. The encouraging statistic is that current smoking is down to about 15% in both groups, which demonstrates a substantial decrease in smoking for both groups of participants. The two groups of participants did not differ in the three remaining general health categories in Table 2, diabetes, history of myocardial infarction, and history of head injury. Finally from Table 2, the two groups of participants did not differ in the rates at which either dizziness or tinnitus had been experienced in the past year. For non-veterans and veterans, respectively, dizziness ranged from 9.9% to 11.8%, whereas tinnitus ranged from 7.9% to 9.3%.
Table 2.
The number and percent of non-veterans and veterans in six health categories. The Chi-square was used to generate the p values.
| Category | Non-Veterans | Veterans | p | ||
|---|---|---|---|---|---|
| n | % | n | % | ||
| Smoking Status | <0.0001 | ||||
| Never | 215 | 38.0 | 230 | 23.8 | |
| Past | 271 | 47.9 | 576 | 59.5 | |
| Current | 80 | 14.1 | 162 | 16.7 | |
| Total | 566 | 100.0 | 968 | 100.0 | |
| Diabetes | 0.8917 | ||||
| Yes | 58 | 10.4 | 101 | 10.6 | |
| No | 501 | 89.6 | 852 | 89.4 | |
| Total | 559 | 100.0 | 953 | 100.0 | |
| History myocardial infarction | 0.0805 | ||||
| Yes | 57 | 10.1 | 126 | 13.1 | |
| No | 508 | 89.9 | 836 | 86.9 | |
| Total | 565 | 100.0 | 962 | 100.0 | |
| History Head Injury | 0.3574 | ||||
| Yes | 231 | 39.2 | 368 | 36.8 | |
| No | 359 | 60.8 | 631 | 63.2 | |
| Total | 590 | 100.0 | 999 | 100.0 | |
| Dizziness Past Year | 0.2345 | ||||
| Yes | 58 | 9.9 | 118 | 11.8 | |
| No | 529 | 90.1 | 880 | 88.2 | |
| Total | 587 | 100.0 | 998 | 100.0 | |
| Tinnitus Past Year | 0.3283 | ||||
| Yes | 46 | 7.9 | 93 | 9.3 | |
| No | 538 | 92.1 | 905 | 90.7 | |
| Total | 584 | 100.0 | 998 | 100.0 | |
Finally, handiness was checked by asking: Are you left-handed or right-handed? Handiness was the same for both groups of participants with 89% responding right handed, 7% responding left handed, and 4% responding ambidextrous.
Veteran Specific Demographics
The data in Table 3 describe certain service-related characteristics of the 999 veterans involved in the study [note: because of missing or incomplete data for a variety of reasons, the number (n) of participants varies slightly throughout the tables in the manuscript]. The majority were in the Army (60.0%), equal numbers in the Navy and Air Force (16–17%), and fewer in the Marines (5.2%) and Coast Guard (0.9%). Most of the veterans were in the service 5 years or less with 35.3% in for 1–2 years and 40.2% in for 3–5 years. The primary service occupation was support (72.2%) with combat (18.3%) and combat support (9.6%) minority occupations.
Table 3.
The number and percent of veterans in the respective branches of the armed services and the years of military service.
| Category | n | % |
|---|---|---|
| Branch of Service | ||
| Army | 608 | 60.0 |
| Navy | 176 | 17.4 |
| Air Force | 167 | 16.5 |
| Marines | 53 | 5.2 |
| Coast Guard | 9 | 0.9 |
| Total | 1013* | 100.0 |
| Years in Service | ||
| 1–2 | 353 | 35.3 |
| 3–5 | 402 | 40.2 |
| 6–9 | 158 | 15.8 |
| 10–19 | 31 | 3.1 |
| 20+ | 55 | 5.5 |
| Total | 999 | 100.0 |
| Primary Service Activity | ||
| Front Line | 182 | 18.3 |
| Combat Support | 95 | 9.6 |
| Other Support | 718 | 72.2 |
| Total | 995 | 100.0 |
Some participants were in more than one service
Leisure Time Noise Exposure
The categories in Table 4 were included to determine the extent to which the participants in EHLS were exposed to noise in their civilian lives. The distributions of the responses to the three categories of “noisy environments” were almost identical with the differences between groups not significant at the 0.01 level. For example, 34.5% of the non-veterans and 38.5% of the veterans reported involvement in woodworking. The numbers for hunting were even closer, 74.9% vs. 75.0%. Only target shooting approached a level of significance with participation by 12.7% and 17.3% of the non-veterans and veterans, respectively. The data in Table 4 suggest that there was no difference between veterans and non-veterans in their participation in noisy leisure activities.
Table 4.
The number and percent of non-veterans and veterans who reported participating in three activities that are considered noisy. The Chi-square was used to generate the p values.
| Category | Non-Veterans | Veterans | p | ||
|---|---|---|---|---|---|
| n | % | n | % | ||
| Woodworking | 0.0861 | ||||
| Yes | 202 | 34.2 | 385 | 38.5 | |
| No | 388 | 65.8 | 614 | 61.5 | |
| Total | 590 | 100.0 | 999 | 100.0 | |
| Hunting/Fired Gun | 0.9788 | ||||
| Yes | 442 | 74.9 | 749 | 75.0 | |
| No | 148 | 25.1 | 250 | 25.0 | |
| Total | 590 | 100.0 | 999 | 100.0 | |
| Target Shooting | 0.0145 | ||||
| Yes | 75 | 12.7 | 173 | 17.3 | |
| No | 515 | 87.3 | 826 | 82.7 | |
| Total | 590 | 100.0 | 999 | 100.0 | |
Pure-Tone Thresholds
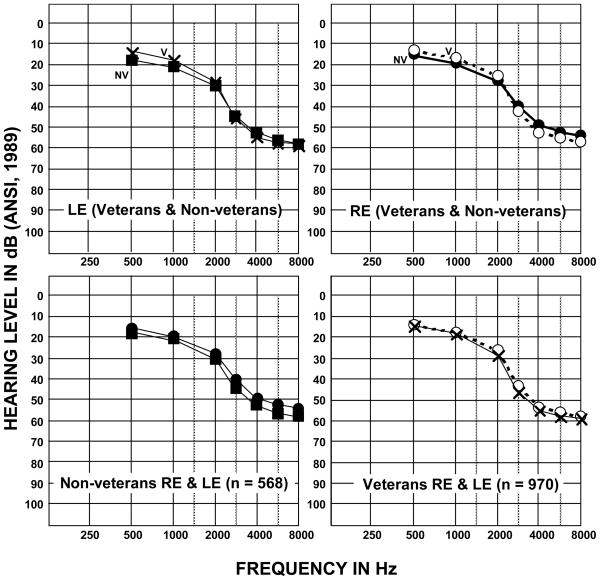
Of the 1589 males between 48 and 90 years of age who were enrolled in the study, 49 participants were able to complete only the interview portion of the protocol and not the objective measures like pure-tone thresholds. Additionally, two participants were evaluated in a nursing home but were unable to complete the objective testing. Thus the objective pure-tone and speech-recognition data reported below are from 568 non-veterans (mean age = 64.6 years, SD = 11.8 years) and 970 veterans (mean age = 64.6 years, SD = 8.6 years). Various combinations of the mean left-ear (LE) and right-ear (RE) audiograms for the non-veteran (NV) and veteran (V) groups of EHLS participants are shown in Figure 1 (all ages by sub-group) and in Figure 2 (4 age groups by participant group).
Figure 1.
The mean audiograms for non-veterans and veterans and in the EHLS. The data in the top panels depict the mean audiograms for the left ear (LE) and right ear (RE) of the non-veterans (filled symbols) and veterans (open symbols), whereas the LE (squares and Xs) and RE (circles) data in the bottom panels are for the non-veterans (left panel) and veterans (right panel).
Figure 2.
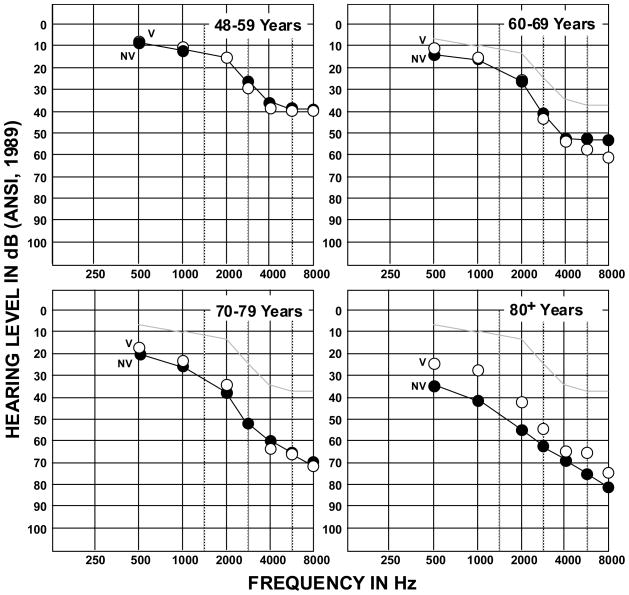
The mean audiograms for the right ears of the veterans (open circles) and the non-veterans (filled symbols) in the four age-group categories. The light line in the panels for the oldest three groups is the threshold function from the 48–59 year group.
The top panels in Figure 1 depict the mean non-veteran (NV) and veteran (V) LE audiograms (left panel) and RE audiograms (right panel), whereas the bottom panels show the mean RE and LE audiograms for the non-veterans (left panel, filled circles and squares) and veterans (right panel, open circles and Xs). The mean audiograms indicate normal hearing at 500 and 1000 Hz for both ears of each participant group. From 2000 to 8000 Hz the audiograms reflect a mild-to-moderate hearing loss with 25-to 30-dB HL (ANSI, 1989) thresholds at 2000 Hz progressing to 55- to 60-dB HL thresholds at 8000 Hz. For both ears, the veterans had slightly better hearing in the lower frequencies by 2 to 4 dB than did the non-veterans. Conversely, in the higher frequencies the non-veterans had slightly better hearing by 2 to 3 dB than did the veterans. Similarly as shown in the bottom panels of Figure 1, the between ear pure-tone threshold differences for both groups of participants were small, ranging from 0.2 dB at 500 Hz to 3.3 dB at 3000 Hz for the veteran group and from 1.1 dB at 1000 Hz to 4.8 dB at 3000 Hz for the non-veteran group. Interestingly, all of the mean pure-tone thresholds for the LE were at higher (poorer) levels than were the mean thresholds for the RE, which is an effect described in a subsequent paragraph.
The mean pure-tone thresholds are presented in Figure 2 for each of four age categories (48–59 years, 60–69 years, 70–79 years, and 80+ years) for the non-veteran and veteran groups. Because of the minimal differences between the RE and LE mean audiograms, only the mean thresholds for the RE are shown. As a point of reference, the light line in the graphs for the three older groups represents a composite of the thresholds for the youngest group of participants. Except for the 80+ year group, the mean thresholds for the veterans and non-veterans are within a few decibels of one another. Although the veterans in the 80+ year group had 5 to 10 dB lower (better) thresholds than the non-veterans, these findings must viewed with caution because of the small number of participants that comprise the two groups in the oldest age range, which in this comparison were 83 non-veterans and only 34 veterans.
To evaluate the significance of the observations seen in Figures 1 and 2, t-tests were used to examine thresholds. An initial paired-samples t-test was used to look at thresholds collapsed across frequency, age, and veteran status for the right and left ear. The resulting statistic [t(1504) = −7.04, p <.001] was significant confirming that on average thresholds were lower (better) for the right than the left ear. The average difference between ears is assumed for both veterans and non-veterans as additional t-test results showed no significant differences for either ear as a function of veteran status. Thresholds as a function of frequency and age were other variables of interest. Two metrics commonly used to define hearing loss in terms of pure-tone thresholds are the traditional pure-tone average (PTA) of thresholds at 500, 1000, and 2000 Hz, and the high-frequency PTA of thresholds at 1000, 2000, and 4000 Hz (HFPTA; Goldstein, 1984). A one-way ANOVA across the four age categories showed a significant increase in the PTA with each increment in age group [Fw(3, 438) = 141.7, p<.001]. Similarly, for the HFPTA a significant increase with each increment in age group [Fw(3, 456) = 199.8, p<.001] was observed.
To this point the data indicate that the hearing sensitivity of the veterans and non- veterans among the age groups and collectively are strikingly similar. The PTAs for the veterans and non-veterans are listed in Table 5 for the four age groups. The only significant PTA difference between groups was with the 80+ year olds [t(93) = −3.3, p = .001]. The mean PTAs for the 48–59 year and the 60–69 year groups were well within the normal range of ≤ 20-dB HL with the means for the 70–79 year groups only outside the normal range by 3 to 5 dB. The 80+ year groups were outside the normal range for PTAs by 10 dB (veterans) and by 20 dB (non-veterans), but again, the disparity in the number of participants in each group probably influenced the outcome.
Table 5.
The mean three-frequency, pure-tone average (PTA) at 500, 1000, and 2000 Hz, the mean high-frequency PTA at 1000, 2000, and 4000 Hz (HFPTA), and the mean word-recognition scores in quiet (Q) and in competing message (CM) for the ear tested for word recognition for non-veterans (NV) and veterans (V).
| PTA (.5, 1, 2) (dB HL) | HFPTA (1, 2, 4) (dB HL) | Words (Q) (% Correct) | Words (CM) (% Correct) | |||||
|---|---|---|---|---|---|---|---|---|
| Age/Statistic | NV | V | NV | V | NV | V | NV | V |
| 48–59 Years | ||||||||
| Mean | 10.0 | 11.5 | 19.1 | 21.9 | 90.7 | 90.7 | 58.5 | 56.3 |
| SD | 8.2 | 12.2 | 11.1 | 17.4 | 6.9 | 6.3 | 16.6 | 16.0 |
| n | 265 | 307 | 265 | 307 | 257 | 297 | 252 | 302 |
| 60–69 Years | ||||||||
| Mean | 15.5 | 15.6 | 27.5 | 29.7 | 87.4 | 87.3 | 47.0 | 45.7 |
| SD | 12.1 | 10.7 | 14.7 | 13.8 | 11.9 | 10.5 | 19.7 | 18.6 |
| n | 99 | 391 | 99 | 390 | 95 | 370 | 96 | 371 |
| 70–79 Years | ||||||||
| Mean | 25.2 | 23.0 | 38.8 | 37.3 | 81.0 | 82.0 | 33.9 | 32.8 |
| SD | 15.4 | 13.2 | 15.8 | 14.5 | 15.4 | 15.6 | 19.2 | 19.6 |
| n | 121 | 237 | 120 | 236 | 114 | 223 | 108 | 217 |
| 80+ Years | ||||||||
| Mean | 39.0 | 29.5 | 53.2 | 43.5 | 63.9 | 78.2 | 15.2 | 24.9 |
| SD | 18.4 | 12.2 | 15.7 | 12.5 | 20.7 | 11.7 | 16.7 | 17.3 |
| n | 81 | 34 | 81 | 34 | 73 | 32 | 60 | 23 |
| Grand Mean | ||||||||
| Mean | 18.4 | 16.0 | 29.6 | 29.0 | 84.4 | 86.8 | 46.2 | 46.2 |
| SD | 16.1 | 12.1 | 18.3 | 15.0 | 15.3 | 11.6 | 23.1 | 19.9 |
| n | 566 | 969 | 565 | 967 | 539 | 922 | 516 | 913 |
Several investigators (e.g., Jerger et al., 1991; Humes et al., 1996) have suggested that the ability to understand speech (especially in background noise) is in part related to auditory function in the frequencies above 2000 Hz. Accordingly, the HFPTAs also were derived for each participant group and are listed in Table 5. As with the PTA, only the 80+ years groups mean HFPTAs were significantly different [ t(85) = −3.2, p = .002]. Not surprisingly, all of the differences between the PTA and the HFPTA were significant at the 0.01 level. The mean HFPTA for the 48–59 year groups are about 10 dB poorer than the traditional PTA but the HFPTAs continue in the normal ≤ 20-dB HL range. For the three remaining age groups, the differences between the mean PTAs and the mean HFPTAs are larger with the HFPTAs 12–14 dB poorer than the traditional PTAs. For the oldest three groups, the mean HFPTAs are progressively poorer than the normal ≤ 20-dB HL range.
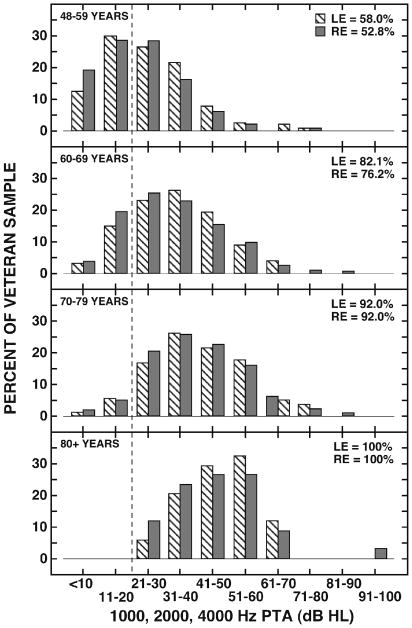
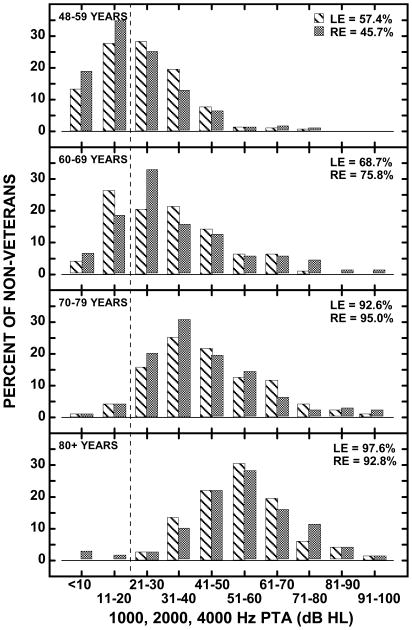
The distributions of hearing losses defined with the HFPTA for the four age groups are shown in Figure 3 (veterans) and Figure 4 (non-veterans). The percent of the participants in the respective groups are on the ordinates with the HFPTA in 10-dB ranges shown on the abscissae. The striped bars represent LE data and the shaded bars represent the RE data. The dashed vertical line delimits normal hearing (≤20-dB HL) and hearing loss (>20-dB HL) with the numbers in the upper right corner of each panel indicating the percentage of each ear that are to the right of the dashed line, which indicates hearing loss. In the 48–59 year groups, 45% to 58% of the participants had hearing loss by the >20-dB HL criterion, a percentage that increased progressively to 92% to 100% of the 80+ years groups. Defined in this manner, the prevalence of hearing loss is substantial in each age group, systematically increases with increasing age, and is similarly distributed for the veterans and non-veterans. The HFPTA data also can be used by the reader to define the prevalence of hearing loss in the veteran and non-veteran groups using any combination of the hearing loss ranges expressed on the abscissae in Figures 3 and 4.
Figure 3.
Histograms depicting the percent of the veteran group in each of four age groups with 1000, 2000, and 4000 Hz pure-tone averages within the bin ranges indicated on the abscissa. Data for the left ear (diagonal lines) and right ear (shaded) are shown. The vertical dashed line is used to delineate the normal hearing and hearing loss categories with the percentages in the upper right of each panel indicating the percent of the sample with hearing loss.
Figure 4.
Histograms depicting the percent of the non-veteran group in each of four age groups with 1000, 2000, and 4000 Hz pure-tone averages within the bin ranges indicated on the abscissa. Data for the left ear (diagonal lines) and right ear (shaded) are shown. The vertical dashed line is used to delineate the normal hearing and hearing loss categories with the percentages in the upper right of each panel indicating the percent of the sample with hearing loss.
Word Recognition in Quiet and in Competing Message
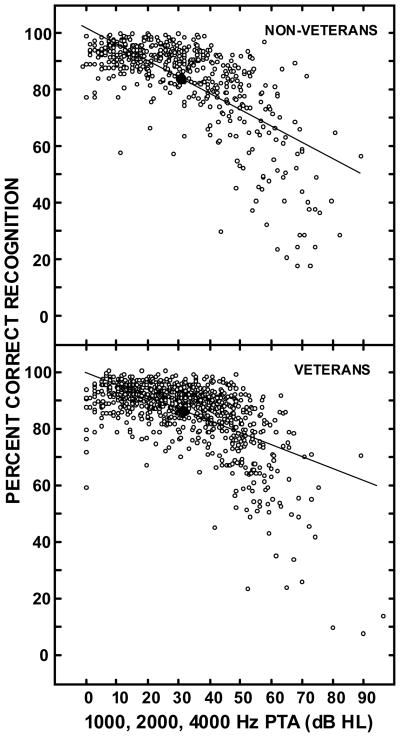
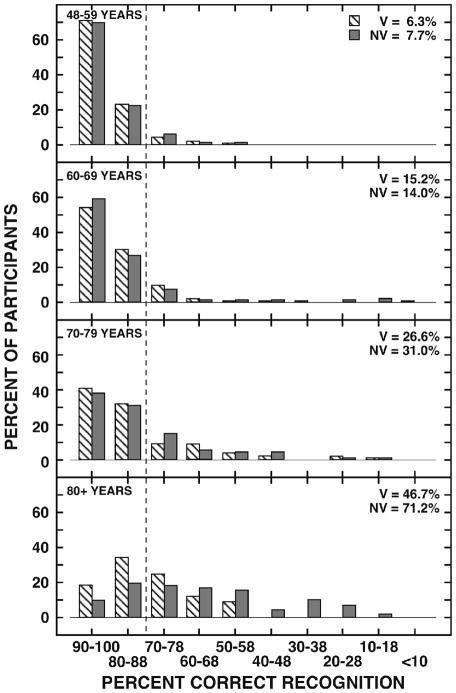
The mean word-recognition performances in quiet on the NU No. 6 materials were 86.5% (SD = 11.5%) by 904 veterans and 84.0% (SD = 15.3%) by 526 non-veterans. An independent t-test showed that the ~2% difference between groups was statistically significant [t(870) = 3.3, p = .001]. Although the difference is statistically significant, 2% is a one-word difference and is not of clinical importance. The individual recognition performances in quiet are plotted in Figure 5 as a function of the HFPTA of the test ear for the non-veterans (top panel) and veterans (bottom panel). The large filled symbol in each panel depicts the mean data and the line is the linear regression used to describe the data. For both participant groups, the distributions are similar as reflected by the slopes of the regressions, − 0.6%/dB and − 0.4%/dB for non-veterans and veterans, respectively. The mean recognition performances (and standard deviations) by the non-veterans and veterans in the four age groups on the NU No. 6 materials in quiet are listed in Table 5. Except for the 80+ age groups, the mean performances are almost identical for the two groups of participants and are in the range of normal hearing, which is defined as ≥ 80% correct. Histograms indicating the percent of the participants in each group [veterans (V), diagonal lines; non-veterans (NV), shaded] with word-recognition scores in the decade intervals from <10 to 100% are shown in Figure 6 for the four age groups. The vertical dashed line indicates the boundary between 80–100% performance (i.e., normal hearing for words in quiet) and 0–78% performance (i.e., hearing loss for words in quiet). The percentages in the upper right corner of each panel list the percent of the participants with hearing loss in this domain of auditory function. Using 80% correct recognition as the boundary between performances by listeners with normal hearing and listeners with hearing loss, it is obvious from the data in Figures 5 and 6 that the majority of participants had normal auditory functioning in terms of understanding speech in quiet. Even if the boundary were changed to 90% correct recognition, the outcome would not be appreciably affected. Finally, when examining performance in quiet by age groups, collapsed across participant groups, a one-way ANOVA showed significant differences between each age group, again with performance declining with increasing age [Fw(3,372) = 77.8, p<.001].
Figure 5.
Bivariate plots of the individual word-recognition performances in quiet (ordinate) and the HFPTA of the listeners (abscissa) for 526 non-veterans (top panel) and 904 veterans (bottom panel). The large filled symbols depict the mean datum points and the lines through the datum points are the linear regressions used to describe the data (R2 = 0.48, non-veterans; R2 = 0.36, veterans).
Figure 6.
Histograms showing the percent of the participants in the veteran (diagonal lines) and the non-veteran (shaded) groups by age group who obtained word-recognition performance on the NU No. 6 materials presented in quiet within the bin ranges indicated on the abscissa. The vertical dashed line is used to delineate the normal hearing (≥80% correct) and hearing loss (≤78% correct) categories with the percentages in the upper right of each panel indicating the percent of each group classified with hearing loss in this domain of auditory function.
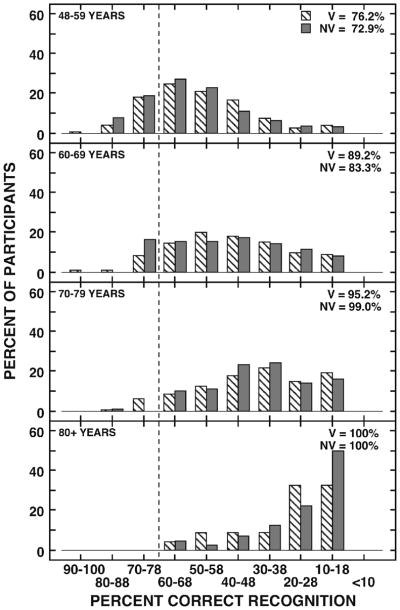
The mean word-recognition performances on the NU No. 6 materials in the competing message at 8-dB S/N were 46.2% (SD = 19.9%) by 913 veterans and 46.2% (SD = 23.1%) by 516 non-veterans. The individual recognition performances in the competing message are plotted in Figure 7 as a function of the HFPTA of the test ear for the non-veterans (top panel) and veterans (bottom panel). Again, the data distributions for the participant groups are similar, which is reflected by the comparable regression slopes of − 0.98%/dB and − 0.95%/dB for the non-veterans and veterans, respectively. The mean recognition performances (and standard deviations) by the non-veterans and veterans in the four age groups on the NU No. 6 materials in the competing message are listed in Table 5. Except for the 80+ age groups, the mean performances are within ~2% for the two groups of participants. Defining the range of normal performance on this paradigm as 70 to 100% correct1 all of the mean data are outside of the normal range. It is noteworthy that the decrement in performance accelerates across the age groups from an 11% difference between the youngest age groups to a 15% difference between the oldest age groups. The interval histograms in Figure 8 depict the distribution of recognition performances for the four age groups on the words in the competing message paradigm. Again, the dashed vertical line depicts the boundary between performances by listeners with normal hearing (≥70% correct) and listeners with hearing loss (<70% correct). There are several points of interest in Figure 8. First, except for the 80+ year groups, the distributions at the respective age categories are remarkably similar for the two groups of participants, reflecting a broad range of performances. The exception in the 80+ years groups probably is attributable to the small n in the groups, especially the veterans (n = 23). Second, across the four age groups the distributions change with a migration from the left (good performance) to the right (poor performance). Third, the percents in the upper right of each panel indicate the percent of the participants whose performances fell to the right of the vertical dashed line (≥70%). The vast majority of participants in each age group (i.e., 72.9% to 100%) had hearing loss for words presented in a competing message or background noise. As with the word-recognition data in quiet, when examining performance in the competing message paradigm by age groups, collapsed across participant groups, a one-way ANOVA showed significant differences between each age group with performance declining with increasing age [Fw(3,348) = 192.8, p<.001].
Figure 7.
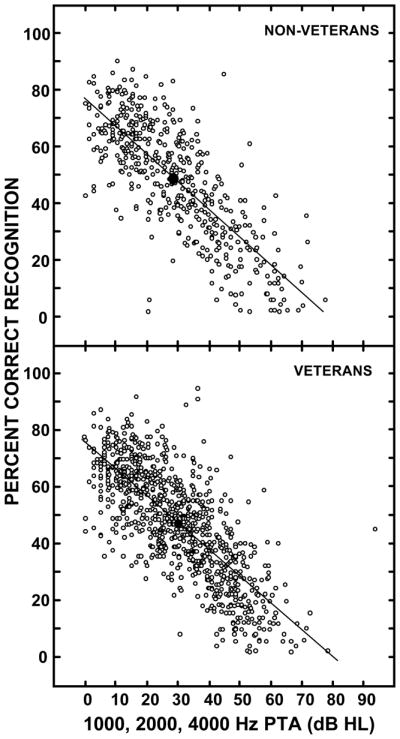
Bivariate plots of the individual word-recognition performances in the competing message (ordinate) and the HFPTA of the listeners (abscissa) for 486 non-veterans (top panel) and 897 veterans (bottom panel). The large filled symbols depict the mean datum points and the lines through the datum points are the linear regressions used to describe the data (R2 = 0.61, non-veterans; R2 = 0.58, veterans). .
Figure 8.
Histograms showing the percent of the participants in the veteran (diagonal lines) and the non-veteran (shaded) groups by age group who obtained word-recognition performance on the NU No. 6 materials presented in a competing message at 8-dB S/N within the bin ranges indicated on the abscissa. The vertical dashed line is used to delineate the normal hearing (≥70% correct) and hearing loss (≤68% correct) categories with the percentages in the upper right of each panel indicating the percent of each group classified with hearing loss in this domain of auditory function.
HHIE-S
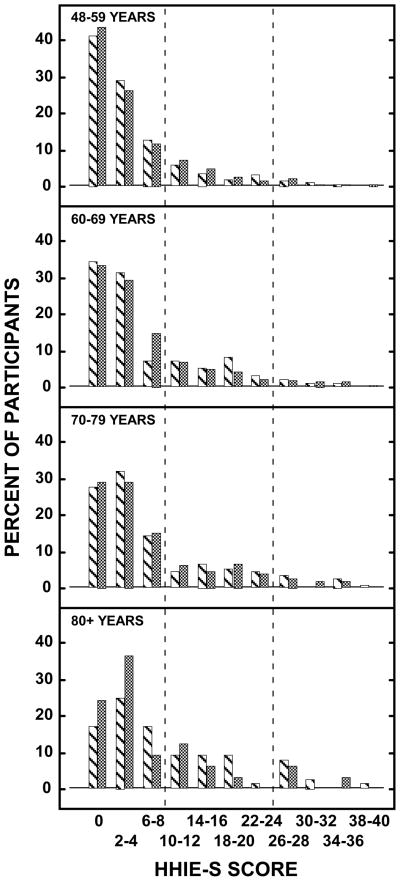
The auditory data reported above were objective data that quantified a specific domain of auditory function. Self-report instruments also have been used in an attempt to understand the prevalence of hearing loss or hearing handicap. The HHIE-S (Ventry and Weinstein, 1982) was included in the EHLS as a measure of the self-perceived hearing handicap (Wiley et al., 2000) with scores of >8 indicative of a self-reported hearing handicap (Bess et al, 1989; ASHA, 1987a) with scores in the 10–24 range considered mild-to-moderate hearing handicap and scores in the 26–40 range considered severe handicap (Lichtenstein et al., 1988). The data in Table 6 list the number (and corresponding percents) of non-veteran and veteran participants by age category. The p values in Table 6 indicate that there were no differences between non-veterans and veterans on the HHIE-S in any of the age groups. Collectively in each age group, the majority of participants scored ≤ 8 with about 82%, 75%, 73%, and 64% of the 48–59, 60–69, 70–79, and 80+ years groups, respectively, indicating no self-perceived hearing problem. At the other extreme of the HHIE-S scoring range (26–40), 3%, 4%, 6%, and 11% of the participants in the respective age groups suggested severe hearing handicap. The remaining 15–25% of each age group scored 10 to 24, which is indicative of a mild-to-moderate hearing handicap. The HHIE-S data for veterans (diagonal lines) and non-veterans (shaded) by the four age groups are displayed in more discrete intervals in Figure 9 that emphasizes the skewness of the distributions toward the lower scores on the HHIE-S. For comparisons in the EHLS of the HHIE-S data with the objective measures of auditory function the reader is referred to Wiley et al (2000).
Table 6.
The number and percents of non-veterans and veterans by age group and overall on the various classification categories of the HHIE-S. The Chi-square was used to generate the p values.
| Age | Non-Veterans | Veterans | p | ||
|---|---|---|---|---|---|
| HHIE-S Category | n | % | n | % | |
| 48–59 Years | 0.9233 | ||||
| 0–8 | 227 | 82.9 | 257 | 81.6 | |
| 10–24 | 39 | 14.2 | 48 | 15.2 | |
| 26–40 | 8 | 2.9 | 10 | 3.2 | |
| Total | 274 | 100.0 | 315 | 100.0 | |
| 60–69 Years | 0.4590 | ||||
| 0–8 | 72 | 72.7 | 304 | 77.4 | |
| 10–24 | 23 | 23.2 | 70 | 17.8 | |
| 26–40 | 4 | 4.1 | 19 | 4.8 | |
| Total | 99 | 100.0 | 393 | 100.0 | |
| 70–79 Years | 0.9279 | ||||
| 0–8 | 88 | 73.3 | 176 | 73.0 | |
| 10–24 | 24 | 20.0 | 51 | 21.2 | |
| 26–40 | 8 | 6.7 | 14 | 5.8 | |
| Total | 120 | 100.0 | 241 | 100.0 | |
| 80+ Years | 0.5824 | ||||
| 0–8 | 45 | 59.2 | 23 | 69.7 | |
| 10–24 | 22 | 29.0 | 7 | 21.2 | |
| 26–40 | 9 | 11.8 | 3 | 9.1 | |
| Total | 76 | 100.0 | 33 | 100.0 | |
| Overall | 0.7992 | ||||
| 0–8 | 432 | 75.9 | 760 | 77.4 | |
| 10–24 | 108 | 19.0 | 176 | 17.9 | |
| 26–40 | 29 | 5.1 | 46 | 4.7 | |
| Total | 569 | 100.0 | 982 | 100.0 | |
Figure 9.
Histograms showing the percent of the participants in the veteran (diagonal lines) and the non-veteran (shaded) groups by age group who had HHIE-S scores in the respective scoring bins. The vertical dashed lines divide the scoring range into the three HHIE-S scoring categories that are detailed in Table 6.
Hearing-Aid Use
Finally, EHLS determined the following two aspects of hearing-aid usage from the participants: (1) had they ever worn a hearing aid, and (2) were they currently wearing a hearing aid. The hearing-aid use data for the non-veteran and veteran groups are listed in Table 7 for the four age categories. Overall, 16% of the non-veterans and 11% of the veterans had a history of hearing-aid use, which was a significant difference at the 0.01 level. Current hearing-aid use was less for both groups, 10% for the non-veterans and 7% for the veterans. This 3% between-group difference was significant. For the various age categories, however, there were no significant differences between the non-veterans and veterans regarding hearing-aid use. Both the pure-tone threshold data and the word-recognition data indicated in general higher thresholds (poorer hearing) and reduced word-recognition abilities as a function of age. The hearing-aid use data in Table 7 reflect these decreased auditory functions and abilities in that hearing-aid use increased consistently as a function of age. For example, the current use of hearing aids by the veterans progressed from 2.5% to 5.5% to 12.0% to 24.2% across the four age groups with a similar pattern observed for the non-veterans. An interesting story from the data in Table 7 is the relation between those who had previous hearing-aid use and those who currently used hearing aids. Collectively, 202 participants acknowledged prior hearing-aid usage, whereas 128 participants were current hearing-aid users. Thus, for unknown reasons, 78 participants were no longer wearing hearing aids and could represent unsuccessful hearing-aid users. A more detailed account of the hearing-aid use data are provided by Popelka et al (1998).
Table 7.
The number and percent of non-veterans and veterans by age group and overall who had worn a hearing aid and who were wearing a hearing aid at the time of the study. The Chi-square was used to generate the p values.
| Ever Worn a Hearing Aid | p | Now Wearing a Hearing Aid | p | |||||||
|---|---|---|---|---|---|---|---|---|---|---|
| Non Veteran | Veteran | Non Veteran | Veteran | |||||||
| n | % | n | % | n | % | n | % | |||
| 48–59 Years | 0.5732 | 0.5635 | ||||||||
| Yes | 11 | 4.0 | 10 | 3.2 | 5 | 1.8 | 8 | 2.5 | ||
| No | 263 | 96.0 | 307 | 96.8 | 269 | 98.2 | 309 | 97.5 | ||
| 60–69 Years | 0.2469 | 0.1138 | ||||||||
| Yes | 14 | 13.7 | 39 | 9.8 | 10 | 9.8 | 22 | 5.5 | ||
| No | 88 | 86.3 | 360 | 90.2 | 92 | 90.2 | 377 | 94.5 | ||
| 70–79 Years | 0.0789 | 0.4839 | ||||||||
| Yes | 33 | 26.8 | 47 | 18.9 | 18 | 14.6 | 30 | 12.0 | ||
| No | 90 | 73.2 | 202 | 81.1 | 105 | 85.4 | 219 | 88.0 | ||
| 80+ Years | 0.4592 | 0.5306 | ||||||||
| Yes | 37 | 40.7 | 11 | 33.3 | 27 | 30.0 | 8 | 24.2 | ||
| No | 54 | 59.3 | 22 | 66.7 | 63 | 70.0 | 25 | 75.8 | ||
| Overall | 0.0018 | 0.0171 | ||||||||
| Yes | 95 | 16.1 | 107 | 10.7 | 60 | 10.2 | 68 | 6.8 | ||
| No | 495 | 83.9 | 891 | 89.3 | 529 | 89.8 | 930 | 93.2 | ||
Conclusions
Veterans and non-veterans in this study were equally likely to have a hearing loss in the auditory domains of pure-tone thresholds, word recognition in quiet, and word recognition in a competing message. Likewise the HHIE-S scores for the two participant groups were not significantly different. Overall, hearing-aid use by veterans and non-veterans was significantly different, but when considered by age group the differences were not significant. These findings were somewhat unexpected considering the opportunity for noise exposure that is present during military service. It should be noted, however, that only 28% of the veterans reported their service roles as combat or combat support and the veterans included were from before the 1990–1991 Gulf War.
Acknowledgments
This work was supported as a pilot project by the Seattle Epidemiology Research Information Center (ERIC). Additionally, the Rehabilitation Research and Development Service, Department of Veterans Affairs supported this work through a Senior Research Career Scientist award to the first author. Appreciation is expressed to Rachel McArdle for her assistance with the statistical analyses. Portions of this paper were presented at the annual meeting of the Association of VA Audiologists in Orlando (2010). The contents of this paper do not represent the views of the Department of Veterans Affairs or the United States Government.
Abbreviations
- ANOVA
analysis of variance
- ANSI
American National Standards Institute
- ASHA
American Speech, Language, Hearing Association
- χ2
chi-square
- dB
decibel
- EHLS
Epidemiology of Hearing Loss Study
- GLM
general linear model
- HFPTA
high-frequency, pure-tone average
- HHIE-S
Hearing Handicap Inventory for the Elderly
- HL
hearing level
- Hz
Hertz (frequency)
- LE
left ear
- n
number
- NC
North Carolina
- NU No. 6
Northwestern University Auditory Test No. 6
- NV
non-veteran
- PTA
pure-tone average
- RE
right ear
- SD
standard deviation
- V
veteran
Footnotes
Normal performance on the NU No. 6 materials presented in a competing message paradigm (Department of Veterans Affairs, 1991) was established from the Wilson et al (1990) data for the same materials presented at 8-dB S/N. The mean for listeners with normal hearing in the Wilson et al study was 84.5% correct with a standard deviation of 5.0%. Based on these data, ≥ 70% correct was established as the range of normal performance, which is a conservative boundary about three standard deviations from the mean.
Authors Contributions: Study Concept and design: Noe, CM, Wilson, RH, Cruickshanks, KJ.
Acquisition of data: Noe, CM, Cruickshanks, KJ, Nondahl, DM and Wiley, T
Analysis and interpretation of data: Nondahl, DM, Cruickshanks, KJ, Noe, CM and Wilson RH
Drafting of manuscript: Wilson, RH, Noe, CM
Critical revision of manuscript for important intellectual content: Wilson, RH, Cruickshanks, KJ, and Wiley, T
Statistical Analysis: Nondahl, DM and Cruickshanks, KJ
Obtained funding: Noe, CM and Wilson, RH
Study Supervision: Noe, CM and Cruickshanks, KJ
References
- American National Standards Institute. ANSI S3.6–1989. New York: ANSI; 1989. Specifications for Audiometers. [Google Scholar]
- American Speech-Language-Hearing Association. Guidelines for audiologic screening. Rockville, MD: ASHA; 1987a. [Google Scholar]
- American Speech-Language-Hearing Association. Guidelines for Manual Pure-Tone Threshold Audiometry. Asha. 1987b;20:297–301. [PubMed] [Google Scholar]
- Bess F, Lichtenstein MJ, Logan SA, Burger MC. Comparing criteria of hearing impairment in the elderly: A functional approach. J Speech Hear Res. 1989;32:795–802. doi: 10.1044/jshr.3204.795. [DOI] [PubMed] [Google Scholar]
- Bunch C. Age variations in auditory acuity. Arch Otolaryng. 1929;9:625–636. [Google Scholar]
- Cooper JC, Jr, Owen JH. Audiologic profile of noise-induced hearing loss. Arch Otolaryng. 1976;102:148–150. doi: 10.1001/archotol.1976.00780080070007. [DOI] [PubMed] [Google Scholar]
- Corso J. Aging and auditory thresholds in men and women. Arch Environ Health. 1963;77:385–405. doi: 10.1080/00039896.1963.10663405. [DOI] [PubMed] [Google Scholar]
- Cruickshanks KJ, Wiley TL, Tweed TS, Klein BEK, Klein R, Mares-Perlman J, Nondahl DM. Prevalence of hearing loss in older adults in Beaver Dam, WI: the Epidemiology of Hearing Loss Study. American Journal of Epidemiology. 1998;148(9):879–886. doi: 10.1093/oxfordjournals.aje.a009713. [DOI] [PubMed] [Google Scholar]
- Department of Veterans Affairs. Speech Recognition and Identification Materials, Disc 1.1. Long Beach CA: VA Medical Center; 1991. [Google Scholar]
- Gates GA, Cooper JC, Kannel WB, Miller NJ. Hearing in the elderly: The Framingham Cohort, 1983–1985. Ear Hear. 1990;11:247–256. [PubMed] [Google Scholar]
- Goetzinger CP, Proud GO, Dirks D, Embrey J. A study of hearing in advanced age. Arch Otolaryng. 1961;73:662–673. doi: 10.1001/archotol.1961.00740020676009. [DOI] [PubMed] [Google Scholar]
- Goldstein D. Hearing impairment, hearing aids and audiology. Asha. 1984;26:24–25. 38. [PubMed] [Google Scholar]
- Hinchcliffe R. The threshold of hearing as a function of age. Acoustica. 1959;3:303– 308. [Google Scholar]
- Humes LE, Coughlin M, Talley L. Evaluation of the use of a new compact disc for auditory perceptual assessment in the elderly. J Amer Acad Audio. 1996;7:419–427. [PubMed] [Google Scholar]
- Jerger J, Jerger S, Pirozzolo F. Correlational analysis of speech audiometric scores, hearing loss, age, and cognitive abilities in the elderly. Ear Hear. 1991;12:103–109. doi: 10.1097/00003446-199104000-00004. [DOI] [PubMed] [Google Scholar]
- Klein R, Klein BE, Lee KE. Changes in visual acuity in a population. The Beaver Dam Eye Study. Ophthal. 1996;103:1169–1178. doi: 10.1016/s0161-6420(96)30526-5. [DOI] [PubMed] [Google Scholar]
- Lichtenstein MJ, Bess FH, Logan SA. Diagnostic performance of the Hearing Handicap Inventory for the Elderly (Screening Version) against differing definitions of hearing loss. Ear Hear. 1988;9:208–211. doi: 10.1097/00003446-198808000-00006. [DOI] [PubMed] [Google Scholar]
- Linton KLP, Klein BEK, Klein R. The validity of self-reported and surrogate-reported cataract and age-related macular degeneration in the Beaver Dam Eye Study. Amer J Epidem. 1991;134:1438–1446. doi: 10.1093/oxfordjournals.aje.a116049. [DOI] [PubMed] [Google Scholar]
- Mantel N. Chi-square tests with one degree of freedom; extensions of the Mantel-Haenszel procedure. J Amer Statist Assoc. 1963;58:690–700. [Google Scholar]
- Nondahl DM, Cruickshanks KJ, Wiley TL, Tweed TS, Klein BEK, Klein R. Interexaminer reliability of otoscopic signs and tympanometric measures for older adults. J Amer Acad Audio. 1996;7:251–259. [PubMed] [Google Scholar]
- Popelka MM, Cruickshanks KJ, Wiley TL, Tweed TS, Klein BEK, Klein R. Low prevalence of hearing-aid use among older adults with hearing loss: The epidemiology of Hearing Loss Study. J Amer Geriatric Soc. 1998;46:1075–1078. doi: 10.1111/j.1532-5415.1998.tb06643.x. [DOI] [PubMed] [Google Scholar]
- Tillman TW, Carhart R. Northwestern University Auditory Test No. 6. Brooks Air Force Base, TX USAF School of Aerospace Medicine Technical Report; 1966. An expanded test for speech discrimination utilizing CNC monosyllabic words. [DOI] [PubMed] [Google Scholar]
- Ventry I, Weinstein B. The hearing handicap inventory for the elderly: A new tool. Ear Hear. 1982;3:128–134. doi: 10.1097/00003446-198205000-00006. [DOI] [PubMed] [Google Scholar]
- Wiley TL, Cruickshanks KJ, Nondahl DM, Tweed TS. Self-reported hearing handicap and audiometric measures in older adults. J Amer Acad Audio. 2000;11:67–75. [PubMed] [Google Scholar]
- Wiley TL, Cruickshanks KJ, Nondahl DM, Tweed TS, Klein R, Klein BEK. Tympanometric measures in older adults. J Amer Acad Audio. 1996;7:260–268. [PubMed] [Google Scholar]
- Wilson RH, Zizz CA, Shanks JE, Causey JD. Normative data in quiet, broadband noise and competing message for Northwestern University Test #6 by a female speaker. J Speech Hear Dis. 1990;55:771–778. doi: 10.1044/jshd.5504.771. [DOI] [PubMed] [Google Scholar]


