Abstract
Images with excessive energy at medium spatial frequencies (Fernandez and Wilkins 2008), or that have high color contrast and little or no luminance contrast (Wilkins et al 2008) appear uncomfortable or aversive and can induce headaches in hypersensitive observers. Such stimuli are uncharacteristic of natural images, and we examined whether visual discomfort more generally increases with deviations from the spatial and chromatic properties of natural scenes. Observers rated the level of discomfort or artistic merit in color images generated from noise or random overlapping rectangles (Mondrians). In one set, the slopes of the amplitude spectra for luminance or chromatic contrast were varied independently to create images ranging from strongly blurred to sharpened relative to a “natural” 1/f spectrum. Perceived blur was dominated by the luminance slopes, with discomfort rated lowest for ~1/f spectra. In a second set of focused Mondrians, color was varied along different axes in the LvsM vs. SvsLM chromatic plane. Discomfort ratings were lowest around bluish-yellowish axes that are again typical of natural outdoor scenes. A final set varied in the levels of both luminance and chromatic contrast. Discomfort increased with increasing color contrast or decreasing luminance contrast, and tended toward lower ratings for images with balanced levels of luminance and color contrast. Notably these ratings of discomfort were not related to judgments of artistic merit. Thus for both spatial and chromatic content the least aversive images corresponded to characteristic properties of the natural visual environment, and may reflect a normalization of visual coding to the natural world.
Introduction
Striped patterns are known to produce visual discomfort and can even induce headaches or epileptic seizures in hypersensitive observers (Chatrian et al 1970; Marcus and Soso 1989; Wilkins et al 1984; Wilkins 1995). The discomfort is strongest for the range of medium spatial frequencies (~3 c/deg ±1 octave) for which the visual system is generally most sensitive. Recently Fernandez and Wilkins (2008) showed that discomfort in more complex images could also be accounted for by the extent to which the images contained an excess of energy at medium spatial frequencies. In particular, they examined works of abstract art which were known through public viewings to appear visually uncomfortable. Ratings of discomfort for these images were strongly correlated with higher contrast at medium frequencies. Similar results were found for photographs of natural scenes or for broadband noise filtered to increase or decrease the energy at medium frequencies. Thus their results showed that it was possible to predict visual discomfort for a very wide range of images from a simple property of the spatial statistics of the images (Fernandez and Wilkins 2008).
The uncomfortable images identified through these studies are “unnatural” because they deviate from the spatial statistics typical of natural scenes. Natural images tend to have characteristic frequency spectra in which amplitude falls proportionally with increasing frequency and thus on average varies roughly as f−1 (or with a slope of −1 for log amplitude vs. log frequency; (Field 1987)). The mid-frequency “bump” is thus an excess of energy relative to the 1/f slope (Fernandez and Wilkins 2008). Many aspects of spatial coding in the visual system may be matched to the 1/f spatial structure of the visual environment (Atick 1990; Field 1987; Parraga et al 2000; Srinivasan et al 1982), and thus images with a different structure might appear uncomfortable because they are stimuli for which visual mechanisms are not well matched. In this study our aim was to explore this idea to ask more generally whether visual discomfort increases as image statistics deviate from those of natural scenes. We compared discomfort ratings for images with amplitude spectra filtered to vary over a range of exponents. More negative exponents steepen the fall-off in amplitude with frequency and cause the images to appear blurred, while more positive exponents lead to shallower slopes and cause the images to appear too sharp. Variations in slope thus correspond roughly to the perceived physical focus of the images (Field and Brady 1997; Webster et al 2002).
Natural scenes also tend to have characteristic color statistics. These are less well defined and may be more variable across environments than a statistic such as the slopes of the amplitude spectra (which also vary across images), yet they again reflect properties of the world for which visual coding is likely to be optimized (Atick et al 1993). For example, spatial variations in chromatic contrast also tend to have a 1/f spectrum, but may be steeper for some classes of images (e.g. close-ups of fruit), which has been suggested as a possible reason for differences in spatial coding for luminance and color (Parraga et al 2002). Natural scenes also have characteristic color gamuts, for example, with higher contrasts along a restricted range of directions in color space, or with typical ratios between luminance and chromatic contrast (Ruderman et al 1998; Webster et al 2007; Webster and Mollon 1997). Deviations from these characteristic properties might therefore again predict differences in visual comfort. For example, Wilkins et al (2008) found that ratings of discomfort from spatial gratings increased with increasing chromatic contrast and were especially strong for isoluminant gratings (though this could also reflect the fact that isoluminant patterns are a weak stimulus for accommodation; Switkes et al 1990; Wolfe and Owens 1981). In the present study we specifically explored the relationship between discomfort and the naturalness of both the color and spatial variations in images.
Recent studies have also explored the relation between natural scene statistics and the aesthetic quality of images (Redies 2007). For example, paintings from representational art have been found to have amplitude spectra with slopes similar to those of natural scenes (Graham and Field 2007), and even highly abstract paintings like Jackson Pollock’s drip paintings have a fractal dimension (a statistic related to spectral slope) consistent with natural scenes (Taylor et al 1999). Aesthetic judgments decrease as fractal dimension deviates from natural levels (Spehar et al 2003). Moreover, Fernandez and Wilkins (2008) found that ratings of discomfort and artistic merit tended to be negatively correlated for the images they examined with biased amplitude spectra, again because the natural spectra tended to be perceived as less uncomfortable but also more aesthetically pleasing. A final aim of our work was therefore to assess the relationship of both aesthetic and discomfort ratings to the color and spatial statistics of natural scenes.
Methods
Stimuli
All experiments were conducted with two versions of “noise” which allowed us to represent the statistical properties of images without tying these statistics to actual objects. In the first case the noise was created by selecting each pixel value from three random Gaussian distributions controlling the luminance contrast or the LvsM or SvsLM chromatic contrasts. Contrasts were based on a variant of the MacLeod-Boynton (MacLeod and Boynton 1979) chromaticity diagram scaled to roughly equate variations along the three axes according to the following equations:
| Equation 1 |
Where rmb, bmb are the chromaticity coordinates in the MacLeod-Boynton space; 0.6568, 0.01825 are the r,b coordinates of Illuminant C; and LUM corresponds to the luminance relative to the mean luminance (42 cd/m2) in the image [(I-Imean)/Imean]. Isoluminance for the images was defined photometrically and thus no attempt was made to equate the luminances of different colors for individual observers or to correct for chromatic aberrations. Chromatic variations in the images thus necessarily included luminance artifacts, though for most conditions these were likely to be masked by the large added luminance variations in the stimulus (Regan et al 1994).
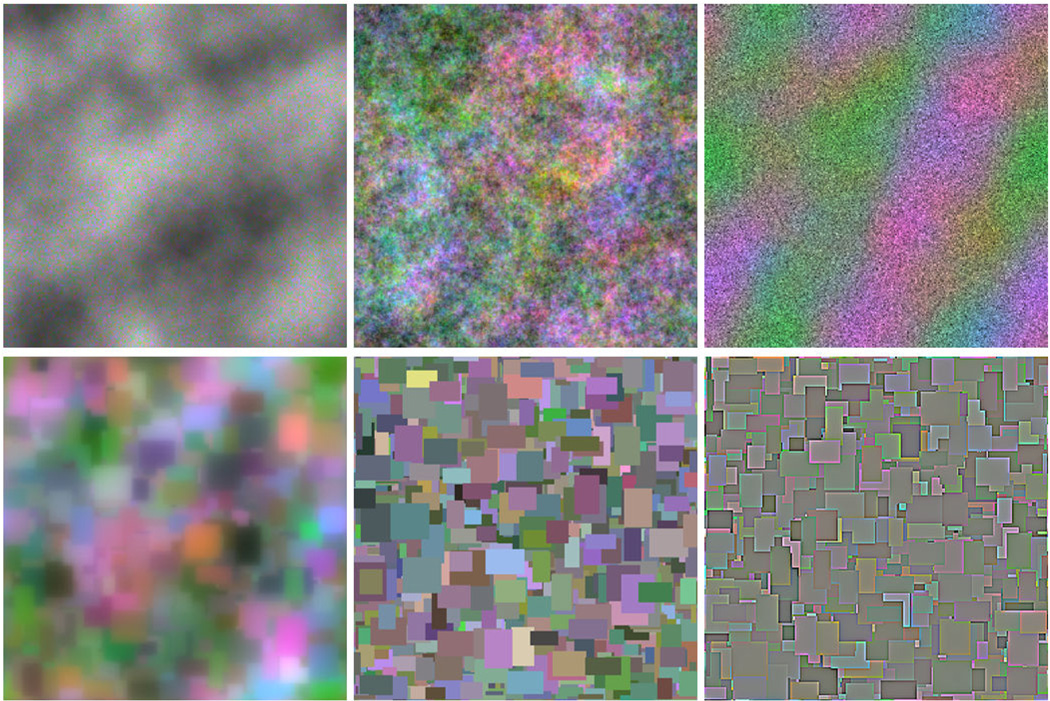
In the second image set, each image was created by again randomly selecting the color and luminance, but this time for rectangles of random size and location in order to form a dense overlapping collage. The resulting images were therefore similar to Mondrian patterns (Land 1983) and had the same color and amplitude spectra as the preceding noise but differed in their phase spectra. For both, the amplitude spectra of the images were then filtered to vary over a range of spectral slopes ranging from −2 (strongly blurred) to 0 (strongly sharpened), with the image contrasts rescaled after filtering to maintain a constant rms contrast of 0.25 (or 17.5 based on Equation 1). Different experiments used variants of these basic stimuli to test specific color or spatial properties. Figure 1 shows examples of the two types of patterns.
Figure 1.
Examples of the noise (top) and Mondrian (bottom) images. The different examples illustrate the effects of varying the slope of the amplitude spectra to independently blur or sharpen the luminance or chromatic components of the images.
Apparatus
The images were displayed on a 20in Sony Trinitron 500PS monitor (resolution 800 × 600), controlled by a Cambridge Research Systems VSG card with a refresh rate of 60 Hz. Gun levels on the monitor were gamma corrected. The images were shown with a resolution of 600 × 600 pixels centered on the monitor on a gray background with the same mean luminance and chromaticity. Observers viewed the display binocularly from a distance of approximately 118cm, giving the images a visual angle of 14.7°. The room was otherwise dark.
Procedure
Each image was shown on the monitor for 10s. Afterward, it was replaced by a gray screen displaying “Rate Picture DISCOMFORT” and a 7-point scale, with 1 being “None at all” and 7 being “A lot”. After 3s, the gray screen instead displayed “Rate Picture ARTISTIC MERIT” along with the same 7-point scale. The timing and format of the scale was the same as that used by Fernandez & Wilkins (2008). Observers responded using a handheld computer number pad. If they missed a rating, the trial repeated. The order of the images was randomized, and the set included 3 to 5 repeated examples of each image level depending on the experiment.
Observers
A total of 61 observers were tested in different sets of experiments (mean age of 24.1, range of 18–66, 48 female). All were undergraduate students at the University of Nevada who participated for course credit. Informed consent and testing procedures followed protocols approved by the university’s Institutional Review Board.
Results
Experiment 1: Variations in amplitude spectrum slope
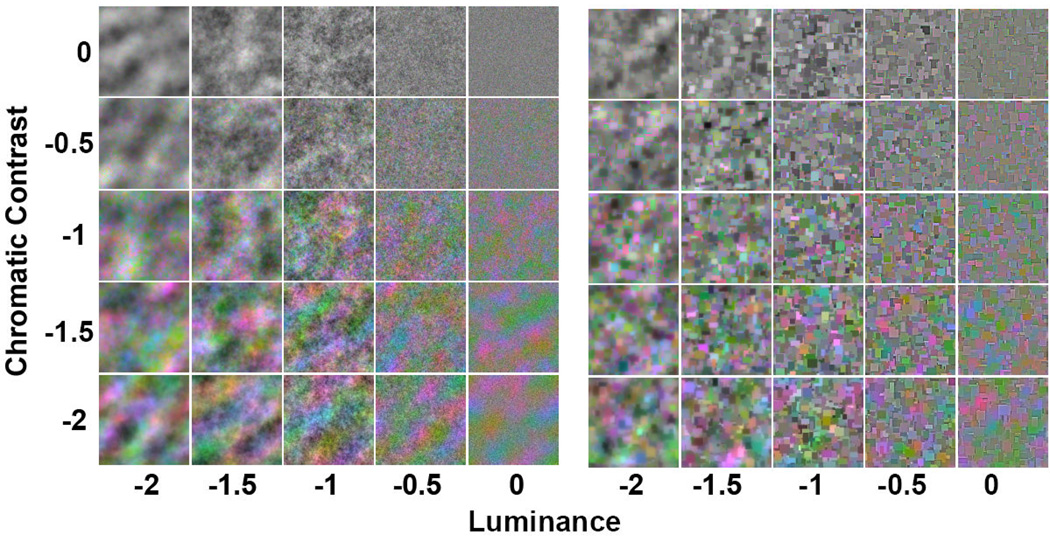
In the first case we examined ratings of discomfort and artistic merit for images that varied in the slope of their amplitude spectra. Slopes ranged from −2 to 0 in steps of 0.5, and again were adjusted after filtering to maintain a constant rms contrast. Slopes for luminance and chromatic contrast were varied independently forming a set of 25 stimulus levels (see Fig 2). Note that in the case of chromatic contrast the slopes of the LvsM and SvsLM axes always had the same value. Three random images were produced for each combination of image type and each luminance and chromatic contrast combination, producing a total of 150 images (= 2 (noise images or Mondrians) × 5 (luminance slope) × 5 (chromatic slope) × 3 (examples)). Ratings for the complete image set were made by 20 observers (mean age of 22.2, range of 18–30, 17 female).
Figure 2.
Noise (left) or Mondrian (right) images for testing the effects of spectral slope on visual discomfort. The slope of the amplitude spectrum for luminance contrast varies along the horizontal axis, while the varying slopes for the chromatic contrast are shown along the vertical axis.
Discomfort
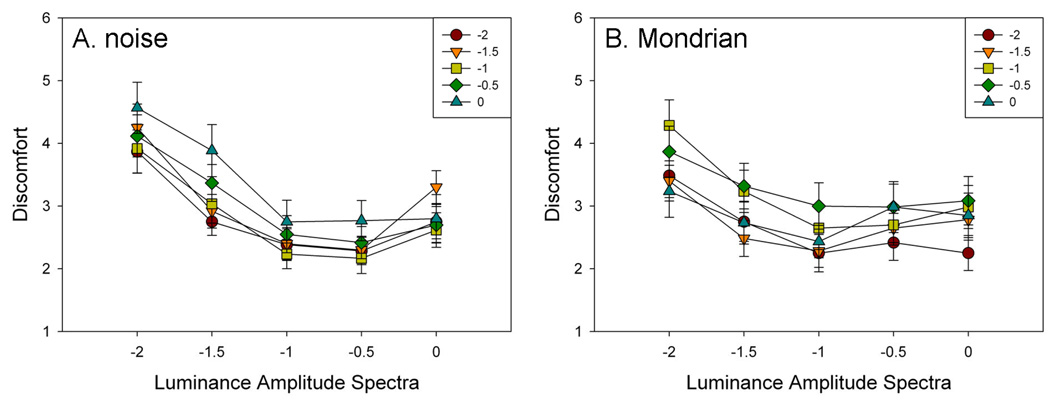
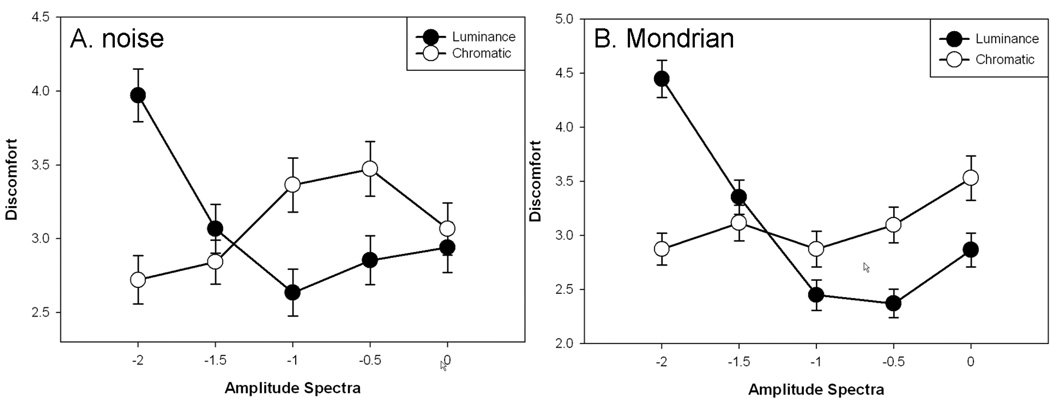
Figure 3 shows the ratings for the individual combinations of luminance and chromatic slope while Figure 4 plots the ratings for the different luminance slopes collapsed across chromatic slopes or vice versa. For the noise, there was a main effect of luminance slope on ratings of discomfort (F(4,76) = 10.94, p<.001, see Figure 4a). Post-hoc Holm-Sidak multiple comparison t-tests revealed that ratings of discomfort were higher for a luminance slope of −2 than for all other slopes (min t=4.07, max p<.0001). A main effect wahan for all other atic contrast (F(4,76)=5.90, p<.001). Holm-Sidak tests revealed that ratings of discomfort were lower for chromatic contrast slopes of −2 and −1.5 than for −0.5 and −1 (min t=2.82, max p=.006). There was also a significant interaction between luminance and color levels (F(16,304)=1.96, p=.016) reflecting a decreased effect of chromatic slopes for increasing luminance slopes.
Figure 3.
Ratings of discomfort as a function of the slope of the luminance or chromatic amplitude spectra, for the unstructured (A) noise or (B) Mondrian images.
Figure 4.
Ratings of discomfort as a function of the slope of the amplitude spectrum for luminance averaged across chromatic slopes or vice versa, for the unstructured (A) noise or (B) Mondrian images.
Ratings for the Mondrians were very similar. As with the noise there was a main effect of luminance slope (F(4,76) = 22.01, p<.001, see Figure 4b), again with post-hoc Holm-Sidak tests revealing that ratings of discomfort were higher for −2 than for all other slopes (min t= 4.43, max p<.0001), and higher for −1.5 than for −1 (t=3.38, p=.001) or −0.5 (t=3.74, p=.0004). A main effect was again also observed for chromatic contrast (F(4,76)= 4.64, p=.002), with discomfort ratings higher for 0 than for −1 (t=3.75, p<.001) and −2 (t=3.66, p=.0005). Finally, there was also a significant interaction (F(16,304)= 2.70, p<.001) due to a decreased effect of luminance slope for a chromatic contrast slope of −2.
The luminance ratings for both image types thus paralleled the results of Fernandez and Wilkins (2008) in tending toward least discomfort for images with the most natural spectra (f−1), and in particular, showed greatest discomfort for images with strong luminance blur. On the other hand, the relationship between natural spatial spectra and visual comfort is less certain for the chromatic slopes. In this case ratings tended to show lowest discomfort for the most blurred chromatic components. As noted in the introduction, the amplitude spectra of chromatic variations are not as well defined but for some images are steeper than for luminance (Parraga et al 2002). It is notable that the chromatic slopes could influence the ratings at all, for the perceived focus of images is strongly dominated by the luminance spectra (Wandell 1995). For example the column of images in Figure 2 corresponding to a luminance slope of −1 all appear roughly in focus despite large variations in the chromatic slope, while the row of images with a chromatic slope of −1 clearly vary from blurred to sharpened as the luminance spectrum changes. Yet despite this, observers are sensitive to the level of chromatic blur in images (Webster et al 2006; Wuerger et al 2001) and the present results suggest that these levels can also vary the perceived discomfort in images.
Artistic merit
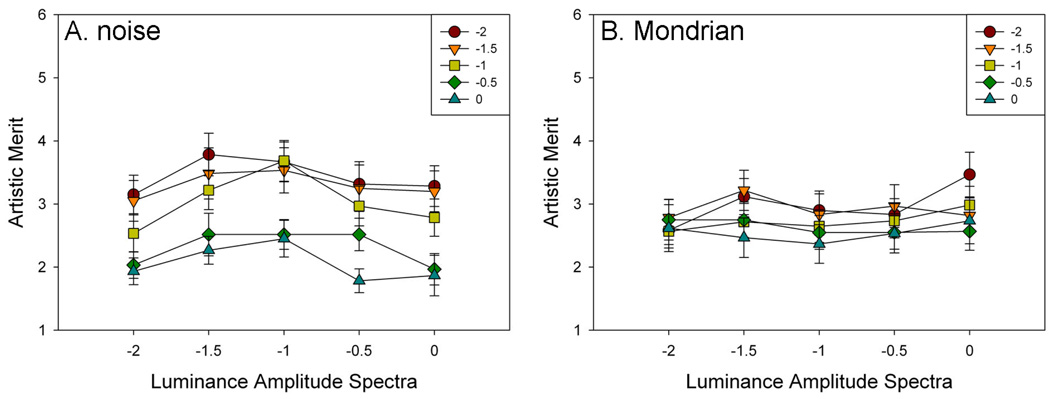
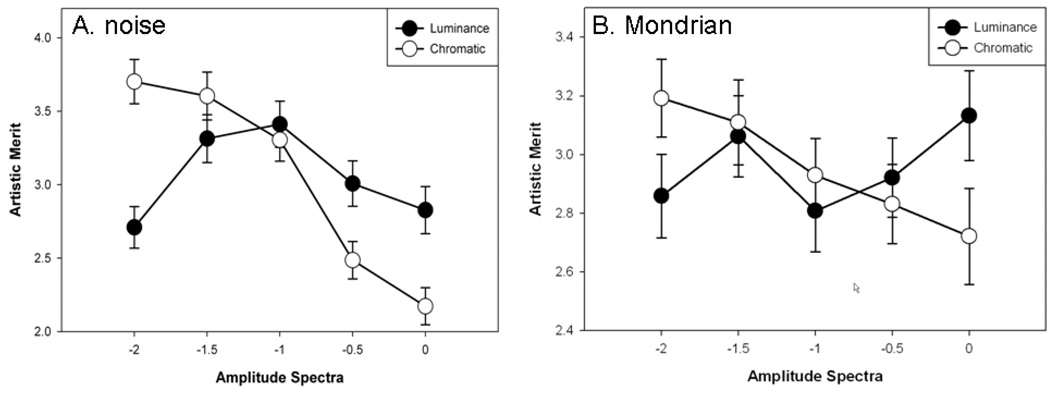
Figure 5 shows the ratings for the individual combinations of luminance and chromatic slope while Figure 6 plots the ratings for the different luminance slopes collapsed across chromatic slopes or vice versa. For the unstructured noise images there was again a main effect of luminance slope (F(4,76) = 7.44, p=.003, see Figure 6a). Holm-Sidak tests revealed that ratings of artistic merit were higher for −1 than for −2 (t=3.44, p=.0005), −0.5 (t=2.20, p=.015), and 0 (t=3.01, p=.002). A main effect was also observed for chromatic slope (F(4,76)= 22.21, p<.001), with ratings higher for −2, −1.5, and −1 than for −0.5 and 0 (min t=3.95, max p=.01). Moreover, in this case there was no evidence of an interaction (F(16,304)=1.08, p=.38). ). In contrast, for the Mondrians there was not a main effect of luminance slope (F(4,76) = 1.02, p=.40), and only a marginal effect was observed for chromatic slope(F(4,76)= 2.41, p=.06, see Figure 6b), where rating of artistic merit decreased with increasing chromatic contrast slope. For these images there was also no evidence of an interaction (F(16,304)=1.65, p=.06).
Figure 5.
Ratings of artistic merit as a function of the slope of the luminance or chromatic amplitude spectra, for the unstructured noise (left) or Mondrian (right) images.
Figure 6.
Ratings of discomfort as a function of the slope of the amplitude spectrum for luminance averaged across chromatic slopes or vice versa, for the unstructured noise (left) or Mondrian (right) images.
Overall, the pattern for artistic merit tended to oppose the pattern for discomfort. Specifically, images that were rated as the least uncomfortable tended to also be given the highest aesthetic rating. This also parallels the findings of Fernandez and Wilkins (2008) for images with increased energy at mid frequencies, and is consistent with reports that images with more natural spatial statistics appear more aesthetic (Spehar et al 2003). However, the two ratings are not simply measuring the same perceptual judgment. Discomfort and artistic merit showed a moderate negative correlation (r = −.465, p = .019) for the noise images based on the mean responses of observers, but did not reach significance for the Mondrians (r = −.229, p = .27). Moreover, when the relationship was assessed for individual observers’ settings rather than the mean ratings, for the noise images there was only a weak negative correlation (r = −.120, p=.007), while a negligible correlation was obtained for the Mondrians (r = .098, p=.028).
Experiment 2: Variations in color axis
In the remaining experiments we explored the effects of image color and contrast variations on visual discomfort and aesthetic ratings. These experiments used only the “focused” Mondrian patterns (slope = −1). In the first instance, color was varied by restricting palette colors to random values along a single axis within the LvsM and SvsLM plane. The chromatic contrasts spanned a range from −70 to 70. Color axes within the plane ranged from the 0°–180° LvsM axis (reddish to greenish) to the 157.5°–337.5° axis (approximately cyan to orange) in steps of 22.5°. Examples of the resulting images are shown in Figure 7. Five random images were produced for each color axis producing a total of 40 images (= 8 (color axes) × 5 (examples)). Ratings were obtained as in the preceding experiment by a new set of 27 observers (mean age of 24.0, range of 18–44, 21 female).
Figure 7.
Examples of images used to probe the effects on discomfort of different chromatic axes. Angles below each image give the axis within the color plane defined by equation 1.
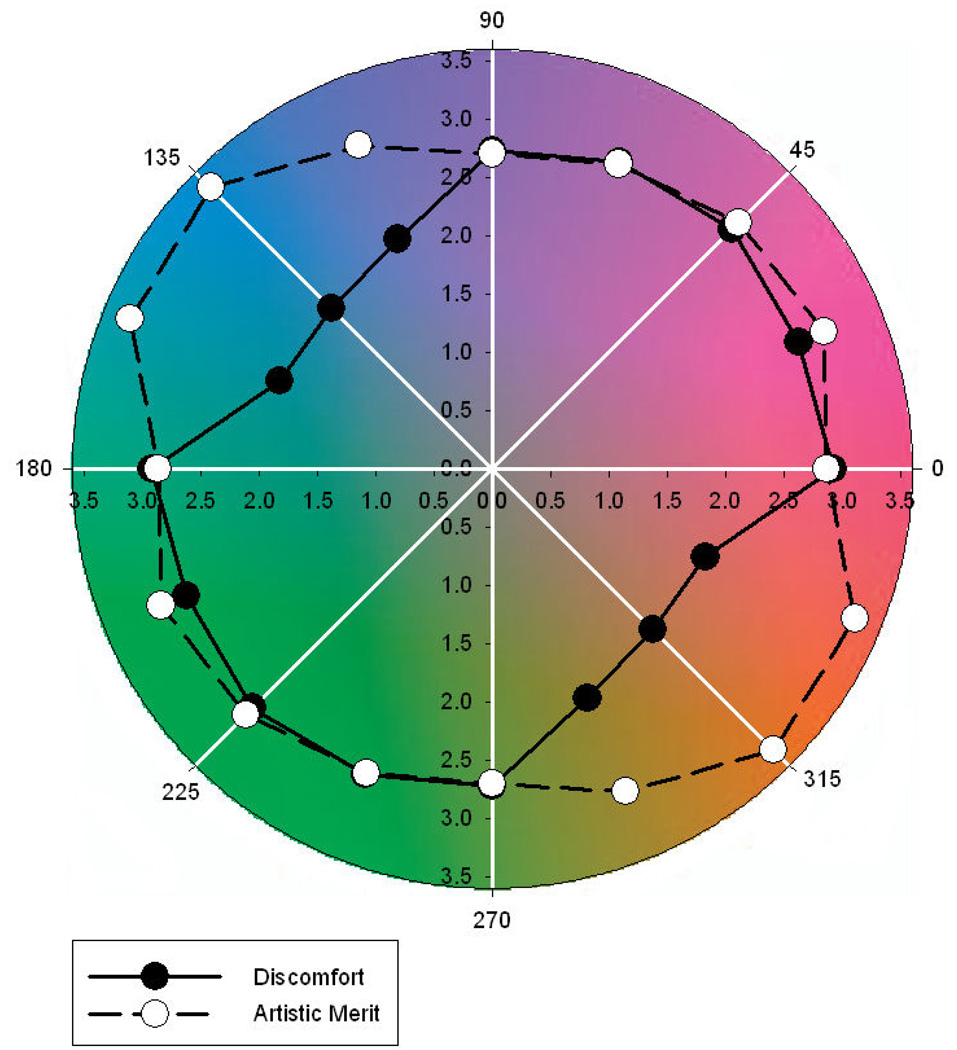
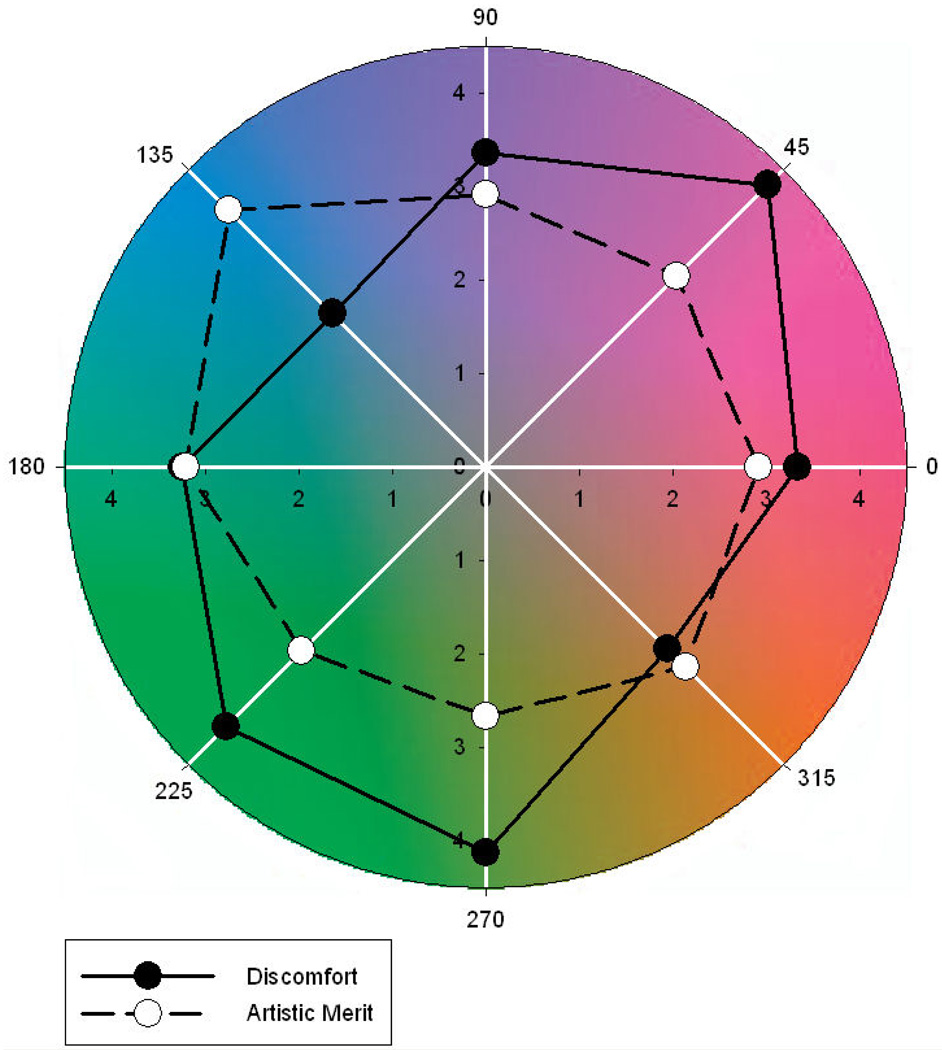
Figure 8 illustrates the ratings for both discomfort and artistic merit as function of the color axis. There was a significant main effect of axis on ratings of discomfort (F(7,182) = 13.54, p<.001). Holm-Sidak tests revealed that ratings of discomfort were lower for 157.5–337.5°, 135–315°, and 112.5–292.5° than for all other color axes (min t=3.54, max p=.0005). There was also a significant effect of color axis on artistic merit (F(7,182) = 2.51, p=.018, see Figure 9), with higher ratings for 157.5–337.5° and 135–315° than for 90–270° (min t=2.95, max p=.002). There was no evidence of a correlation between ratings of discomfort and artistic merit based on the individual settings (r = −.023, p=.74), yet mean settings for the two ratings across observers showed a strong negative correlation (r = −.774, p = .024).
Figure 8.
Ratings of visual discomfort and artistic merit as a function of angle within the chromatic plane. Ratings are plotted as distance from the origin. Note that points 180 deg apart are from the same axis and this have the same ratings.
Figure 9.
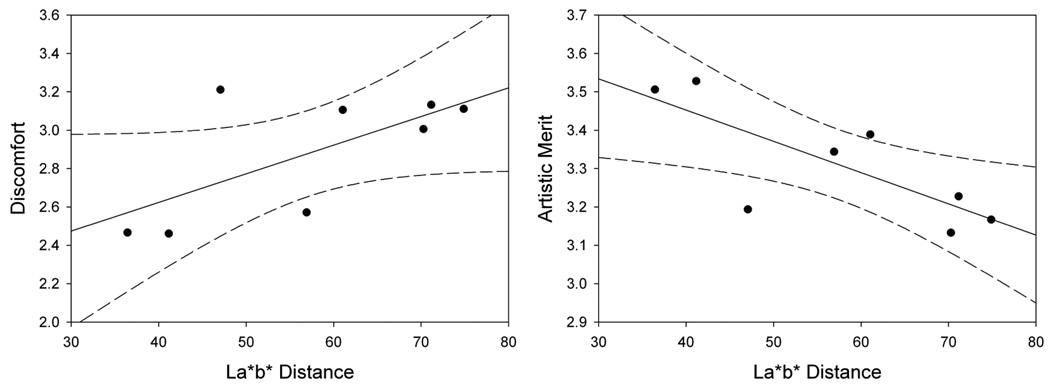
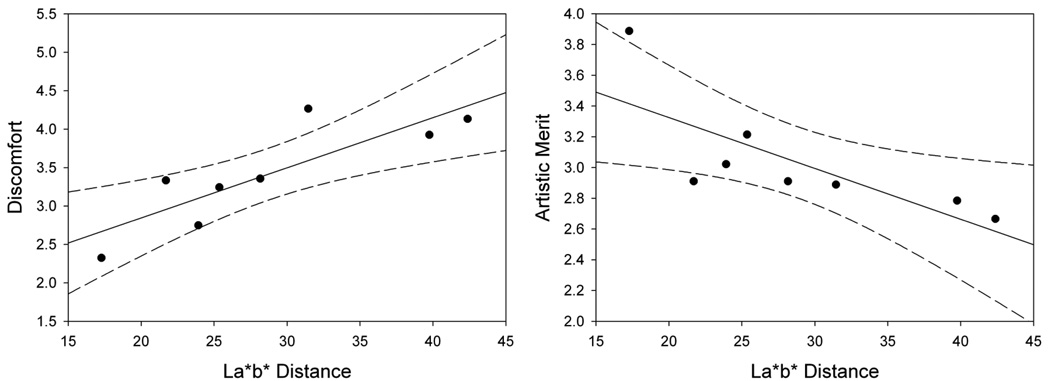
Ratings for discomfort and artistic merit as a function of color axis contrast within the CIE L a b space (dotted lines indicate 95% confidence intervals).
The results for the different color axes are again at least consistent with the possibility that images with natural color properties are perceived as less uncomfortable and more aesthetic. Specifically, many natural outdoor environments have a bluish-yellowish bias in their color distribution, with principal axes for individual scenes or environments ranging roughly from 90–270° (for more lush environments) to 135–315° (for more arid environments) (Ruderman et al 1998; Shevell and Kingdom 2008; Webster et al 2007; Webster and Mollon 1997). The present results suggest that images centered around the blue-yellow axis have significantly lower ratings of discomfort and higher ratings of artistic merit. There is little evidence that the cardinal LvsM and SvsLM axes are special for these judgments, even though these axes represent the primary dimensions of early color coding and have been suggested to be matched to variations in the natural color environment, which may more nearly fall along the SvsLM axis for scenes dominated by foliage (Ruderman et al 1998). However, blue-yellow variations are characteristic of many ecosystems including the general Reno environment in which our observers live (which might be described as more seedy than leafy). It would be of interest to test observers immersed in more lush environments to explore the extent to which the ratings might be shaped by the individual’s experience.
An alternative – and not incompatible – account of the effect of color axis is that the ratings depend on stimulus contrast rather than hue angle, and that equivalent contrasts in terms of the LvsM and SvsLM axes are not equivalent perceptually. In fact, constant color differences in uniform color spaces also show a blue-yellow bias (McDermott et al., in press), so that larger color differences are required to produce an equivalent contrast along the blue-yellow direction compared to other directions. By this account then, the blue-yellow axes might appear more comfortable because they have lower chromatic contrast. Figure 9 replots the ratings as a function of the image chromatic contrasts within the CIE Lab perceptually uniform color space. Here it is evident that discomfort tends to increase (r=.67, p=.07) and artistic merit tends to decrease (r=−.77. p=.03) with the perceptual color difference as defined by this metric. Again however, this is not inconsistent with an account based on environmental color statistics, because a visual system adapted to a bluish-yellowish environment should perceive color differences along this axis as less salient. Thus the ratings in terms of their perceptual contrasts in fact lend further support to the possible link between visual discomfort and the characteristics of the natural environment.
Experiment 3: Variations in mean color
In the preceding conditions all images were defined to have the same average color (a neutral gray with the chromaticity of Illuminant C). We also assessed the effect of a variation in the mean chromaticity. For these images the color contrasts varied between 0 and 70 units so that the average chromaticity had a value of 35 rather than 0, while the hue angle ranged from the 0° to 315° in steps of 45°. Examples are illustrated in Figure 10. Five random images were produced for each color angle producing a total of 40 images (= 8 (color angle) × 5 (examples)). Ratings for the images were made by the same 27 observers who participated in Experiment 2, with the images from both conditions randomly interleaved within the same block of trials.
Figure 10.
Examples of images used to probe the effects on discomfort of differences in mean color. Angles below each image give the angle of the mean color bias.
The mean color of the images had a significant effect on ratings of discomfort (F(7,182) = 22.5, p<.001, see Figure 11). Holm-Sidak tests revealed that ratings of discomfort were lower for 135° than for all other angles (min t=4.58, max p<.001) except 315° (t=2.10, p=.04). Ratings of discomfort for 315° were lower than all other angles (min t=2.92, max p=.002) except for 180° where it was only marginally lower (t=2.47, p=.007). Discomfort ratings for 45°, 225°, and 270° were also significantly higher than for 0°, 90°, and 180° (min t=2.842, max p=.005). There was also a main effect of color angle on artistic merit (F(7,182) = 4.23, p<.001, see Figure 12). Holm-Sidak tests revealed that ratings of artistic merit were higher for 135° than for all other angles (min t=3.32, max p=.001) except 180° (t=2.58, p=.005). Finally, a weak negative correlation was again found between ratings of discomfort and artistic merit for individual settings (r = −.15, p=.03), but was again strong for the mean settings (p = −.799, p = .0098). Thus as before, the ratings for both discomfort and artistic merit follow the blue-yellow bias characteristic of many natural environments. Further, the ratings are again also consistent with the lower perceptual contrast along these axes, with discomfort tending to increase (r=.84, p=.008) and artistic merit tending to decrease (r=−.76. p=.03) with the perceptual color difference within the CIE Lab perceptually uniform color space (Figure 12).
Figure 11.
Ratings of visual discomfort and artistic merit as a function of the angle of the mean hue bias in the image. Ratings are plotted as distance from the origin. Note that in this experiment points 180 deg apart correspond to different mean hues and thus were rated independently.
Figure 12.
Ratings for discomfort and artistic merit as a function of mean color contrast within the CIE L a b space (dotted lines indicate 95% confidence intervals).
Experiment 4: Variations in luminance and chromatic contrast
In the final experiment we assessed the effects of changes in the contrast of the luminance and chromatic components in the images. Mondrians with different balances of luminance and color were created by independently varying the luminance and chromatic contrast. The rms contrasts spanned a range from 0 to 0.8 in the geometric sequence 0, 0.05, 0.1, 0.2, 0.4, 0.8 (a range of 0 to 56 in the contrasts defined by equation 1). Examples of images spanning the range of contrasts are shown in Figure 13. Five random images were produced for each combination of levels producing a total of 180 images (= 6 (luminance contrasts) × 6 (chromatic contrasts) × 5 (examples)). 14 new observers (mean age of 27.2, range of 20–66, 10 female) participated in this experiment.
Figure 13.
Examples of images with “balanced” luminance and color over the range of absolute contrasts tested.
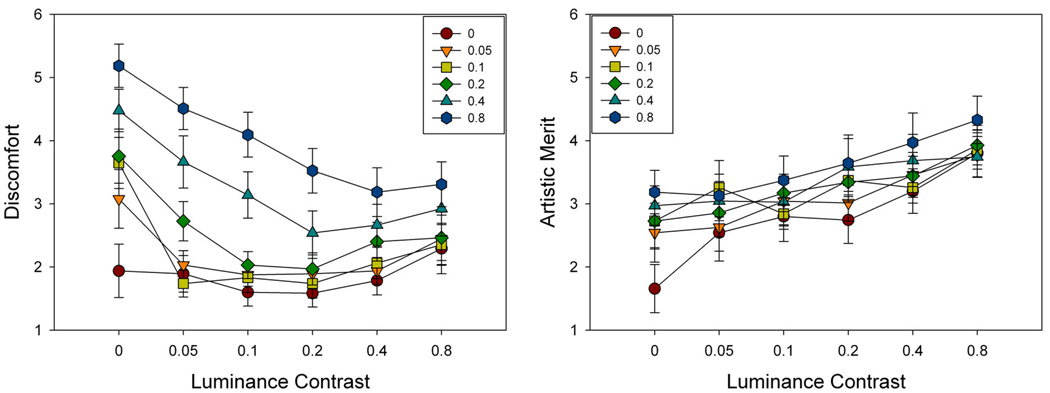
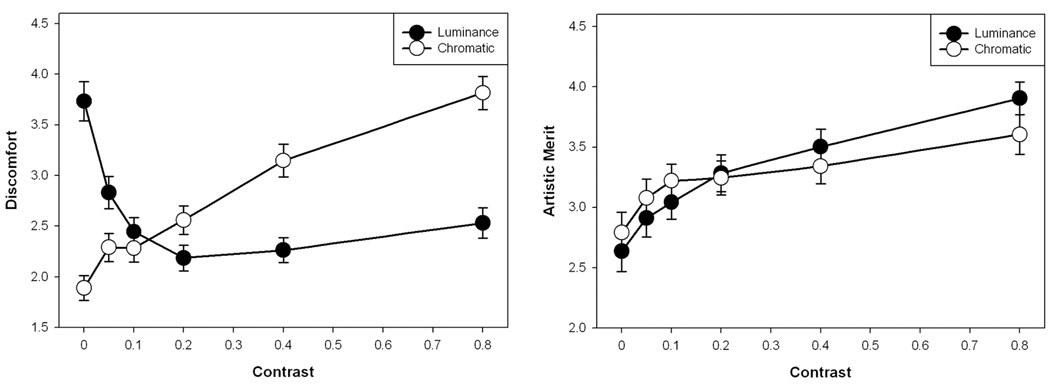
Figure 14 plots the ratings for each of the stimulus contrast levels, while Figure 15 shows the ratings for luminance collapsed across color or vice versa. There was a main effect of luminance contrast on ratings of discomfort (F(5,65) = 11.26, p<.001). Holm-Sidak tests revealed that ratings of discomfort were higher for 0 luminance contrast than for all other contrasts (min t=3.75, max p=.0004). An opposite main effect was observed for chromatic contrast (F(5,65) = 21.67, p<.001, see Figure 15a). Here Holm-Sidak tests revealed that ratings of discomfort were higher for chromatic contrasts of 0.8 than for all other contrasts (min t=3.14, max p=.003). Ratings of discomfort for 0.4 were also higher than for all lower chromatic contrasts (min t=2.76, max p=.007), while discomfort ratings for 0.2 were higher than for 0 (t=3.14, p=.003). The interaction between luminance and color was also significant (F(25,325) = 6.34, p<.001). Surprisingly, for this image set there was also a positive correlation between individual ratings of discomfort and artistic merit (r = .239, p<.0001, see Figure 15b), though this was not present in the mean ratings (r = .035, p = .84).
Figure 14.
Ratings for visual discomfort (left) or artistic merit (right) as a function of different combinations of luminance or chromatic contrast in the images.
Figure 15.
Ratings for visual discomfort (left) or artistic merit (right) as a function of the luminance or chromatic contrast in the images.
The results for luminance showed that as contrast increased from 0, visual discomfort rapidly decreased while artistic merit increased, with shallower changes at higher contrasts. This pattern could in part reflect the increasing visibility of the stimuli. However, as noted, an opposite trend was found for chromatic contrast, where discomfort steadily increased with increasing contrast, and the strongest discomfort levels were associated with the nominally isoluminant patterns. A similar result was reported for gratings by Wilkins et al. (2008). Such isoluminant patterns are highly unnatural, and thus again consistent with an association between discomfort and deviations from natural image statistics. However, as noted the discomfort associated with these images also could reflect factors such as accommodative demand, since color differences are poor at supporting accommodation (Switkes et al 1990; Wolfe and Owens 1981).
Luminance variations in natural scenes can vary over an enormous range because of factors such as specular reflections, and this range is thus difficult to mimic in images (Graham and Field 2007). More germane to the present analysis is how discomfort varied with the relative levels of luminance and chromatic contrast. The scaling we chose for equating luminance and chromatic contrasts very roughly approximates their balance in natural environments (Webster and Mollon 1997). We might therefore expect images with equal luminance and chromatic values to be more “natural” and thus perceived as more comfortable. Figure 14 shows that there is a weak trend in this direction – for the minima in the ratings for luminance contrast shift to progressively higher values as chromatic contrast increases. However, this trend is at best only suggestive because the ratings vary only gradually with the contrast changes.
Discussion
Natural scenes have characteristic spatial and chromatic properties (Simoncelli and Olshausen 2001). Here we asked whether these properties tend to appear less aversive and more aesthetic as visual stimuli to observers. For each of the cases we examined there was a trend for ratings of discomfort to be lowest around natural levels. These included focused images in stimuli with amplitude spectra varying from blurred to sharpened; bluish-yellowish images in stimuli that varied in hue; and – to a weaker extent – images with balanced luminance and chromatic variations in stimuli that varied in contrast. This suggests that in general, discomfort in images may tend to vary with the degree to which images deviate from natural scene statistics. Each of the properties we tested reflects a relatively lower-order statistic of images. It would be of interest to explore whether these effects also generalize to higher-order scene statistics.
The present results leave open the question of whether or why certain deviations might lead to more pronounced discomfort, and in particular, do not address why images with a mid-frequency bias have been found to be especially aversive (Fernandez and Wilkins 2008). The relative discomfort of different frequencies approximates the contrast sensitivity function, so that it may in part be the relative sensitivity to the deviation rather than a qualitatively different response that underlies the apparent potency of some images for creating discomfort. Consistent with this possibility is our finding that blurring or sharpening the spatial variations in chromatic contrast had weaker effects on discomfort, as the visual system is less sensitive to chromatic contrast as compared to luminance contrast (Webster et al 2006). On the other hand, patterns like gratings may also include unique visual characteristics such as positional uncertainty that may contribute to their pronounced discomfort (Wilkins 1995).
Why should an unnatural image appear uncomfortable? Wilkins (Wilkins et al 1984; Wilkins 1995) suggested that the discomfort associated with gratings resulted in part because they produce unnaturally strong neural responses and produce hyper-excitable responses in individuals susceptible to migraine or epilepsy. More recently Wilkins and colleagues (2008) have also shown that perceived discomfort in chromatic gratings also correlates with levels of neural excitation. A similar principle may underlie the lower levels of discomfort associated with natural image statistics. Visual coding is thought to be optimized to efficiently represent natural scenes (Atick 1990; Barlow 1981; Olshausen and Field 2004), and thus to form sparse representations that make the most economical use of neural responses (Lennie 2003). Stimuli that deviate from the predicted pattern should lead to less efficient and thus stronger responses, and potentially through this to discomfort.
Neural activity level obviously cannot account for all of the effects of stimulus variations on discomfort (e.g. the finding that discomfort decreased with increasing luminance contrast). However, it is generally consistent with the notions of both predictive and norm-based coding that visual responses are designed to register the errors in prediction or how responses deviate from the norm, so that the norms themselves induce the weakest response levels. Response patterns like this are found from color opponency to face perception (Webster et al 2005). In this regard the present results are of interest because they suggest that properties of images such as their blur level or relative contrast could also involve a norm-based code. The results also hint at an intriguing link between discomfort and the stimuli that drive many forms of perceptual adaptation, for in both it may be deviations from the norm that are important.
As noted in the Introduction, a number of recent studies have also explored the relationship between natural image statistics and visual aesthetics. It remains uncertain whether art images tend to mimic the properties of natural scenes in order to be perceived as more pleasing or simply because they need to be perceived (Graham and Field 2008; Redies 2007). It is also uncertain to what extent aesthetics can be tied to a norm. For example, facial attractiveness generally increases for faces that are closer to the average and thus less distinctive (Langlois and Roggman 1990), whereas color aesthetics show that many saturated hues are preferred to gray (Schloss and Palmer 2009). In many cases however, a correspondence has been found between aesthetic preferences and natural statistics (e.g. (Redies et al 2007; Spehar et al 2003; Taylor et al 1999). Similarly in the present study there was a tendency for images with natural spatial or chromatic properties to be rated with higher artistic merit and consequently for artistic merit and discomfort to vary inversely. However, this relationship was weak when the ratings of individual observers was considered, and in some cases reversed (e.g. for increasing color contrast, for which both merit and discomfort increased). This suggests that, even for the relatively simple patterns we examined, somewhat different principles or processes contribute to visual discomfort and visual aesthetics, and that of these two it is visual discomfort that is more closely tied to the statistics of the image.
Acknowledgments
Supported by EY-10834
References
- Atick JJ. Could information-theory provide an ecological theory of sensory processing. Network - Computation in Neural Systems. 1990;3:213–251. doi: 10.3109/0954898X.2011.638888. [DOI] [PubMed] [Google Scholar]
- Atick JJ, Li Z, Redlich AN. What does post-adaptation color appearance reveal about cortical color representation? Vision Res. 1993;33:123–129. doi: 10.1016/0042-6989(93)90065-5. [DOI] [PubMed] [Google Scholar]
- Barlow HB. The Ferrier Lecture, 1980. Critical limiting factors in the design of the eye and visual cortex. Proc R Soc Lond B Biol Sci. 1981;212:1–34. doi: 10.1098/rspb.1981.0022. [DOI] [PubMed] [Google Scholar]
- Chatrian GE, Lettich E, Miller LH, Green JR. Pattern-sensitive epilepsy. I. An electrographic study of its mechanisms. Epilepsia. 1970;11:125–149. doi: 10.1111/j.1528-1157.1970.tb03876.x. [DOI] [PubMed] [Google Scholar]
- Fernandez D, Wilkins AJ. Uncomfortable images in art and nature Perception. 2008;37:1098–1113. doi: 10.1068/p5814. [DOI] [PMC free article] [PubMed] [Google Scholar]
- Field DJ. Relations between the statistics of natural images and the response properties of cortical cells. J Opt Soc Am A. 1987;4:2379–2394. doi: 10.1364/josaa.4.002379. [DOI] [PubMed] [Google Scholar]
- Field DJ, Brady N. Visual sensitivity, blur and the sources of variability in the amplitude spectra of natural scenes. Vision Res. 1997;37:3367–3383. doi: 10.1016/s0042-6989(97)00181-8. [DOI] [PubMed] [Google Scholar]
- Graham DJ, Field DJ. Statistical regularities of art images and natural scenes: spectra, sparseness and nonlinearities. Spat Vis. 2007;21:149–164. doi: 10.1163/156856807782753877. [DOI] [PubMed] [Google Scholar]
- Graham DJ, Field DJ. Variations in intensity statistics for representational and abstract art, and for art from the Eastern and Western hemispheres. Perception. 2008;37:1341–1352. doi: 10.1068/p5971. [DOI] [PubMed] [Google Scholar]
- Land EH. Recent advances in retinex theory and some implications for cortical computations: color vision and the natural image. Proc Natl Acad Sci U S A. 1983;80:5163–5169. doi: 10.1073/pnas.80.16.5163. [DOI] [PMC free article] [PubMed] [Google Scholar]
- Langlois JH, Roggman LA. Attractive faces are only average. Psychological Science. 1990;1:115–121. [Google Scholar]
- Lennie P. The cost of cortical computation. Curr Biol. 2003;13:493–497. doi: 10.1016/s0960-9822(03)00135-0. [DOI] [PubMed] [Google Scholar]
- MacLeod DI, Boynton RM. Chromaticity diagram showing cone excitation by stimuli of equal luminance. J Opt Soc Am. 1979;69:1183–1186. doi: 10.1364/josa.69.001183. [DOI] [PubMed] [Google Scholar]
- Marcus DA, Soso MJ. Migraine and stripe-induced visual discomfort. Arch Neurol. 1989;46:1129–1132. doi: 10.1001/archneur.1989.00520460125024. [DOI] [PubMed] [Google Scholar]
- McDermott KC, Juricevic I, Webster MA. Predicting the color environment from uniform color spaces. J Vision. [abstract] in press. [Google Scholar]
- Olshausen BA, Field DJ. Sparse coding of sensory inputs. Curr Opin Neurobiol. 2004;14:481–487. doi: 10.1016/j.conb.2004.07.007. [DOI] [PubMed] [Google Scholar]
- Parraga CA, Troscianko T, Tolhurst DJ. The human visual system is optimised for processing the spatial information in natural visual images. Curr Biol. 2000;10:35–38. doi: 10.1016/s0960-9822(99)00262-6. [DOI] [PubMed] [Google Scholar]
- Parraga CA, Troscianko T, Tolhurst DJ. Spatiochromatic properties of natural images and human vision. Curr Biol. 2002;12:483–487. doi: 10.1016/s0960-9822(02)00718-2. [DOI] [PubMed] [Google Scholar]
- Redies C. A universal model of esthetic perception based on the sensory coding of natural stimuli. Spat Vis. 2007;21:97–117. doi: 10.1163/156856807782753886. [DOI] [PubMed] [Google Scholar]
- Redies C, Hasenstein J, Denzler J. Fractal-like image statistics in visual art: similarity to natural scenes. Spat Vis. 2007;21:137–148. doi: 10.1163/156856807782753921. [DOI] [PubMed] [Google Scholar]
- Regan BC, Reffin JP, Mollon JD. Luminance noise and the rapid determination of discrimination ellipses in colour deficiency. Vision Res. 1994;34:1279–1299. doi: 10.1016/0042-6989(94)90203-8. [DOI] [PubMed] [Google Scholar]
- Ruderman DL, Cronin TW, Chiao CC. Statistics of cone responses to natural images: implications for visual coding. Journal of the Optical Society of America A. 1998;15:2036–2045. [Google Scholar]
- Schloss KB, Palmer SE. AtAn ecological valence theory of human color preferences. Proceedings of the 31st Annual Conference of the Cognitive Science Society. 2009 doi: 10.1073/pnas.0906172107. [DOI] [PMC free article] [PubMed] [Google Scholar]
- Shevell SK, Kingdom FA. Color in complex scenes. Annu Rev Psychol. 2008;59:143–166. doi: 10.1146/annurev.psych.59.103006.093619. [DOI] [PubMed] [Google Scholar]
- Simoncelli EP, Olshausen BA. Natural image statistics and neural representation. Annu Rev Neurosci. 2001;24:1193–1216. doi: 10.1146/annurev.neuro.24.1.1193. [DOI] [PubMed] [Google Scholar]
- Spehar B, Clifford CWG, Newell BR, Taylor RP. Universal aesthetic of fractals. Computers and Graphics UK. 2003;27:813–820. [Google Scholar]
- Srinivasan MV, Laughlin SB, Dubs A. Predictive coding: a fresh view of inhibition in the retina. Proc R Soc Lond B Biol Sci. 1982;216:427–459. doi: 10.1098/rspb.1982.0085. [DOI] [PubMed] [Google Scholar]
- Switkes E, Bradley A, Schor C. Readily visible changes in color contrast are insufficient to stimulate accommodation. Vision Res. 1990;30:1367–1376. doi: 10.1016/0042-6989(90)90010-i. [DOI] [PubMed] [Google Scholar]
- Taylor RP, Micolich AP, Jonas D. Fractal analysis of Pollock's drip paintings. Nature. 1999:399–422. [Google Scholar]
- Wandell BA. Foundations of Vision. Sunderland, MA: Sinauer; 1995. [Google Scholar]
- Webster MA, Georgeson MA, Webster SM. Neural adjustments to image blur. Nat Neurosci. 2002;5:839–840. doi: 10.1038/nn906. [DOI] [PubMed] [Google Scholar]
- Webster MA, Mizokami Y, Svec LA, Elliott SL. Neural adjustments to chromatic blur. Spat Vis. 2006;19:111–132. doi: 10.1163/156856806776923380. [DOI] [PubMed] [Google Scholar]
- Webster MA, Mizokami Y, Webster SM. Seasonal variations in the color statistics of natural images. Network. 2007;18:213–233. doi: 10.1080/09548980701654405. [DOI] [PubMed] [Google Scholar]
- Webster MA, Mollon JD. Adaptation and the color statistics of natural images. Vision Res. 1997;37:3283–3298. doi: 10.1016/s0042-6989(97)00125-9. [DOI] [PubMed] [Google Scholar]
- Webster MA, Werner JS, Field DJ. Adaptation and the phenomenology of perception. In: Clifford C, Rhodes G, editors. Fitting the Mind to the World: Adaptation and Aftereffects in High-Level Vision, Advances in Visual Cognition Series, Volume. volume 2. Oxford: Oxford; 2005. pp. 241–277. [Google Scholar]
- Wilkins A, Nimmo-Smith I, Tait A, McManus C, Della Sala S, Tilley A, Arnold K, Barrie M, Scott S. A neurological basis for visual discomfort. Brain. 1984;107(Pt 4):989–1017. doi: 10.1093/brain/107.4.989. [DOI] [PubMed] [Google Scholar]
- Wilkins AJ. Visual Stress. Oxford: Oxford University Press; 1995. [Google Scholar]
- Wilkins A, Tang P, Irabor J, Baningham L, Coutts L. Cortical haemodynamic response to coloured gratings. Perception 37 ECVP Abstract Supplement. 2008 doi: 10.1016/j.visres.2013.07.003. [DOI] [PubMed] [Google Scholar]
- Wolfe JM, Owens DA. Is accommodation colorblind? Focusing chromatic contours. Perception. 1981;10:53–62. doi: 10.1068/p100053. [DOI] [PubMed] [Google Scholar]
- Wuerger SM, Owens H, Westland S. Blur tolerance for luminance and chromatic stimuli. J Opt Soc Am A Opt Image Sci Vis. 2001;18:1231–1239. doi: 10.1364/josaa.18.001231. [DOI] [PubMed] [Google Scholar]


