

Abstract
Processing of complex acoustic scenes depends critically on the temporal integration of sensory information as sounds evolve naturally over time. It has been previously speculated that this process is guided by both innate mechanisms of temporal processing in the auditory system, as well as top-down mechanisms of attention and possibly other schema-based processes. In an effort to unravel the neural underpinnings of these processes and their role in scene analysis, we combine magnetoencephalography (MEG) with behavioral measures in humans in the context of polyrhythmic tone sequences. While maintaining unchanged sensory input, we manipulate subjects' attention to one of two competing rhythmic streams in the same sequence. The results reveal that the neural representation of the attended rhythm is significantly enhanced in both its steady-state power and spatial phase coherence relative to its unattended state, closely correlating with its perceptual detectability for each listener. Interestingly, the data reveal a differential efficiency of rhythmic rates of the order of few hertz during the streaming process, closely following known neural and behavioral measures of temporal modulation sensitivity in the auditory system. These findings establish a direct link between known temporal modulation tuning in the auditory system (particularly at the level of auditory cortex) and the temporal integration of perceptual features in a complex acoustic scene, while mediated by processes of attention.
Introduction
Perception of a complex acoustic scene is an intricate process that invokes numerous cues that influence whether sound elements are grouped together (i.e., perceived as emanating from a common source) or separated into distinct streams. Numerous studies have attempted to reveal the perceptual cues necessary and/or sufficient for sound segregation (for review, see Bregman, 1990; Carlyon, 2004; McDermott, 2009). These factors include frequency separation between sound elements (van Noorden, 1975; Bregman, 1978), harmonicity (Moore et al., 1986), spectral regularity (Roberts and Bailey, 1996), timbre (Cusack and Roberts, 2000; Roberts et al., 2002), onset/offset asynchrony (Darwin, 1981; Ciocca and Darwin, 1993; Darwin, 1997), temporal coherence (Elhilali et al., 2009b), amplitude modulations (Grimault et al., 2002), and spatial location (Darwin and Hukin, 1999). As evidence accumulates, it is becoming more apparent that any sufficiently salient perceptual difference along any auditory dimension (whether at peripheral or central auditory stages) may lead to stream segregation.
Complementing segregation along multiple perceptual cues are processes of temporal integration that regulate how sound elements are organized together over time. In classic studies of scene analysis using recycled sounds with recurring patterns (Bregman, 1990), it was often assumed that tempi of the order of few hertz (2–12 Hz) play a clock-like role for integrating different cues together (Moore and Gockel, 2002). It is speculated that these rates have direct biophysical underpinnings evidenced by response dynamics of neurons in primary auditory cortex, whose selectivity to temporal rates ranges between 2 and 16 Hz (Kowalski et al., 1996; Miller et al., 2002; Liégeois-Chauvel et al., 2004). This correspondence further supports a role of auditory cortex in the organization of auditory scenes into their underlying perceptual objects (Nelken, 2004). What is primarily unknown, however, is what the exact role of these modulatory rates is in the streaming process itself. Are they all equally important and equally efficient in streaming? The other facet governing the scene analysis process is the role of schema-based cues, reflecting attentional focus of the listener, goals and instructions of the task, expectations, and other top-down mechanisms (Bregman, 1990; Alain, 2007). These processes complement innate mechanisms performing the acoustic analysis of the scene based on its physical attributes. What the neural correlates of attention in the scene analysis process and how it interacts with basic data-driven integration cues are also primarily unknown.
The present study combines magnetoencephalography (MEG) with behavioral measures in humans to address these two aspects of scene analysis. It complements previous work in which we addressed the interaction between task-driven and stimulus-driven attentional processes by tracking the neural representation of a target in presence of a competing background of tones (Elhilali et al., 2009a). The present work extends the previous study by tracking the neural representation of the entire auditory scene, including both its foreground and background components. We use a simple variation of the classic two-tone paradigm (van Noorden, 1975; Bregman, 1990), by combining two recurring tone sequences, each repeating at a different rhythm. Polyrhythmic sequences are very popular in various genres of music by interweaving simple rhythms and often used in studies of rhythm perception, temporal processing, and grouping in auditory perception (Beauvillain and Fraisse, 1984; Handel, 1984; Moelants and Van Noorden, 2005).
Initially, we monitor the perception as well as neural representation of the two competing streams using MEG. In the second part, we examine the role of different rhythms in mediating the streaming process in a series of psychoacoustic experiments.
Methods and Methods
Participants
A total of 17 subjects participated in the psychoacoustic experiments (12 males; mean age, 25.2 years). Two subjects were excluded from additional analysis because of an inability to perform the task (i.e., negative d′ values on one or both tasks). Two experiments (4 vs 7 Hz and 7 vs 10.1 Hz) were performed by eight listeners, and one experiment was performed by five listeners (3 vs 6.5 Hz) (excluding the two disqualified subjects), with six listeners taking part in multiple studies. Subjects were paid for their participation. All psychoacoustic experiments were approved by the Johns Hopkins University Institutional Review Board, and written informed consent was obtained from each participant.
For the MEG experiment, twenty-eight subjects (13 males; mean age, 26 years) participated in the MEG study. Two subjects were excluded from additional analysis because of an inability to perform the tasks (i.e., negative d′ values on one or both tasks). All subjects were right handed (Oldfield, 1971), had normal hearing, and had no history of neurological disorder. Subjects were paid for their participation. MEG experiments were approved by the University of Maryland Institutional Review Board, and written informed consent was obtained from each participant.
Stimulus design
The stimuli were generated using MATLAB (MathWorks). Their duration was randomly chosen from 5.25, 6.25, or 7.25 s uniformly to prevent the formation of an expectation of the end of the stimulus by subjects. The sampling frequency was 8 kHz. Each stimulus contained two pure tones, each repeating at a different rate (Fig. 1). Tones were 75 ms in duration with a 10 ms onset and offset raised cosine ramps. The spectral distance between the two repeating notes was fixed at a chosen ΔF = ±8 semitones, whereas the specific frequencies of each stream were randomly chosen in the range 250–500 Hz in two semitone intervals. For purposes of data analysis (discussed below), each stimulus was characterized as a low- or high-frequency target tone sequence depending on the relation of the target tone to the middle frequency 353 Hz (those with target tone frequency 353 Hz were randomly assigned as low or high in such a way to equipartition the high and low categories). The intensity of each stream was adjusted twice to have approximately equal audibility: first based on the standard equal-loudness curve (ISO-226, 2003) and then fine-tuned by five subjects. The repetition rate for each tone was fixed for each study. In the psychoacoustic experiments, three conditions were tested: 4 versus 7 Hz, 7 versus 10.1 Hz, and 3 versus 6.5 Hz. In the MEG experiment, only the 4 versus 7 Hz condition was tested.
Figure 1.

Stimulus design. The stimulus consists of two pure tone sequences, one at a low rhythm and one at a fast rhythm. The spectral distance between the two streams is fixed as ±8 semitones. In each task, listeners are instructed to track either the slow or fast stream while ignoring the other one and detect a temporal jitter in the target stream. H, High; L, low.
Subjects were instructed to attend to one rhythm (either slow or fast rate) and detect the presence of a temporal deviant (an irregularity) in the rhythm. The deviant was created by temporally displacing a target tone by a certain amount relative to the regular target intervals. The amount of shift was fixed at ±95, ±70, ±45, ±40, and ±24 ms for the 3, 4, 6.5, 7, and 10.1 Hz rates, respectively. Values of deviants were chosen to be almost linear on a logarithmic rate frequency axis. Each temporal deviant was perfectly detectable (100% hit rate) when each rhythm was presented by itself (without the distracting other rhythm). The temporal location of all deviants was approximately uniformly distributed along the entire stimulus duration.
Twelve exemplar stimuli were generated for each of the three condition types: (1) null condition (no deviants), (2) slow target condition (one deviant per slow rate), and (3) fast target condition (one deviant per fast rate). A maximum of one deviant per stream was used to disambiguate subjects' true detections in the attended stream from incorrect false positives to deviants in the other stream.
Experimental procedure
In the psychoacoustic experiment, subjects were seated at a computer in a soundproof room. The signals were created offline and presented diotically through Sony MDR-V700 headphones. Subjects controlled the computer using a graphical user interface (GUI) using the mouse. The task was described to subjects as well as the basic use of the GUI. Subjects were allowed to adjust the volume to a comfortable level before proceeding with the experiment.
Participants were presented with 72 stimuli (3 conditions × 12 exemplars × 2 blocks) per task. The progression from one trial to the next was initiated by the subject with a button press. Each task consisted of two identical blocks to allow subjects to rest during task performance. A training block of 20 trials was presented before each task. Subjects were permitted to listen to each stimulus as many times as desired; then they were prompted to indicate whether a deviant was present. The correct answer was displayed afterward. Subjects pressed a button to initiate the presentation of the next stimulus.
Each subject performed both the slow and fast tasks, with task order counterbalanced across subjects. Each task required the subject to listen to the entire set of 72 stimuli described above. Each stimulus was presented only once, and no feedback was given after each trial. The entire session of both tasks lasted ∼1 h.
In the MEG study, subjects were placed horizontally in a dimly lit magnetically shielded room (Yokogawa Electric Corporation). Stimuli were presented using Presentation software (Neurobehavioral Systems). The signals were delivered to the subjects' ears with 50 Ω sound tubing (E-A-RTONE 3A; Etymotic Research), attached to E-A-RLINK foam plugs inserted into the ear canal, and presented at a comfortable loudness of ∼70 dB sound pressure level.
Before the main experiment, a preexperiment was run, in which a 1 kHz, 50 ms tone pip was presented ∼200 times. The interstimulus interval (ISI) was randomized between 750 and 1550 ms, and subjects were instructed to count the tone pips. The aim of this task was to record the M100 response (a prominent peak ∼100 ms after pip onset, also called N1m) used for differential source localization.
In the main experiment, subjects were presented with 36 stimuli (3 conditions × 12 exemplars) per block. The ISIs were randomly chosen to be 2800, 3000, or 3200 ms. Two blocks per task were presented, and between-blocks subjects were allowed to rest but were required to stay still. The identical stimulus ensembles (including identical ISIs) were presented for the two tasks. Depending on the task being performed, subjects were instructed to listen for the occurrence of temporal jitter in the slow rhythm (4 Hz, slow task) or the fast rhythm (7 Hz, fast task). Each subject performed both the slow task and the fast task, with task order counterbalanced across subjects. Subjects were instructed to press a button held in the right hand as soon as they heard the appropriate deviant. In the following text, a “target stream” refers to the stream that is attended for that task, whereas a “masker stream” refers to the other stream. Thus, a target stream (such as the 4 Hz stream) in one task (slow task) is a masker stream in the other task (fast task). “Target rate” denotes the modulation rate of the target stream.
A training block with 20 stimuli was presented before each task, in which each training stimulus was presented twice. Subjects verbally indicated the existence of the deviants, and feedback was given by the investigator. The entire session of both tasks lasted ∼1 h.
MEG recordings were conducted using a 160-channel whole-head system (Kanazawa Institute of Technology, Kanazawa, Japan). Its detection coils are arranged in a uniform array on a helmet-shaped surface of the bottom of the Dewar, with ∼25 mm between the centers of two adjacent 15.5-mm-diameter coils. Sensors are configured as first-order axial gradiometers with a baseline of 50 mm; their field sensitivities are 5 fT/√Hz or better in the white noise region. Three of the 160 channels are magnetometers separated from the others and used as reference channels in noise-filtering methods. The magnetic signals were bandpassed between 1 and 200 Hz, notch filtered at 60 Hz, and sampled at the rate of fs = 1000 Hz. All neural channels were denoised twice with a block least mean square adaptive filter: first using the three external reference channels (Ahmar and Simon, 2005), and second using the two channels with the strongest cardiac artifacts (Ahmar et al., 2005).
Data analysis
Behavioral performance analysis.
The ability of subjects to perform the requested task was assessed by calculating a d′ measure of performance (Kay, 1993). For each task, we estimated the correct detection and false-alarm probabilities for detecting the temporal deviants in the attended stream, converted them to normal deviates (z-scores), and computed the d′ value.
To investigate the interaction between the attended and unattended rhythms, we computed false-alarm probabilities induced by presence of a deviant in the attended stream versus false alarms arising from the null conditions (in which no deviant was present in either streams). To determine the effect of the tonal frequency of the target on the neural responses, a d′ measure was derived for each of the low or high target trials from both target and masker tasks.
To investigate the buildup of the target stream during the corresponding task, we divided the deviant trials according to the temporal locations of the deviant in six temporal windows, starting 1.25 s after stimulus onset, to the end of the stimulus, with 1 s intervals. A probability of hit was then measured for each temporal window. Because of the temporal uncertainty in the false-alarm trials, we calculated an average false-alarm rate (regardless of when the false response was issued) and combined it with the time-specific hit rate to derive a d′ measure for each temporal window.
Neural data analysis.
After recordings were completed and noise-reduction algorithms applied, the analysis epochs of each task from 1.25 s after stimulus onset to the end of the stimulus were extracted and concatenated, forming a single response with duration T = 360 s (5 s × 36 exemplars × 2 blocks), because of the balanced stimulus lengths across trials. The discrete Fourier transform was applied on the single response, giving a single Fourier response of from 0 to 500 Hz with frequency resolution (Δf) Hz.
The evoked neural responses to the two streams were characterized by the magnitude and phase of the frequency component at modulation rates (4 and 7 Hz) and were used for localization and for phasor maps. The bulk of the analysis was based on the normalized neural responses, defined to be the squared magnitude of the frequency component at target rate divided by the average squared magnitude of the frequency components ranging from 1 Hz below to 1 Hz above the target rate (excluding the component at target rate), averaged over the 20 channels with the strongest normalized neural responses. Using 10, 20, or 50 channels yielded similar findings; however, only the 20 channel analysis is reported here.
The spatial pattern of the neural responses was represented by a phasor map, a graph of the complex (magnitude and phase) magnetic field on all channels. For each channel, the length of the vector arrow is proportional to the magnitude of frequency component at target rates and the direction of the arrow represents the phase according to standard polar coordinates. Red and green contours represent the magnetic field strength projected onto the line of constant phase that maximizes the variance of the projected field (Simon and Wang, 2005). The phasors are visually faded using the signal-to-noise ratio (SNR) of each channel as linear fading coefficients.
The normalized neural responses difference between the slow and fast task was averaged across 26 subjects to characterize attention gain effect. Furthermore, to evaluate the effect of attention at across frequencies, the same analysis is done at adjacent single-trial frequency bins around the target rates (4 ± 0.25 and 7 ± 0.25 Hz), which was chosen to be consistent with the frequency resolution in the following phase coherence analysis.
Phase coherence analysis is used to study the effect of attention on the synchronization between two distinct neural populations. Phase coherence between channels m and n, γmn2 is obtained from Q trials (Srinivasan et al., 1999). Here Q = 72 = 3 conditions × 12 exemplars × 2 blocks,
where, Xmn(f) is average cross spectrum between channel m and channel n, and Xmm(f) is average power spectrum of the individual channel,
where Fmq(f) is the Fourier transform of the qth trial of channel m at frequency f. Each trial is extracted from 1.25 to 5.25 s after stimulus onset, giving a frequency resolution 0.25 Hz. A coherence value of 1 indicates that the two channels maintain the same phase difference on every trial, whereas a coherence value near 0 indicates a random phase difference across trials. The coherence difference between slow and fast task was computed for every channel pair. The SEM εmn was constructed to identify robust coherence change (Srinivasan et al., 1999),
where the coherence change was classified as robust if its magnitude was greater than εmn.
To analyze the modulation of phase coherence in the auditory cortex, only each subject's 20 channels with the strongest normalized neural response at target rates are included in additional analysis. In addition, to exclude artificial coherence resulting from volume conduction effects on the extracranial magnetic field and to measure only phase correlation between distinct populations of neurons, only long-distance channel pairs (channel separation >100 mm) were included (Srinivasan et al., 1999). The difference between number of channel pairs with robust increased coherence and channel pairs with decreased coherence is normalized over the total number of long-range channel pairs. Finally, to evaluate synchronizations at other frequencies, the coherence change measurement is obtained at adjacent frequency bins (4 ± 0.25 and 7 ± 0.25 Hz).
To investigate the possibility of hemispheric bias, the 20 channels with the strongest normalized neural response at target rates are chosen from the left and right hemispheres, respectively, to represent the overall neural activity of each hemisphere. Neural responses averaged across the 20 channels are subtracted across hemispheres for each task and for each subject. Using 10, 20, up to 60 channels yielded similar findings; however, only the 20 channel analysis is reported here.
To investigate the buildup of the representation of target stream, the responses at target rate were divided temporally: the analysis epochs were divided into four temporal segments with 1000 ms duration each, and corresponding segments were concatenated across epochs. The segment duration 1000 ms was used to be commensurate with both 4 and 7 Hz. The first segment began at 1250 ms after stimulus.
Behavioral versus neural correlation and bootstrap analysis.
We correlated the change in behavioral performance for the 4 and 7 Hz tasks with the neural responses, by contrasting the per-listener psychometric and neurometric measures. First, we scaled the neural data (i.e., the normalized responses to target at 4 and 7 Hz for each task) by a factor of 3 to match the absolute ranges of both neural and behavioral values. We then derived the angle (i.e., inverse tangent) of the slope relating the change in neural power at 4 and 7 Hz during each task with the behavioral performance (d′ value) for each subject and each task. The across-subject slopes were then combined using circular statistics to yield an angular mean for each task (Fisher, 1993).
We performed a bootstrap procedure to confirm the positive correlation between the neurometric and psychometric functions of target performance versus change in neural power. We followed a balanced bootstrap sampling procedure (Efron and Tibshirani, 1993) by randomly selecting 26 subjects with replacement and computing their angular sample mean and repeating this process 10,000 times. The procedure was controlled to ensure that all subjects appear the same number of times over all 10,000 bootstrap samplings. Confidence measures were then derived from the bootstrap statistics.
We used the same analysis to correlate the psychometric and neurometric curves for the deviant detection buildup. To match the range of values from the neural and behavioral data, we scaled the neural data (i.e., the normalized responses to target rate) by a factor of 2.5 (note that the different scaling is attributable to the reduced values of the normalized neural response caused by the smaller window for the buildup analysis). The behavioral curves for each subject were then grouped to match the sampling rate of the neural data. Subsequently, these two curves were fitted by a first-order polynomial to derive the slope relating the two functions. The across-subject slopes were then combined using circular statistics following the same procedure described above. A balanced bootstrap procedure was performed again to confirm the positive correlation between the neurometric and psychometric functions of temporal buildup.
Neural source localization.
Source localization for the M100 response was obtained by calculating the current-equivalent dipole best fitting the magnetic field configuration at the M100 peak, in each hemisphere. Source localization for the neural response to target stream was obtained by calculating the complex current-equivalent dipole best fitting the complex magnetic field configuration at target rates, in each hemisphere (Simon and Wang, 2005). Only channels with SNR > 4 were used in the fitting. Significance of the relative displacement between the M100 and auditory steady-state response (aSSR) dipole sources were determined by a two-tailed paired t test in each of three dimensions: lateral/medial, anterior/posterior, and superior/inferior.
Results
We use a simple variation of the classic two-tone paradigm (van Noorden, 1975), by combining two recurring tone sequences, each repeating at a different rhythm (Fig. 1). In a series of experiments, we examine the dependence of streaming on rhythmic parameters, as well as the neural representation of streams in both foreground and background as defined by where they fall under the attentional spotlight. In all experiments, subjects are given two separate tasks with identical stimulus ensembles. In each task, subjects are instructed to detect a temporal jitter deviant in the stream with either the slow or fast repetition rate. The stimulus ensemble for each task consists of three conditions (Fig. 1): a null condition with no deviant present, a fast condition with a deviant in the fast rhythm, and a slow condition with a deviant in the slow rate stream. All deviant detection tasks in the absence of the competing stream were very easy, achieving 100% detection. The frequency separation between the two tone sequences is maintained at eight semitones, which has been shown previously to facilitate percepts of segregated streams (van Noorden, 1977; Micheyl et al., 2007).
The behavioral perception of this polyrhythmic auditory scene reveals a streaming advantage of 4 Hz rhythms relative to 7 Hz. The effect of stream tempi on the performance of both slow and fast tasks is illustrated in Figure 2a. The plot reveals that detection of a temporal deviant in a 4 Hz slow task is significantly easier (mean d′ = 2.9) than a 7 Hz fast task (mean d′ = 1.5) (statistically significant difference; unpaired t test, p = 0.002, t = 3.77). To explore the difference between the neural representations of both streams as listeners switched between the slow and fast tasks, we recorded magnetic fields (MEG) induced by neural responses in 26 subjects performing the same deviant detection tasks. The behavioral performance was unchanged whether tested under purely psychoacoustic or neural recording settings as illustrated in Figure 2a (no significant difference; unpaired t test; slow task: p = 0.98, t = −0.14; fast task: p = 0.71, t = −0.37).
Figure 2.
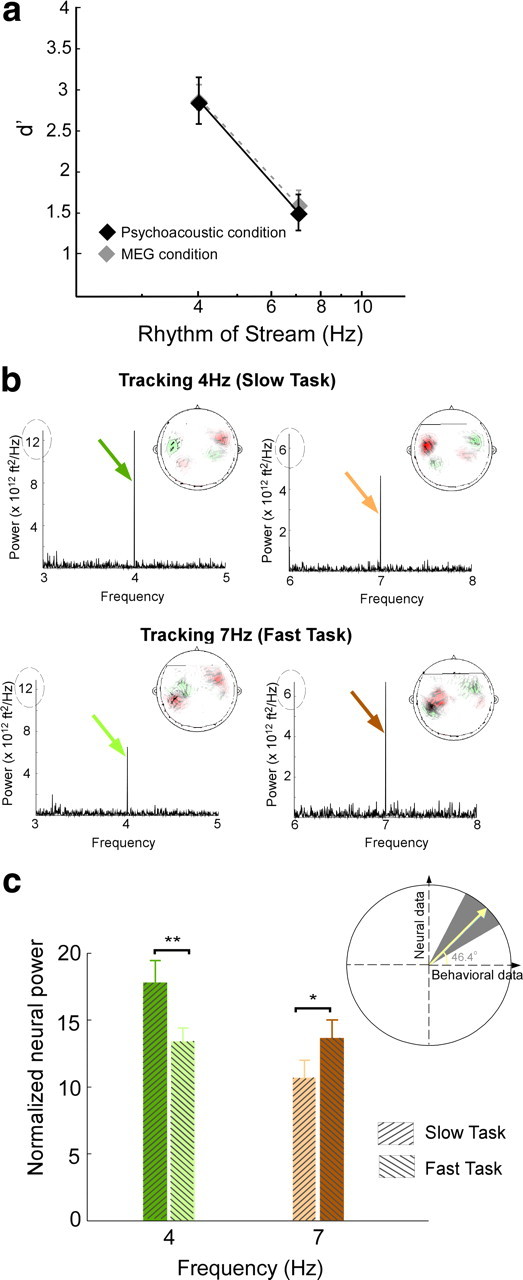
Behavioral and neural responses. a, Behavioral performance results for 4 and 7 Hz tasks, measured by d′. The black color depicts performance measures obtained in the psychoacoustic study, and the gray depicts measures obtained in the MEG study for the same stimulus paradigm. Error bars represent SE. b, Power spectral density for the aSSR for a single subject while tracking the 4 Hz stream (top row) and 7 Hz (bottom row), averaged over 20 channels. Insets, The MEG magnetic field distributions of the 4 and 7 Hz rhythm response components. Red and green contours represent the target magnetic field strength projected onto a line with constant phase. c, Change in mean neural response at 4 and 7 Hz during both tasks, averaged across 26 listeners. Each bar represents the normalized neural power at a specific frequency (4 or 7 Hz) during the slow task (attend to 4 Hz) or fast task (attend to 7 Hz). The bars are color coded to match the colored arrows in b. Error bars represent SE. Inset, Correlation between change in neural response and behavioral performance of individual subjects. The slope, converted to an angle, of the normalized neural signal versus behavioral performance per subject yields a mean slope of 46.1°. Bootstrap estimates show 95% confidence intervals (gray background) and confirm the positive correlations between neural and behavioral measures. *p = 0.05, **p = 0.01.
Depending on listeners' attentional focus, the neural representations of the two-tone sequence mirrors the percept of a scene with two distinct streams. During the performance of the slow task, the rhythm of the slow stream emerges as a strong 4 Hz component in the neural signal of an individual subject (Fig. 2b, top row). In contrast, during the performance of the fast task, the cortical response entrained at 4 Hz is relatively suppressed (Fig. 2b, bottom row). This modulatory effect is reversed for the cortical representations of the fast stream: the neural response at 7 Hz is stronger in the fast task than the slow task (Fig. 2b). This differential activation confirms our previous findings that task-dependent attention modulates, in a sustained manner, the neural representation of a specific acoustic feature, much like visual attention (Elhilali et al., 2009a).
The MEG magnetic field distributions of the target rate response component, examples of which are shown at the inset of graphs in Figure 2b, reveal the stereotypical pattern for neural activity originating separately in the left and right auditory cortex. The neural sources of all target rhythm response components with sufficiently high signal-to-noise ratio originate in auditory cortex (Simon and Wang, 2005). The mean displacement of the neural source from the source of the auditory M100 response (Näätänen and Picton, 1987) was calculated for each hemisphere and each target rate. No significant difference of displacement was found across hemispheres or target rates. Thus, these displacements can be combined, yielding a significant displacement (p = 0.016) of 19 ± 6 mm in the anterior direction. Assuming a M100 origin of planum temporale, this is consistent with an origin for the neural response to the target rhythm in Heschl's gyrus, the site of core auditory cortex, a region known for its good phase-locking to relatively slow rates (<20 Hz) (Miller et al., 2002; Liégeois-Chauvel et al., 2004).
The perceptual detectability of an attended rhythm is highly correlated with its neural signal representation. The mean neural response change at target rates across tasks is averaged across a population of 26 subjects (Fig. 2c). The effect confirms a significant positive change at 4 Hz aSSR (t test; t = 2.7, p = 0.01) and a significant negative change at 7 Hz aSSR (t test; t = −1.44, p = 0.05), reflecting an enhanced phase-locked, sustained activity when subjects' attention is directed toward the target stream. To explore the relationship between the behavioral performance of individual listeners and the changes of neural power at 4 and 7 Hz for both tasks, we quantified the slope (converted into an angle) relating the normalized neural signal with the listeners' d′ performance on a per-subject basis. The average slope angle for the target task is 46.1°, i.e., a positive slope, demonstrating the positive correlation between the neural and behavioral measures. Bootstrap analysis confirms the significance of this result. Figure 2c (inset) illustrates both the bootstrap mean of 46.6° (yellow line) and the 5th and 95th percentile confidence limits (gray background), all with positive slopes.
An interesting observation arising from our neural data is the uneven neural power of the slower sequence at 4 Hz relative to 7 Hz (Fig. 2). Such result would not have been surprising if the analysis was based on absolute power, which generally exhibits a low-pass (e.g., 1/f) pattern. Instead, our method is based on a normalized power measure that scales the absolute neural power at the target (4 or 7 Hz) by the power in a range of ±1 Hz around that frequency (excluding the component at target rate), hence correcting for the incline in the power spectrum.
The enhancement of the neural power occurs exclusively at the target rhythm being attended. The change in neural power between attend and non-attend conditions is highly significant at both 4 and 7 Hz (bootstrap across subjects; 4 Hz power, p < 10−3; 7 Hz power, p < 0.002), as shown in Figure 3(left). In contrast, there is no significant change in normalized neural response at adjacent frequencies (4 ± 0.25 and 7 ± 0.25 Hz), confirming that this feature-based selective attention precisely modulates the cortical representation of the specific feature rather than overall neural activities.
Figure 3.

Power and phase enhancement during the attended task. Left, Normalized neural response difference between slow and fast tasks shows enhancement exclusively at target rates (4 Hz for the slow task, 7 Hz for the fast task). Error bars represent SE. The asterisks at 4 and 7 Hz shows that only these frequencies yield a statistically significant enhancement. Middle, Phase coherence difference between the slow and fast tasks showing enhancement exclusively at target rates. Error bars represent SE. The difference between number of channel pairs with robust increased coherence and channel pairs with decreased coherence is normalized over the total number of long-range channel pairs. Right, Channel pairs with robust coherence difference at target rates for single subject, overlaid on the contour map of normalized neural response at target rates. The channel pairs with increased (decreased, respectively) coherence at target rates is shown by red (blue, respectively) lines.
The power enhancement at target rates is accompanied with an enhancement in long-distance coherence across neural sites. Phase coherence between distant MEG channels is used to characterize synchronization of underlying neural activities. It is speculated that feature-based attention enhances long-range synchronization, specifically at the target rates (Srinivasan et al., 1999; Niebur et al., 2002). The difference between the number of long-range channel pairs with robust increased coherence in the attended task, and channel pairs with decreased coherence, is normalized over the total number of long-range channel pairs (Fig. 3, middle). Approximately 15% more channel pairs show an enhanced synchronization at target rates (bootstrap across subjects, p < 0.008 at 4 Hz and p < 0.003 at 7 Hz). In contrast, there is no significant change in phase coherence at adjacent frequencies (4 ± 0.25 and 7 ± 0.25 Hz). As an example, the phase coherence of neural responses in one subject is presented in Figure 3 (right), where the channel pairs with robust coherence difference at target rates are shown by red lines (denoting increased coherence) and blue lines (denoting decreased coherence), plotted on the contour map of normalized neural response at target rates. The coherence change is distributed both within and across hemispheres.
Neural responses to target rhythms reveal a strong task-dependent hemispheric asymmetry. During the attended task, the right hemisphere shows a greater normalized neural response at target rates than the left hemisphere (bootstrap across subjects, p < 0.038 at 4 Hz and p < 0.001 at 7 Hz); during the ignored task, the right hemisphere dominance is observed at 7 Hz (bootstrap across subjects, p < 0.025) but not at 4 Hz (bootstrap across subjects, p < 0.07) (Fig. 4).
Figure 4.

Neural responses to target rates across hemispheres. The 20 channels with the strongest normalized neural response at target rates are chosen from left and right hemisphere, respectively, to represent the overall neural activity of each hemisphere. Neural responses averaged across the 20 channels are subtracted across hemispheres for each task and for all subjects. Error bars represent SE. **p < 0.04.
The representation of the 4 Hz rhythm changes over time, closely following its perceptual detectability, but decoupled from the constant acoustics over time. The correlation between the perceptual detectability buildup of the 4 Hz target stream and its neural representation buildup is shown in Figure 5. Although the acoustics of the 4 Hz rhythm are not changing over time, the neural response at 4 Hz along with its perceptual detectability are enhanced over time since the onset of the sequence, invoking a role of mechanisms of auditory streaming and object formation. The correlation between the psychometric and neurometric curves over time is confirmed by a bootstrap analysis on a per-subject basis. The slope correlating the d′ and neural response curves for each subject yield a mean positive slope angle of 22°; statistical significance is confirmed by a bootstrap analysis with a mean of 22° and the 5th to 95th confidence intervals falling within the upper right quadrant (Fig. 5, bottom inset). The MEG magnetic field distributions of the 4 Hz target response in Figure 5 (top insets) illustrate the changing strength and changing pattern of the neural activity over time in an individual subject.
Figure 5.

Buildup over time of behavioral and neural responses of target streams. Normalized neural response to the 4 Hz stream, and behavioral performance, as a function of time during the slow task averaged across subjects. Error bars represent SE. Top insets, The MEG magnetic field distributions of the 4 Hz target response for a single subject at representative moments in time. Bottom inset, Correlation of behavioral and neural responses as a function of time. The ratio of the neural to behavioral response trends as a function of time, interpreted as a slope angle, is averaged across subjects, yielding a mean slope angle of 22° (yellow line). Bootstrap estimates and the 95% confidence intervals (gray background) confirm the positive correlation between the psychometric and neurometric buildup curves.
The neural buildup of the 7 Hz is approximately constant over time (data not shown) and does not reveal any significant correlation with the behavioral detectability of the 7 Hz stream over time. The perceptual buildup results are discussed further below in Results and Discussion.
Segregating a polyrhythmic auditory scene is governed by mechanisms commensurate with modulation tuning properties of the auditory system. To shed more light on the perceptual difference between the slow 4 Hz and fast 7 Hz rhythms in a two-tone sequence, we varied the rhythm values and tested the following additional rate pairs: 7 versus 10.1 Hz and 3 versus 6.5 Hz. Subjects were asked to perform a temporal shift detection task attending to the slow or the fast streams consecutively. The behavioral performance is shown in Figure 6a.
Figure 6.

Behavioral performance at different target rates. a, Behavioral performance results (d′) in a two-stream stimulus, as a function of target rate. Each pair of points with a similar color code indicates one psychoacoustic condition testing two specific rhythms. Error bars represent SE. b, Analysis of behavioral performance differentiating target, nontarget, and null (no deviant) trials for each of the three psychoacoustic conditions. The color code is similar to the one used in a. c, Normalized neural responses to the target rhythm (slow or fast) as a function of time during three psychoacoustic conditions and one MEG condition. Error bars represent SE. *p < 0.06, **p < 0.03.
In both experiments, the slower rate yielded a better performance. In the 7 versus 10.1 Hz sequence, the 7 Hz task is clearly more detectable, with a mean d′ of 1.7, relative to 0.9 for the 10.1 Hz task. The difference in performance is statistically significant (unpaired t test; p = 0.03, t = 2.43). Similarly, the 3 Hz task is more detectable than 6.5 Hz, with mean d′ of 3.33 relative to 2.03 for the 6.5 Hz task. The performance between the two tasks is significantly different (unpaired t test; p = 4.94, t = 0.001). In all experiments, there was no effect of task order on performance.
The detectability of the 7 Hz rate is comparable whether in the presence of a competing 4 Hz or competing 10.1 Hz rhythm. There is no statistically significant difference between the 7 Hz d′ values in both contexts (unpaired t test; p = 0.6, t = 0.53). Overlaying the behavioral results from experiments of all rate pairs yields a low-pass-like shape (Fig. 6a) akin to the known modulation transfer function (MTF) profiles for repetitive rates in primary auditory cortex (Eggermont, 1991; Kilgard and Merzenich, 1999) and modulation tuning in the auditory system (van Zanten and Senten, 1983; Chi et al., 1999). This observation shall be discussed further in Discussion.
The presence of a competing rhythm contributes to the difficulty of detectability of an attended stream, possibly by interfering with subjects' attentional focus. We analyze behavioral performance of subjects on a trial-by-trial basis, dissociating hit trials (from the target condition), false alarms from trials of the nontarget condition, and false alarms from trials of the null condition (Fig. 1). If the presence of a competing stream, with its own deviants, is irrelevant to the performance of the attended stream, then the false-alarm rate will be comparable in the null or opposite task stimuli. If not, we will see a clear interaction between deviants in the unattended rhythm and subjects' perception of the deviant in the target. Figure 6b shows that, for all rhythm pairs, there is a clear interaction between the attended and unattended streams, with a consistently higher false-alarm rate in the competing stream than null condition. Table 1 quantifies the statistical correspondences between the hits and false alarms of the different tasks and different rhythms.
Table 1.
Analysis of effect of a competing stream on the detectability of the attended stream
| 3 versus 6.5 Hz | 4 versus 7 Hz | 7 versus 10.1 Hz | |
|---|---|---|---|
| Hit rate | Different | Different | Marginally different |
| Target condition | p = 0.004 | p = 0.0001 | p = 0.06 |
| Slow versus fast task | t = 3.93 | t = 5.22 | t = 2.03 |
| False alarm | Not different | Not different | Marginally different |
| Opposite condition | p = 0.11 | p = 0.26 | p = 0.06 |
| Slow versus fast task | t = −1.76 | t = −1.17 | t = −2.05 |
| False alarm | Not different | Not different | Not different |
| Null condition | p = 0.14 | p = 0.65 | p = 0.58 |
| Slow versus fast task | t = −1.6 | t = −0.46 | t = 0.56 |
| False alarm | Different | Different | Different |
| Opposite task versus null | p = 0.013 | p = 0.01 | p = 0.04 |
| Slow task | t = 3.14 | t = 2.69 | t = 2.2 |
| False alarm | Different | Different | Different |
| Opposite task versus null | p = 0.03 | p = 0.005 | p = 0.0003 |
| Fast task | t = 2.5 | t = 3.3 | t = 4.7 |
Because 7 Hz both appeared as slow and fast rates in two experiments, we can compare their performance (hit rate and false-alarm rate) in both contexts. In both experiments, the 7 Hz hit rate was not significantly different (t test; p = 0.7, t = 0.4), nor was the false alarm from the opposite task (t test; p = 0.44, t = −0.78) or false alarm from null condition (t test; p = 0.8, t = 0.25).
The buildup of different streams in a polyrhythmic sequence reveals a complex interaction between the modulation rates of the foreground and background. We investigate the change in detectability of the deviant in each stream as a function of time. All temporal rates tested show either an increase or no change in detectability in the interval between 1 and 3 s (Fig. 6c). As the sequence evolves, there develops an interaction between the rhythm of the attended stream, the rhythm of the distracting stream, and the time of deviant. Most rates drop in detectability toward the end of the sequence, whereas only deviants of 4 and 10.1 Hz steadily grow as a function of time (up to 6 s).
The detectability of the 4 and 7 Hz rhythms from the pure psychoacoustic and MEG conditions are compared in Figure 6c (middle). The two recording conditions show comparable results, in which the number of subjects in the MEG experiment (26 listeners) allow a more refined time analysis (finer time resolution), revealing more of the shape of the buildup curve over time.
Discussion
The present study explores the mechanisms of attention and temporal integration that mediate the representation of foreground and background in auditory scenes. It builds on extensive previous work exploring the perceptual cues mediating parsing of complex acoustic environments (van Noorden, 1975; Micheyl et al., 2005). Unlike classic paradigms of streaming, the stimuli in this study consisted of different tempi competing against each other to form distinct coherent streams. The design allows us to explore the interaction between different temporal rates, as well as examine the role of attention in the formation of auditory objects. The purpose of using polyrhythmic stimuli in this study is not to investigate rhythm parsing or perceptual manifestations of rhythmicity (Deutsch, 1983; Handel, 1984; Klapp et al., 1985) but rather the role of modulation timing and its interaction with attention in the context of auditory streaming. The choice of separating the two rhythmic sequences by eight semitones eases their segregation into two streams (van Noorden, 1977) and keeps the focus of the study on the role of temporal modulation rates in facilitating auditory streaming.
The results reveal that the neural representation of the attended target is significantly enhanced in both its steady-state power and between-neuronal-sites phase coherence relative to its unattended state. This enhancement follows closely the perceptual detectability of the rhythm for individual subjects, with bigger neural power enhancement correlating with improved behavioral performance. The tight relationship between the neurometric and psychometric functions on a per-subject basis provides strong support for the previously proposed hypothesis that attention mediates a differential enhancement of features under the spotlight of attention and/or suppression of background features that was observed in both auditory and visual modalities (Corbetta et al., 1990; Somers et al., 1999; Bidet-Caulet et al., 2007; Schoenfeld et al., 2007; Elhilali et al., 2009a; Paltoglou et al., 2009). Such modulatory effects of feature-based attention have been ascribed to mechanisms of adaptive gain control and task-induced plasticity operating at the single neuron and neuronal population level in sensory cortex (Treue and Martínez Trujillo, 1999; Fritz et al., 2003). The fact that this feature enhancement is observed exclusively at the frequency of the attended target with ¼ Hz accuracy argues that top-down processes of attention interact closely with the physical parameters of the stimulus and mediate a very specific feature-based modulation that cannot be explained by general enhancement of a spectral region or band of intrinsic rhythm. Moreover, the neural power enhancement observed in our results is accompanied by an increase in phase coherence between distant MEG sensors. This finding reported previously in the visual modality (Gaetz et al., 1998; Srinivasan et al., 1999) argues for a role of synchronization between remote neuronal populations as a general neural coding strategy for enhancing representation of stimulus features under the spotlight of attention. Temporal codes may therefore be complementing or providing an alternative to rate-based representations of objects in complex sensory scenes (Grothe and Klump, 2000).
The source of the observed power enhancement is localized to the auditory cortex, hence evoking a role of the putative “what” pathway (Poremba et al., 2003; Ahveninen et al., 2006; Lomber and Malhotra, 2008), which is expected from this task evoking feature-based rather than spatial attention. Although the power enhancement can be localized to sensory cortex, the results reveal a clear right-hemispheric bias. This bias is consistent with the association of the right hemisphere with suppressing irrelevant information (Alcaini et al., 1995) and its involvement in selective attention and attentional control (Paltoglou et al., 2009; Hill and Miller, 2010).
The behavioral saliency of the 4 Hz rhythm relative to 7 Hz, which parallels the effects of task-driven attention, appears to closely follow known phase-locked neural coding properties observed in mammalian primary auditory cortex (Phillips et al., 1989; Kilgard and Merzenich, 1999) and perceptual measures of modulation sensitivity in the auditory system (Chi et al., 1999) over a range of behaviorally important modulations (<16 Hz). To verify this observation, we examined results of additional psychophysical experiments varying the choice of rhythms in the stimulus over the range 3–11 Hz. The results confirm that the low-pass-like shape of the behavioral performance revealed in Figure 6 is reminiscent of known temporal MTFs typically arising from phase-locking or entrainment of auditory cortical neurons with regular clicks or repetitive tones (Eggermont, 1991; Kilgard and Merzenich, 1999), as well as perceptual modulation sensitivity reported in humans using dynamic ripple sounds (Chi et al., 1999). Unlike previously speculated roles of temporal rates in scene analysis in which faster rates induce enhanced streaming effects (Bregman, 1990), our experimental paradigm puts temporal rates in competition against each other. In doing so, we are testing the system at different operating points, hence revealing more of the role of underlying modulation tuning in the auditory system in assisting in the analysis of complex acoustic scenes. The view emerging from these results is that the modulation sensitivity in the auditory system mediates the selectivity of different temporal rates, sometimes limiting the effect of selective attention in the case of faster temporal rhythms. This finding is supported by both our neural analysis revealing an enhanced normalized power response to 4 Hz relative to 7 Hz, as well as our behavioral data revealing an enhanced detectability of slower rates. A complementary account to the association between integration of streams and modulation sensitivity in the auditory system could be interpreted in the context of arrays of filters covering the range of modulations of few to tens of hertz, known to be prominently present in natural sounds, including speech sounds (Drullman et al., 1994; Arai et al., 1999; Greenberg, 2004; Greenberg and Arai, 2004) and animal vocalizations (Kaltwasser, 1990; Nagarajan et al., 2002; Liu et al., 2003; Schnupp et al., 2006; Kim and Bao, 2009). Distributed maps recorded in mammalian auditory cortex have indeed reinforced the premise of an array of modulation-sensitive filters, potentially orthogonal to the tonotopic representation of auditory cortical neurons (Schreiner and Urbas, 1986; Brosch and Schreiner, 2000; Depireux et al., 2001). The manifestation of this distributed sensitivity as differential behavioral tuning to a range of modulation rates <16 Hz has not been explored in the literature.
The change of the neural and behavioral representation of the attended rhythm over time depends on the attended rate, as well as the duration of deviant to be detected for each rhythm. Although the perceptual detectability of the target for the 4 Hz stream builds up in a pattern closely following its neural power buildup, the evolution of the other rates over time generally plateau then decay (expect for the 10.1 Hz rate). Two factors may be responsible for the absence of a “classic” buildup for these other rhythms, notably the different durations of jitter for the deviants of each rhythm (which may make them harder to detect) or the choice of modulation rate (which may cause faster buildup that drops down after an early plateau). Moreover, the choice of competing rhythm interacts strongly with the attended rhythm as shown by the analysis in Table 1 and Figure 6b. In fact, the presence of the competing rhythm introduces strong competition for attention that distracts from correctly attending to the target, hence increasing the false-alarm rate caused by the opposite task. Previous results have shown that switching attention away or back to a sequence plays a strong role in resetting its buildup, hence explaining the lack of a classic buildup effect for the paradigm in this study (Carlyon et al., 2001; Cusack et al., 2004).
Overall, the present findings provide the first demonstration exploring the biophysical underpinning of temporal integration of separate streams in the auditory system. The results establish a direct role of the known temporal modulation tuning in the auditory system as measured by temporal MTF and indicate that grouping of perceptual features in a complex acoustic scene operates at modulatory rates of the order of 2–16 Hz, following a pattern of sensitivity that renders these rates to be variably efficient in the streaming process. The efficiency of these rates is shaped by tuning properties of the auditory system, more specifically the auditory cortex whose neuronal dynamics are commensurate with tempi of few hertz (2–16 Hz) (Kowalski et al., 1996; Miller et al., 2002; Liégeois-Chauvel et al., 2004). The representation in sensory cortex is further shaped by attention, which modulates the cortical steady-state response in both its magnitude as well as temporal coherence. This interaction between innate properties of the auditory system and top-down attention assists the brain in solving the challenging cocktail party problem.
Footnotes
Support for this work has been provided by National Institutes of Health Grants R01DC008342 and 1R01DC007657, Air Force Office of Scientific Research Grant FA9550-09-1-0234, and National Science Foundation Award IIS-0846112. We thank Shihab Shamma and David Poeppel for comments and discussion. We are grateful to Jeff Walker and Ming Sun for their technical support.
References
- Ahmar NE, Simon JZ. MEG adaptive noise suppression using fast LMS. Presented at the Second International IEEE Engineering in Medicine and Biology Society Conference on Neural Engineering; March 16–19; Washington, DC. 2005. [Google Scholar]
- Ahmar NE, Wang Y, Simon JZ. Significance tests for MEG response detection. Presented at the Second International IEEE Engineering in Medicine and Biology Society Conference on Neural Engineering; March 16–19; Washington, DC. 2005. [Google Scholar]
- Ahveninen J, Jääskeläinen IP, Raij T, Bonmassar G, Devore S, Hämäläinen M, Levänen S, Lin FH, Sams M, Shinn-Cunningham BG, Witzel T, Belliveau JW. Task-modulated “what” and “where” pathways in human auditory cortex. Proc Natl Acad Sci U S A. 2006;103:14608–14613. doi: 10.1073/pnas.0510480103. [DOI] [PMC free article] [PubMed] [Google Scholar]
- Alain C. Breaking the wave: effects of attention and learning on concurrent sound perception. Hear Res. 2007;229:225–236. doi: 10.1016/j.heares.2007.01.011. [DOI] [PubMed] [Google Scholar]
- Alcaini M, Giard MH, Echallier JF, Pernier J. Selective auditory attention effects in tonotopically organized cortical areas: a topographic ERP study. Hum Brain Mapp. 1995;2:59–169. [Google Scholar]
- Arai T, Pavel M, Hermansky H, Avendano C. Syllable intelligibility for temporally filtered LPC cepstral trajectories. J Acoust Soc Am. 1999;105:2783–2791. doi: 10.1121/1.426895. [DOI] [PubMed] [Google Scholar]
- Beauvillain C, Fraisse P. On the temporal control of polyrhythmic performance. Music Percept. 1984;1:485–499. [Google Scholar]
- Bidet-Caulet A, Fischer C, Besle J, Aguera PE, Giard MH, Bertrand O. Effects of selective attention on the electrophysiological representation of concurrent sounds in the human auditory cortex. J Neurosci. 2007;27:9252–9261. doi: 10.1523/JNEUROSCI.1402-07.2007. [DOI] [PMC free article] [PubMed] [Google Scholar]
- Bregman AS. Auditory streaming is cumulative. J Exp Psychol Hum Percept Perform. 1978;4:380–387. doi: 10.1037//0096-1523.4.3.380. [DOI] [PubMed] [Google Scholar]
- Bregman AS. Cambridge, MA: Massachusetts Institute of Technology; 1990. Auditory scene analysis: the perceptual organization of sound. [Google Scholar]
- Brosch M, Schreiner CE. Sequence sensitivity of neurons in cat primary auditory cortex. Cereb Cortex. 2000;10:1155–1167. doi: 10.1093/cercor/10.12.1155. [DOI] [PubMed] [Google Scholar]
- Carlyon RP. How the brain separates sounds. Trends Cogn Sci. 2004;8:465–471. doi: 10.1016/j.tics.2004.08.008. [DOI] [PubMed] [Google Scholar]
- Carlyon RP, Cusack R, Foxton JM, Robertson IH. Effects of attention and unilateral neglect on auditory stream segregation. J Exp Psychol Hum Percept Perform. 2001;27:115–127. doi: 10.1037//0096-1523.27.1.115. [DOI] [PubMed] [Google Scholar]
- Chi T, Gao Y, Guyton MC, Ru P, Shamma S. Spectro-temporal modulation transfer functions and speech intelligibility. J Acoust Soc Am. 1999;106:2719–2732. doi: 10.1121/1.428100. [DOI] [PubMed] [Google Scholar]
- Ciocca V, Darwin CJ. Effects of onset asynchrony on pitch perception: adaptation or grouping? J Acoust Soc Am. 1993;93:2870–2878. doi: 10.1121/1.405806. [DOI] [PubMed] [Google Scholar]
- Corbetta M, Miezin FM, Dobmeyer S, Shulman GL, Petersen SE. Attentional modulation of neural processing of shape, color, and velocity in humans. Science. 1990;248:1556–1559. doi: 10.1126/science.2360050. [DOI] [PubMed] [Google Scholar]
- Cusack R, Roberts B. Effects of differences in timbre on sequential grouping. Percept Psychophys. 2000;62:1112–1120. doi: 10.3758/bf03212092. [DOI] [PubMed] [Google Scholar]
- Cusack R, Deeks J, Aikman G, Carlyon RP. Effects of location, frequency region, and time course of selective attention on auditory scene analysis. J Exp Psychol Hum Percept Perform. 2004;30:643–656. doi: 10.1037/0096-1523.30.4.643. [DOI] [PubMed] [Google Scholar]
- Darwin CJ. Perceptual grouping of speech components differing in fundamental frequency and onset-time. Q J Exp Psychol. 1981;33:185–207. [Google Scholar]
- Darwin CJ. Auditory grouping. Trends Cogn Sci. 1997;1:327–333. doi: 10.1016/S1364-6613(97)01097-8. [DOI] [PubMed] [Google Scholar]
- Darwin CJ, Hukin RW. Auditory objects of attention: the role of interaural time differences. J Exp Psychol Hum Percept Perform. 1999;25:617–629. doi: 10.1037//0096-1523.25.3.617. [DOI] [PubMed] [Google Scholar]
- Depireux DA, Simon JZ, Klein DJ, Shamma SA. Spectro-temporal response field characterization with dynamic ripples in ferret primary auditory cortex. J Neurophysiol. 2001;85:1220–1234. doi: 10.1152/jn.2001.85.3.1220. [DOI] [PubMed] [Google Scholar]
- Deutsch D. The generation of two isochronous sequences in parallel. Percept Psychophys. 1983;34:331–337. doi: 10.3758/bf03203045. [DOI] [PubMed] [Google Scholar]
- Drullman R, Festen JM, Plomp R. Effect of temporal envelope smearing on speech reception. J Acoust Soc Am. 1994;95:1053–1064. doi: 10.1121/1.408467. [DOI] [PubMed] [Google Scholar]
- Efron B, Tibshirani R. New York: Chapman and Hall/CRC; 1993. An introduction to the bootstrap. [Google Scholar]
- Eggermont JJ. Rate and synchronization measures of periodicity coding in cat primary auditory cortex. Hear Res. 1991;56:153–167. doi: 10.1016/0378-5955(91)90165-6. [DOI] [PubMed] [Google Scholar]
- Elhilali M, Xiang J, Shamma SA, Simon JZ. Interaction between attention and bottom-up saliency mediates the representation of foreground and background in an auditory scene. PLoS Biol. 2009a;7:e1000129. doi: 10.1371/journal.pbio.1000129. [DOI] [PMC free article] [PubMed] [Google Scholar]
- Elhilali M, Ma L, Micheyl C, Oxenham AJ, Shamma SA. Temporal coherence in the perceptual organization and cortical representation of auditory scenes. Neuron. 2009b;61:317–329. doi: 10.1016/j.neuron.2008.12.005. [DOI] [PMC free article] [PubMed] [Google Scholar]
- Fisher NI. New York: Cambridge UP; 1993. Statistical analysis of circular data. [Google Scholar]
- Fritz J, Shamma S, Elhilali M, Klein D. Rapid task-related plasticity of spectrotemporal receptive fields in primary auditory cortex. Nat Neurosci. 2003;6:1216–1223. doi: 10.1038/nn1141. [DOI] [PubMed] [Google Scholar]
- Gaetz M, Weinberg H, Rzempoluck E, Jantzen KJ. Neural network classifications and correlation analysis of EEG and MEG activity accompanying spontaneous reversals of the Necker cube. Brain Res Cogn Brain Res. 1998;6:335–346. doi: 10.1016/s0926-6410(97)00038-4. [DOI] [PubMed] [Google Scholar]
- Greenberg S. Temporal properties of spoken language. Presented at the 18th International Congress on Acoustics; April 4–9; Kyoto, Japan. 2004. [Google Scholar]
- Greenberg S, Arai T. What are the essential cues for understanding spoken language? IEICE Trans Inform Syst E. 2004;87:1059–1070. [Google Scholar]
- Grimault N, Bacon SP, Micheyl C. Auditory stream segregation on the basis of amplitude-modulation rate. J Acoust Soc Am. 2002;111:1340–1348. doi: 10.1121/1.1452740. [DOI] [PubMed] [Google Scholar]
- Grothe B, Klump GM. Temporal processing in sensory systems. Curr Opin Neurobiol. 2000;10:467–473. doi: 10.1016/s0959-4388(00)00115-x. [DOI] [PubMed] [Google Scholar]
- Handel S. Using polyrhythms to study rhythm. Music Percept. 1984;1:465–484. [Google Scholar]
- Hill KT, Miller LM. Auditory attentional control and selection during cocktail party listening. Cereb Cortex. 2010;20:583–590. doi: 10.1093/cercor/bhp124. [DOI] [PMC free article] [PubMed] [Google Scholar]
- ISO-226. Geneva: International Organization for Standardization; 2003. Acoustics: normal equal-loudness-level contours. [Google Scholar]
- Kaltwasser MT. Acoustic signaling in the black rat (Rattus rattus) J Comp Psychol. 1990;104:227–232. doi: 10.1037/0735-7036.104.3.227. [DOI] [PubMed] [Google Scholar]
- Kay SM. Upper Saddle River, NJ: Prentice-Hall; 1993. Fundamentals of statistical signal processing: estimation theory. [Google Scholar]
- Kilgard MP, Merzenich MM. Distributed representation of spectral and temporal information in rat primary auditory cortex. Hear Res. 1999;134:16–28. doi: 10.1016/s0378-5955(99)00061-1. [DOI] [PMC free article] [PubMed] [Google Scholar]
- Kim H, Bao S. Selective increase in representations of sounds repeated at an ethological rate. J Neurosci. 2009;29:5163–5169. doi: 10.1523/JNEUROSCI.0365-09.2009. [DOI] [PMC free article] [PubMed] [Google Scholar]
- Klapp ST, Hill MD, Tyler JG, Martin ZE, Jagacinski RJ, Jones MR. On marching to two different drummers: perceptual aspects of the difficulties. J Exp Psychol Hum Percept Perform. 1985;11:814–827. doi: 10.1037//0096-1523.11.6.814. [DOI] [PubMed] [Google Scholar]
- Kowalski N, Depireux DA, Shamma SA. Analysis of dynamic spectra in ferret primary auditory cortex. II. Prediction of unit responses to arbitrary dynamic spectra. J Neurophysiol. 1996;76:3524–3534. doi: 10.1152/jn.1996.76.5.3524. [DOI] [PubMed] [Google Scholar]
- Liégeois-Chauvel C, Lorenzi C, Trébuchon A, Régis J, Chauvel P. Temporal envelope processing in the human left and right auditory cortices. Cereb Cortex. 2004;14:731–740. doi: 10.1093/cercor/bhh033. [DOI] [PubMed] [Google Scholar]
- Liu RC, Miller KD, Merzenich MM, Schreiner CE. Acoustic variability and distinguishability among mouse ultrasound vocalizations. J Acoust Soc Am. 2003;114:3412–3422. doi: 10.1121/1.1623787. [DOI] [PubMed] [Google Scholar]
- Lomber SG, Malhotra S. Double dissociation of “what” and “where” processing in auditory cortex. Nat Neurosci. 2008;11:609–616. doi: 10.1038/nn.2108. [DOI] [PubMed] [Google Scholar]
- McDermott JH. The cocktail party problem. Curr Biol. 2009;19:R1024–R1027. doi: 10.1016/j.cub.2009.09.005. [DOI] [PubMed] [Google Scholar]
- Micheyl C, Carlyon RP, Cusack R, Moore BCJ. Performance measures of auditory organization. In: Pressnitzer D, de Cheveigne A, McAdams S, Collet L, editors. Auditory signal processing. Physiology, psychoacoustics, and models. New York: Springer; 2005. pp. 203–211. [Google Scholar]
- Micheyl C, Carlyon RP, Gutschalk A, Melcher JR, Oxenham AJ, Rauschecker JP, Tian B, Courtenay Wilson E. The role of auditory cortex in the formation of auditory streams. Hear Res. 2007;229:116–131. doi: 10.1016/j.heares.2007.01.007. [DOI] [PMC free article] [PubMed] [Google Scholar]
- Miller LM, Escabí MA, Read HL, Schreiner CE. Spectrotemporal receptive fields in the lemniscal auditory thalamus and cortex. J Neurophysiol. 2002;87:516–527. doi: 10.1152/jn.00395.2001. [DOI] [PubMed] [Google Scholar]
- Moelants D, Van Noorden LP. The influence of pitch interval on the perception of polyrhythms. Music Percept. 2005;22:425–440. [Google Scholar]
- Moore BCJ, Gockel H. Factors influencing sequential stream segregation. Acta Acustica. 2002;88:320–333. [Google Scholar]
- Moore BC, Glasberg BR, Peters RW. Thresholds for hearing mistuned partials as separate tones in harmonic complexes. J Acoust Soc Am. 1986;80:479–483. doi: 10.1121/1.394043. [DOI] [PubMed] [Google Scholar]
- Näätänen R, Picton T. The N1 wave of the human electric and magnetic response to sound: a review and an analysis of the component structure. Psychophysiology. 1987;24:375–425. doi: 10.1111/j.1469-8986.1987.tb00311.x. [DOI] [PubMed] [Google Scholar]
- Nagarajan SS, Cheung SW, Bedenbaugh P, Beitel RE, Schreiner CE, Merzenich MM. Representation of spectral and temporal envelope of twitter vocalizations in common marmoset primary auditory cortex. J Neurophysiol. 2002;87:1723–1737. doi: 10.1152/jn.00632.2001. [DOI] [PubMed] [Google Scholar]
- Nelken I. Processing of complex stimuli and natural scenes in the auditory cortex. Curr Opin Neurobiol. 2004;14:474–480. doi: 10.1016/j.conb.2004.06.005. [DOI] [PubMed] [Google Scholar]
- Niebur E, Hsiao SS, Johnson KO. Synchrony: a neuronal mechanism for attentional selection? Curr Opin Neurobiol. 2002;12:190–194. doi: 10.1016/s0959-4388(02)00310-0. [DOI] [PubMed] [Google Scholar]
- Oldfield RC. The assessment and analysis of handedness: the Edinburgh inventory. Neuropsychologia. 1971;9:97–113. doi: 10.1016/0028-3932(71)90067-4. [DOI] [PubMed] [Google Scholar]
- Paltoglou AE, Sumner CJ, Hall DA. Examining the role of frequency specificity in the enhancement and suppression of human cortical activity by auditory selective attention. Hear Res. 2009;257:106–118. doi: 10.1016/j.heares.2009.08.007. [DOI] [PubMed] [Google Scholar]
- Phillips DP, Hall SE, Hollett JL. Repetition rate and signal level effects on neuronal responses to brief tone pulses in cat auditory cortex. J Acoust Soc Am. 1989;85:2537–2549. doi: 10.1121/1.397748. [DOI] [PubMed] [Google Scholar]
- Poremba A, Saunders RC, Crane AM, Cook M, Sokoloff L, Mishkin M. Functional mapping of the primate auditory system. Science. 2003;299:568–572. doi: 10.1126/science.1078900. [DOI] [PubMed] [Google Scholar]
- Roberts B, Bailey PJ. Regularity of spectral pattern and its effects on the perceptual fusion of harmonics. Percept Psychophys. 1996;58:289–299. doi: 10.3758/bf03211882. [DOI] [PubMed] [Google Scholar]
- Roberts B, Glasberg BR, Moore BC. Primitive stream segregation of tone sequences without differences in fundamental frequency or passband. J Acoust Soc Am. 2002;112:2074–2085. doi: 10.1121/1.1508784. [DOI] [PubMed] [Google Scholar]
- Schnupp JW, Hall TM, Kokelaar RF, Ahmed B. Plasticity of temporal pattern codes for vocalization stimuli in primary auditory cortex. J Neurosci. 2006;26:4785–4795. doi: 10.1523/JNEUROSCI.4330-05.2006. [DOI] [PMC free article] [PubMed] [Google Scholar]
- Schoenfeld MA, Hopf JM, Martinez A, Mai HM, Sattler C, Gasde A, Heinze HJ, Hillyard SA. Spatio-temporal analysis of feature-based attention. Cereb Cortex. 2007;17:2468–2477. doi: 10.1093/cercor/bhl154. [DOI] [PubMed] [Google Scholar]
- Schreiner CE, Urbas JV. Representation of amplitude modulation in the auditory cortex of the cat. I. The anterior auditory field (AAF) Hear Res. 1986;21:227–241. doi: 10.1016/0378-5955(86)90221-2. [DOI] [PubMed] [Google Scholar]
- Simon JZ, Wang Y. Fully complex magnetoencephalography. J Neurosci Methods. 2005;149:64–73. doi: 10.1016/j.jneumeth.2005.05.005. [DOI] [PubMed] [Google Scholar]
- Somers DC, Dale AM, Seiffert AE, Tootell RB. Functional MRI reveals spatially specific attentional modulation in human primary visual cortex. Proc Natl Acad Sci U S A. 1999;96:1663–1668. doi: 10.1073/pnas.96.4.1663. [DOI] [PMC free article] [PubMed] [Google Scholar]
- Srinivasan R, Russell DP, Edelman GM, Tononi G. Increased synchronization of neuromagnetic responses during conscious perception. J Neurosci. 1999;19:5435–5448. doi: 10.1523/JNEUROSCI.19-13-05435.1999. [DOI] [PMC free article] [PubMed] [Google Scholar]
- Treue S, Martínez Trujillo JC. Feature-based attention influences motion processing gain in macaque visual cortex. Nature. 1999;399:575–579. doi: 10.1038/21176. [DOI] [PubMed] [Google Scholar]
- van Noorden LP. Eindhoven, The Netherlands: Eindhoven University of Technology; 1975. Temporal coherence in the perception of tone sequences. [Google Scholar]
- van Noorden LP. Minimun differences of level and frequency for perceptual fission of tone sequences ABAB. J Acoust Soc Am. 1977;61:1041–1045. doi: 10.1121/1.381388. [DOI] [PubMed] [Google Scholar]
- van Zanten GA, Senten CJ. Spectro-temporal modulation transfer function (STMTF) for various types of temporal modulation and a peak distance of 200 Hz. J Acoust Soc Am. 1983;74:52–62. doi: 10.1121/1.389617. [DOI] [PubMed] [Google Scholar]