

Abstract
From venous tracer-dilution curves recorded after 36 pulse injections of 42KCl and 131I-labeled albumin into the coronary artery inflow of 15 isolated canine heart preparations, we calculated maximal fractional extractions (Emax) and capillary permeability-surface area products (PScap) for 42K+ over a range of plasma flows (FP) from 0.3 to 1.7 ml min−1 g−1. At low FP (<1.0), Emax was 0.60 ± 0.06 (mean ± SD) and PScap was 0.72 ± 0.20 ml min−1 g−1; at high FP (>1.0), Emax decreased to 0.49 ± 0.05 and PScap increased to 1.06 ± 0.18. Continuous recording (gamma detector) of residual myocardial 42K+ in seven hearts showed that the mean fractional escape rate of tracer between 30 and 60 min after injection was 0.011–0.023 min−1; higher rates were observed at high FP, when the residue of 42K+ decreased to less than 10 % of the injected dose by 60 min. Using PScap measured at high FP and considering the virtual intracellular volume of distribution for K+ to be 20 ml/g, we calculated the permeability-surface area product for sarcolemma (PScw) as 0.54–0.73 ml min−1 g−1, or about 50 % of PScap. Considering sarcolemmal surface area (Scw) as 4,200 cm2/g and capillary surface area (Scap) as 500 cm2/g, cell permeability is low, with Pcw: Pcap being less than 0.08.
Keywords: diffusion across membranes, emergence function, fractional escape rates, indicator-dilution techniques, permeability-surface area products, potassium residue function
THE BLOOD-TISSUE EXCHANGE of substances limited to the extracellular space depends on the blood flow to the tissue, the permeability of the capillary wall, the surface area available for exchange, the rate of diffusion of the substance throughout the extravascular space, and the extracellular volume of distribution. If the substance penetrates the cell wall, then the permeability and surface area of the cell wall and the intracellular volume of distribution of the tracer also influence the exchange. This latter condition exists with the blood-tissue exchange of potassium or rubidium, a situation in which active transport across the cell wall creates a large virtual intracellular volume of distribution.
In the present study we attempted to quantify the steady-state exchanges of potassium between capillary blood and the myocardial cell in the isolated, blood-perfused, canine heart. We considered the primary resistances to diffusional exchanges in the myocardium to be localized to the capillary membrane and cell wall, with negligible resistances to diffusion in blood and in extracellular and intracellular fluids.
For diffusion-limited substances, permeability of the capillary membrane can be estimated from paired indicator-dilution curves (1, 8, 11, 16, 29, 30, 32). The instantaneous fractional tissue extraction (E) is defined as the amount of indicator diffusing from the blood into the tissue during one traversal of a capillary bed relative to the total amount injected into the arterial inflow:
| (1) |
in which hR(t) represents the distribution of transit times of a reference nonpenetrating tracer from the arterial to the venous blood—or the fraction of the total dose injected into the arterial inflow that is appearing per second in the venous outflow. Similarly, h(t) represents the fraction of injected penetrating tracer appearing per second in the venous outflow. If both indicators are dispersed equally in the bloodstream of the system (8, 16, 21) and backflux of tracer from the extravascular to the intravascular compartment is negligible, then the fractional extraction can be used to calculate the product of permeability and surface area (PS) as suggested by Sangren and Sheppard (21), Renkin (20), and Crone (8):
| (2) |
in which F is the flow of the solvent carrying the solute and E is the appropriate fractional extraction. Backflux of tracer from tissue to blood causes a diminution in the observed E, which leads to greater underestimation of PS when E is high than when it is low. An approximate but directionally appropriate and reasonably accurate correction has been worked out for sodium extraction in dog hearts from a hexagonal capillary-tissue model (1, 11); it is expressed as a variant of equation 2:
| (2a) |
Emax is defined as the average fractional extraction during the early plateau phase of E(t) occurring up to the time of the peak of the albumin reference curve. The evidence and arguments for this Emax providing the best estimate of the average extraction in an organ with a heterogeneity of regional flows are given in the background studies (1, 11). The correction obtained with equation 2a is important because it gives substantially higher values for PScap for a solute, like potassium, with a high permeability.
In our experiments, we measured the permeability-surface area product of the capillary membrane (PScap) for 42KCl in the isolated heart by using the Emax after a bolus injection into the arterial inflow. By monitoring the steady-state washout of 42K+ after the same impulse injection, we obtained the emergence function, η(t) min−1 (4, 18), which is the fractional escape rate at each time t after injection or is the logarithmic slope of the washout curve. Using this emergence function, we calculated the total potassium conductance (PST) from the intracellular compartment to capillary blood. From our data we calculated the resistance at the capillary membrane (1/PScap) and also the composite resistance of the capillary membrane and cell wall in series (1/PST) for each heart. From this, we estimated the resistance at the cell wall (1/PScw) for this three-compartment model.
METHODS
Experiments were performed on isolated, Langendorff, nonworking, spontaneously beating, canine hearts weighing 60–110 g and perfused with blood at 37.5 °C taken from the femoral artery of anesthetized, artificially ventilated, support dogs weighing about 50 kg, as described in detail previously (3, 27). The perfusion rate was controlled with a roller pump on the inflow line. Perfusion pressure, perfusate temperature, coronary sinus pressure, heart rate, and heart weight were monitored and recorded continuously. Drainage from the coronary sinus, right atrium, and right ventricle was via a cannula passing from the right ventricle through the pulmonary artery. The small left ventricular drainage (thebesian drainage plus aortic valve leakage) was via a small cannula through the apex. Flows through the pulmonary and apical cannulas were measured, and venous samples were collected for hematocrit, blood glucose, and serum potassium determinations before injection of tracers and periodically thereafter. At the end of each experiment, the wet weight of the myocardium devoid of fatty tissue was measured.
Two different experiments were performed. The first experiment was designed to measure E(t) and PScap for 42K+ in six isolated heart preparations perfused over a wide range of flows. After perfusion pressure, flow rate, heart weight, and blood temperature were stabilized at each level, samples of venous blood were removed for hematocrit, blood chemistry, and background isotope activity determinations. Then, a mixture of 20 μCi of 131I-labeled albumin (RISA, Abbott Laboratories, North Chicago, Ill.) and 30–40 μCi of 42KCl (Cambridge Nuclear Corp., Cambridge, Mass.) dissolved in saline was injected as a bolus (total volume 0.4–0.8 ml) into the aortic inflow. The duration of the injection was approximately 1 s. A gamma-detecting isotope probe positioned over the coronary venous outflow line signaled the first appearance of injected isotope in the coronary venous blood. At this time, a multiple-sampling device was started and coronary venous blood was sampled at 1.0-s intervals when flow was low and 0.4-s intervals when flow was high; 30 samples were collected for each curve. When sampling was completed, flow rate was measured again, and the collected blood samples were processed and weighed prior to counting in a well counter (Autowell II, Picker Corporation, North Haven, Conn.). For each curve, a measured aliquot of injectate was also counted with the blood samples, and correction was made for isotopic decay occurring during the counting period.
The second experiment was designed to monitor coronary venous and myocardial 42K+ simultaneously after bolus injection of 42KCl into the arterial inflow of nine isolated hearts. Two gamma-detecting systems were used. One probe (thallium-activated sodium iodide crystal) was set facing the anterior wall of the left ventricle to detect the residual 42K+ contained in the isolated heart. The other, a flow-through probe, monitored the venous outflow line to record the venous tracer concentration. The reference tracer, to provide hR(t), was unlabeled indocyanine green (supplied through the courtesy of Hynson, Westcott & Dunning, Inc., Baltimore, Md.). Its concentration was measured with a densitometer (XC100A, Waters Corp., Rochester, Minn.) carefully placed in parallel with the venous outflow line through the gamma detector. In preliminary experiments 131I-labeled albumin and indocyanine green injected in one bolus showed virtually identical mean transit times and dispersions.
In two hearts (1054 and 2054, Table 1), after stabilization of FP and perfusion pressure at each level, we measured Emax and PScap over a wide range of FP by injecting 0.4–0.6 ml containing 20–40 μCi of 42K+ and 0.125 mg of indocyanine green into the aortic inflow. The dye curves were recorded for about 2 min and the 42K+ in both heart and venous outflow was monitored for 5–10 min. In each of the remaining seven hearts, one bolus of 0.4–0.8 ml containing 50–100 μCi of 42K+ and 0.125 mg of indocyanine green was injected into the aortic inflow. Emax and PScap were calculated from the first-pass venous tracer-dilution curves; 42K+ activity over the heart and the venous outflow was monitored for 2–4 h. In two of these washout experiments (27089 and 28089, Table 2), dipyridamole was infused slowly into the isolated heart preparation in order to minimize the increase in perfusion pressure associated with high flows.
TABLE 1.
Summary of data from eight hearts: meawement of Emax and PScap at various flows
| Expt No. | Wt, g* | Curve | Perfusion Time, min | FP, ml min−1 g−1 | MPP, mmHg | Hct, % | Glucose, mg/dl | Emax |
PScap, ml min−1 g−1 |
|
|---|---|---|---|---|---|---|---|---|---|---|
| Eq. 2 | Eq. 2a | |||||||||
| 27118 | 64.1 | 1 | 120 | 0.49 | 100 | 0.41 | 65 | 0.54 | 0.38 | 0.47 |
| 2 | 140 | 1.07 | 133 | 0.43 | 72 | 0.43 | 0.60 | 0.72 | ||
| 11128 | 65.2 | 1 | 110 | 0.40 | 110 | 0.46 | 88 | 0.55 | 0.32 | 0.39 |
| 15019 | 66.9 | 1 | 145 | 0.47 | 93 | 0.34 | 93 | 0.54 | 0.36 | 0.45 |
| 2 | 180 | 0.73 | 155 | 0.40 | 86 | 0.56 | 0.60 | 0.74 | ||
| 7059 | 63.0 | 1 | 120 | 0.43 | 56 | 0.29 | 44 | 0.58 | 0.37 | 0.46 |
| 2 | 202 | 0.64 | 76 | 0.16 | 264 | 0.51 | 0.46 | 0.55 | ||
| 3 | 167 | 1.30 | 153 | 0.16 | 330 | 0.39 | 0.64 | 0.76 | ||
| 21059 | 55.6 | 1 | 141 | 0.53 | 75 | 0.48 | 58 | 0.60 | 0.49 | 0.61 |
| 2 | 104 | 0.80 | 100 | 0.47 | 160 | 0.62 | 0.77 | 0.98 | ||
| 3 | 67 | 0.87 | 130 | 0.42 | 84 | 0.64 | 0.89 | 1.13 | ||
| 4 | 220 | 1.33 | 135 | 0.43 | 57 | 0.52 | 0.98 | 1.19 | ||
| 29059 | 60.4 | 1 | 195 | 0.70 | 87 | 0.31 | 61 | 0.62 | 0.68 | 0.85 |
| 2 | 138 | 0.93 | 126 | 0.29 | 75 | 0.58 | 0.81 | 1.00 | ||
| 3 | 58 | 1.19 | 140 | 0.32 | 114 | 0.51 | 0.85 | 1.03 | ||
| 2054 | 94.8 | 1 | 104 | 0.44 | 65 | 0.34 | 63 | 0.66 | 0.47 | 0.61 |
| 2 | 133 | 0.55 | 80 | 0.35 | 0.60 | 0.50 | 0.63 | |||
| 3 | 70 | 0.76 | 120 | 0.32 | 65 | 0.58 | 0.66 | 0.82 | ||
| 4 | 148 | 0.97 | 105 | 0.55 | 0.77 | 0.95 | ||||
| 5 | 118 | 1.07 | 120 | 0.50 | 0.74 | 0.90 | ||||
| 6 | 89 | 1.29 | 135 | 0.48 | 0.84 | 1.02 | ||||
| 1054 | 90.1 | 1 | 74 | 0.34 | 90 | 0.26 | 89 | 0.74 | 0.46 | 0.63 |
| 2 | 130 | 0.45 | 91 | 0.66 | 0.49 | 0.62 | ||||
| 3 | 115 | 0.64 | 95 | 0.28 | 97 | 0.62 | 0.62 | 0.78 | ||
| 4 | 90 | 0.73 | 95 | 0.58 | 0.63 | 0.79 | ||||
| 5 | 59 | 0.93 | 110 | 0.26 | 0.49 | 0.63 | 0.76 | |||
| 6 | 151 | 1.04 | 125 | 0.50 | 0.72 | 0.87 | ||||
| 7 | 140 | 1.26 | 104 | 0.46 | 0.78 | 0.93 | ||||
| 8 | 172 | 1.33 | 110 | 0.52 | 0.98 | 1.19 | ||||
| 9 | 105 | 1.49 | 135 | 0.48 | 0.97 | 1.17 | ||||
| 10 | 161 | 1.66 | 144 | 0.27 | 110 | 0.42 | 0.90 | 1.08 | ||
Time = minutes after isolation and start of perfusion of isolated heart; FP = plasma flow; MPP = mean perfusion pressure; Hct = hematocrit ratio; glucose = plasma glucose concentration; Emax = maximal fractional extraction; PScap = capillary permeability-surface area product.
Fat-free wet weight of myocardium.
TABLE 2.
Summary of data from seven 42K+ efflux studies
| Experiment |
|||||||
|---|---|---|---|---|---|---|---|
| 12039 | 13039 | 26089 | 25044 | 28089* | 24044 | 27089* | |
| Chemical and hemodynamic data; Emax and PScap from first-pass tracer-dilution curves | |||||||
| Fat-free wt, g | 65.9 | 63.1 | 74.9 | 106.7 | 76.0 | 104.4 | 72.4 |
| FP. ml min−1 g−1 | 0.44 | 0.52 | 0.96 | 1.19 | 1.24 | 1.30 | 1.34 |
| MPP, mmHg | 100 | 124 | 100 | 105 | 127 | 119 | 100 |
| Hct, % | 0.45 | 0.44 | 0.30 | 0.40 | 0.32 | 0.27 | 0.20 |
| Glucose, mg/dl | 59 | 163 | 94 | 59 | 54 | 160 | |
| K, meq/liter | 3.3 | 4.7 | 3.3 | 3.7 | 3.8 | 3.6 | 3.4 |
| E max | 0.62† | 0.69 | 0.54† | 0.53 | 0.58 | 0.55 | 0.54 |
| PScap, Eq. 2a | 0.54 | 0.80 | 0.91 | 1.10 | 1.33 | 1.28 | 1.27 |
| Calculations based on early 42K+ efflux (30–60 min) | |||||||
| R(60) | 0.30 | 0.19 | 0.10 | 0.06 | 0.06 | 0.09 | 0.09 |
| , 10−3 min−1 | 11.4 | 12.0 | 14.6 | 18.2 | 23.4 | 22.6 | 20.0 |
| PST, ml min−1 g−1 | 0.23 | 0.24 | 0.29 | 0.36 | 0.47 | 0.45 | 0.40 |
| PScw, ml min−1 g−l | 0.40 | 0.34 | 0.43 | 0.54 | 0.73 | 0.69 | 0.58 |
| PScw:PScap | 0.74 | 0.43 | 0.47 | 0.49 | 0.55 | 0.54 | 0.46 |
| PScw:PScap | 0.09 | 0.05 | 0.06 | 0.06 | 0.07 | 0.06 | 0.05 |
| Calculations based on late 42K+ efflux | |||||||
| T, min | 100 | 225 | 120 | 190 | 204 | 205 | 218 |
| R(T) | 0.19 | 0.04 | 0.05 | 0.01 | 0.01 | 0.01 | 0.01 |
| 11.1 | 9.8 | 10.3 | 7.3 | 7.9 | 7.4 | 9.7 | |
| PST, ml min−1 g−1 | 0.22 | 0.20 | 0.21 | 0.15 | 0.16 | 0.15 | 0.19 |
| PScw, ml min−1 g−1 | 0.37 | 0.27 | 0.27 | 0.17 | 0.18 | 0.17 | 0.22 |
| PScw:PScap | 0.69 | 0.33 | 0.30 | 0.16 | 0.14 | 0.13 | 0.18 |
| Pcw:Pcap | 0.08 | 0.04 | 0.04 | 0.02 | 0.02 | 0.02 | 0.02 |
Abbreviations as in Table 1 plus: K = mean of several serum K determinations during each experiment (no differences were seen between arterial and coronary sinus samples); R(60) = residue function at 60 min after injection (fraction of total injected dose of 42K+ remaining in the heart); = mean emergence function from early 42K+ efflux between 30 and 60 min; PSt = total conductance (permeability-surface area product) from cell to blood by equation 8; PScw = conductance (permeability-surface area product) of cell wall by equation 9; T = time of termination of experiment (minutes after injection of 42K+); R(T) = residue function at end of experiment; = mean emergence function over last 30 min of 42K+ efflux; Pcw:Pcap derived from PScw:PScap, considering Scw as 4,200 cm2/g myocardium (2) and Scap as 500 cm2/g (5).
Dipyridamole given.
For all experiments, return of isotopically labeled venous blood to the system was minimized by diverting the initial (l–4 min) flow of perfused blood into a separate container and replacing it with an equal volume of blood previously withdrawn from the support dog; the blood volume of the support dog was kept constant by previous infusion of low-molecular-weight dextran (Rheomacrodex, 10% wt/vol, Pharmacia, Uppsala; kindly supplied by Pharmacia Laboratories, Inc., Piscataway, N.J.) in isotonic saline. Isotopic activity in arterial blood (from the support animal) did not increase appreciably above background level throughout each of the washout experiments.
MATHEMATICAL ANALYSIS
In the first set of experiments, 30 discrete blood samples were obtained at 0.4- to 1.0-s intervals at the coronary venous outflow after each intra-aortic injection of tracers. Knowing the time of collection (t), the isotope activity in each sample (C(t)), the injected dose of each tracer (mi), and the measured plasma flow (FP), we calculated hR(t) for 131I-labeled albumin and h(t) for 42K+ by the general equation:
| (3) |
From hR(t) and h(t), the instantaneous fractional extraction E(t) was calculated with equation 1. From E(t), the maximal plateau value Emax was chosen as the best estimate of the average fractional extraction (1, 11) and was used to calculate PScap according to equations 2 and 2a.
In the second set of experiments, hR(t) was calculated directly from the reference indocyanine green dilution curves recorded at the venous outflow:
| (4) |
In theory, this same equation can be used to calculate h(t) for 42K+. However, the tails of the 42K+ venous tracer-dilution curves were very long and hard to distinguish from background, so could not be determined accurately from the venous curves alone. For this reason, we used data recorded simultaneously by the cardiac detector in order to normalize the venous curve for calculation of h(t) and Emax for 42K+.
The ratio of cardiac detector output at time t (C*(t)) to that at time zero (C*(0)) or at time of the peak count rate 2–3 s after injection before any tracer has escaped from the field of the cardiac detector is the residue function R(t), calculated as C*(t)/C*(0). Assuming no delay in tracer transit from the exit of the field of the detector over the heart to the venous probe, the residue function R(t) and the transport function for 42K+, h(t), can be correlated as described by Zierler (33):
| (5) |
in which H(t) is the cumulative residence time distribution function. This relationship allows us to calculate h(t) from the signal recorded from the venous probe C(t) without knowing the efficiency of the probe or the actual amount injected. We recorded venous and cardiac 42K+ activities for several minutes up to a given time T; at this point, is exactly R(t). Therefore:
| (6) |
| (6a) |
| (6b) |
This provides values of h(t) for t ≤ T. The shape of h(t) beyond this time remains undetermined, even though the area is known.
PST was estimated from the 42K+ washout curve. The emergence function η(t) after an impulse injection can be thought of as the number of particles leaving the system per unit time at time t divided by the number of particles still present in the system at that same time:
| (7) |
| (7a) |
| (7b) |
Explorations of solutions to a capillary-tissue model (1) led us to the same conclusion that Perl (19) had reached—namely, when the total conductance from the cell to the blood PST is low relative to the flow F over a wide range of PST, η(t) is approximated quite well by:
| (8) |
or:
| (8a) |
in which vd (ml ml−1) is the fractional volume of distribution of K+ in the intracellular pool and is essentially a partition coefficient between intracellular K+ and interstitial K+, and Vtiss is the actual intracellular volume in milliliters per gram of heart weight. The above expression ignores the quantity of K+ in the interstitium on the basis that it is small compared to the intracellular pool.
For the intracellular compartment, Conn and Robertson (7), Moulder et al. (17), and Langer and Brady (15) reported values for vd of 31.6–35.0 ml ml−1 of myocardial volume. Langer and Brady (15) reported intracellular K+ concentration ([K]i) to be 90 mmol liter−1 of tissue water (we corrected for extracellular water of about 30 %, giving [K]i of about 130 mmol liter−1 of intracellular water) and Vtiss to be 0.569–0.616 ml g−1 of myocardial weight. These would give the product of vd and Vtiss as approximately 20 ml g−1 of heart.
If the resistances to movement of K+ between the capillary blood and the sarcoplasm are assumed to come from two barriers in series, with negligible resistance in the interstitium (7, 24), then:
| (9) |
in which PScw is the conductance or permeability-surface area product of the cell wall. If both PScap and PST are known:
| (9a) |
RESULTS
Into each of 15 isolated heart preparations 1–10 injections of tracers were made; 36 pairs of curves were obtained for calculation of Emax and PScap. Two pairs of curves from the first experiment are shown in Fig. 1 at high and low flow rates. The paired transport functions have similarly shaped initial portions but different magnitudes for the first several seconds, and both have similar appearance and peak times. The instantaneous fractional extractions (E(t)), calculated by equation 1, typically increased to the maximum (Emax) by about the time of the peak of h(t). A plateau in E(t) was not always seen, as pointed out by Downey and Kirk (9) and Ziegler and Goresky (32). In only two cases did E(t) begin with a high value and decrease to a plateau, a phenomenon that Lassen and Crone (16) attributed to Taylor's molecular diffusion in the conduit vessel.
FIG. 1.
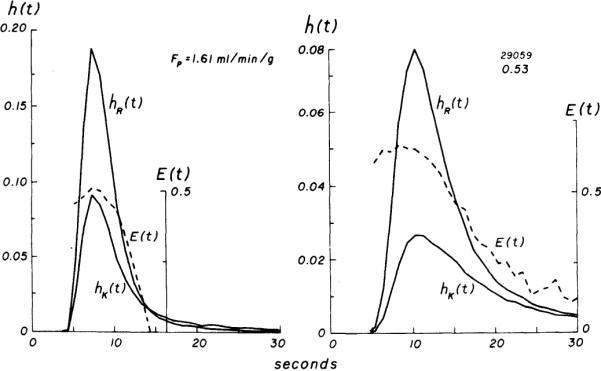
Experiment 29059. Venous concentration vs. time curves for 131I-labeled albumin [hR(t)] and 42K+ [hK(t)], each normalized to fraction of injected dose. At high flow (left), a greater fraction of injected dose is recovered in a shorter period and curves are less temporally dispersed than at low flow (right). Fractional extractions [E(t), broken lines] increase to maximum (Emax) at or slightly before time of peak of hR(t). Emax is higher at low flow and persists for approximately 4 s before decrease in E(t) is seen.
Data from each of the eight hearts used in experiments designed to measure E(t) and PScap at various flows are summarized in Table 1 in order of increasing plasma flow. Serum Na+ and K+ concentrations were normal in these studies. Emax was calculated as the mean of several values of E(t) during the plateau phase. Figure 2 illustrates Emax and PScap (equation 2a) from all experiments plotted as functions of FP. Emax decreased significantly with increasing FP. At FP less than 1.0 ml min−1 g−1, Emax was 0.60 ± 0.06 (mean ± SD, n = 21), whereas at FP greater than 1.0 ml min−1 g−1, Emax was 0.49 ± 0.05 (n = 15). The difference between these means was statistically significant (P < 0.001, unpaired t test).
FIG. 2.

Effect of plasma flow on maximal fractional extraction (Emax, top) and on capillary permeability-surface area product (PScap, bottom) for 42K+ in isolated blood-perfused canine hearts. Data from Table 2 are plotted as open circles. Emax decreased as FP increased. PScap (from equation 2a) increased with increases in FP, but a definite plateau was not seen over range of FP examined.
Estimates of PScap for 42K+ increased as plasma flow was increased (Fig. 2, bottom). This increase was nearly linear at FP of 0.3–1.0 ml min−1 g−1, and the data were closely grouped. Moderate scatter was seen in PScap at FP greater than 1.0 ml min−1 g−1. Mean PScap (equation 2a) at these flows was 1.06 ± 0.18 ml min−1 g−1 (n = 15) and was significantly higher (P < 0.001) than the mean, 0.72 ± 0.20 (n = 21), observed at FP less than 1.0 ml min−1 g−1.
In the second set of experiments with the identical isolated supported heart preparation, one injection of 42KCl and indocyanine green was made into each of seven isolated hearts. The count rates (C*(t)) obtained from the detector over one of these seven hearts are shown in Fig. 3 as a function of time. For this experiment, the linearity of the semilog plot from the 2nd to the 4th h is confirmed by the constancy of η(t) over this period. Data from each of the seven 42K+ efflux experiments are summarized in Table 2. In five hearts, E(t) and Emax were calculated from first-pass indicator-dilution curves recorded by the gamma detector and the densitometer positioned in parallel on the venous line, and these data are included in Fig. 2. In two experiments (12039 and 26089), technical errors resulted in failure to record the indocyanine green curves; therefore, Emax for each of these experiments was taken as the mean value observed at similar flows in the large group of experiments (Table 1 and Fig. 2) and was used for calculation of PScap. The values of Emax and PScap obtained in the five other hearts were similar to those observed in the first set of experiments (Fig. 2, open circles).
FIG. 3.

Washout of 42K+ from isolated heart after single injection of 42KCl into aortic root, monitored by a detector directly over left ventricle. Data are plotted in counts per minute on a linear scale (top) and a semilog scale (middle). When washout becomes monoexponential, emergence function (bottom) reaches a constant minimum.
Residue functions calculated from the 42K+ washout curves from each of the seven hearts are plotted as functions of time after injection in Fig. 4, top. The residue of 42K+ in the heart at any given time was less at higher FP. Furthermore, at high FP the mean fractional escape rate of tracer during the early phase of the washout between 30 and 60 min was nearly twice that observed at low FP (Fig. 4, bottom). In the three experiments at low FP (< 1.0 ml min−1 g−1), η(t) reached a plateau at 60 min after injection when R(t) ranged from 0.30 to 0.10 (two of these experiments were terminated early at 100 and 120 min). In the high-flow studies (FP > 1.0), myocardial 42K+ activity was recorded for 190–225 min, at which time about 1% of the injected 42K+ remained in the heart and the emergence functions were nearly identical to those observed in the low-flow studies.
FIG. 4.

Residue functions (top) representing fraction of injected 42K+ remaining in heart at any time after intra-arterial injection, for each of 7 42K+ efflux studies summarized in Table 2. At any given time, residue of 42K+ was less at higher plasma flows (FP). During early phase of washout, mean fractional escape rate of tracer, emergence function (bottom), between 30 and 60 min after injection ranged from 0.011 to 0.023 with higher values observed at higher FP. After 160 min, emergence functions decreased to less than 0.010, and no differences were seen between studies done at high and low FP.
For each heart, two sets of calculations were made, based on the early and late fractional escape rates for 42K+ (Table 2). In the first set, the average emergence function between 30 and 60 min () in each heart was used to calculate PST and PScw; ranged from 0.011 to 0.023 min−1 with higher values observed at high FP. In the second set of calculations, the average emergence function over the last 30 min of the 42K+ washout () was used to arrive at PST and PScw. Experiments 12039 and 26089 were stopped before 2 h, but 42K+ activity was recorded for at least 190 min in the remaining five hearts. For these five hearts, was 0.008 min−1 and, contrary to , did not show flow dependency.
Because low values of PScap seen at low FP could be related to underestimation of Emax due to early backflux of tracer from tissue to blood, or to the presence of unopened capillary beds causing a decrease in S, we considered that the most realistic values for PScap were those obtained in the four hearts at high FP (> 1.0 ml min−1 g−1) when PScap reached a near plateau. In these four high-flow studies, mean PScw calculated from the early 42K+ efflux was 0.64 ml min−1 g−1, giving a mean PScw:PScap ratio of 0.51. From the late 42K+ washout curves, we derived a mean PScw of 0.19 with a mean PScw:PScap of 0.15.
DISCUSSION
Use of the isolated blood-perfused heart preparation allowed us to make measurements over a wide range of flows and perfusion pressures not easily attainable in the intact animal. Recirculation of tracer could be prevented completely or delayed for several minutes; most of the coronary blood flow was recovered via the pulmonary artery cannula. However, the preparation is not physiologic, being devoid of neural control and not performing external work, and slow weight gains of 5–20% of the initial weight were recorded, presumably partly due to an increase in myocardial water content (17, 27, 28). Also, some small patches of ventricular subendocardial bleeding were often seen at the end of the experiment; this probably was related to the apposition of the walls of the emptied ventricles during contraction. Such extravasation did not seem sufficient to slow the tracer washout substantially.
Protein-bound reference tracers such as indocyanine green and 131I-labeled albumin are distributed like K+, in plasma rather than in whole blood. Therefore, the pertinent flow is FP, the plasma flow per mass of tissue, and this was estimated from the measured blood flow, large-vessel hematocrit value, and heart weight. We used this value to compute PScap. (Erythrocytes have approximately 10–20 % higher velocity than plasma (31) so that the hematocrit of blood contained in the organ is smaller than the large-vessel hematocrit; this can be considered as an effect of having a smaller vascular volume available for erythrocytes but does not affect the estimation of either erythrocyte or plasma flow.) Implicit in our analysis is the assumption that none of the injected 42K+ enters the erythrocytes during the first pass through the capillary bed. Erythrocyte permeability to K+ is low; from the data of Sheppard et al. (25) on canine erythrocytes, the influx at steady state is 0.055 mmol liter−1 of erythrocytes per hour, indicating that, even if the time interval between injection and capillary traversal were as extraordinarily long as 60 s, less than 0.03 % of the injectate could have entered the erythrocytes in blood with a hematocrit value of 50 %.
Nonhomogeneous perfusion may affect the initial values of E(t), which were lower than Emax (Fig. 1). This suggests that the initial portions of the tracer-dilution curves recorded at the venous outflow may have come from regions having a high flow-to-volume ratio (because of shorter capillary length or decreased resistance in precapillary vessels). A similar but smaller effect on E(t) occurs when the intravascular dispersion (axial diffusion) is greater for the penetrating tracer than for the reference tracer (1).
Equation 2 provides a correct estimate of PScap when the fractional extraction represents a loss from blood to tissue via a unidirectional transmembrane flux of tracer. Backdiffusion is greater at low flows and for rapidly permeating tracers and results in a decrease of the apparent fractional extraction Emax and an underestimation of PScap. A reasonably accurate correction factor for backdiffusion has been developed for sodium in similar blood-perfused dog hearts (11), our equation 2a. It should be applicable to potassium extraction as well. We would expect the correction factor (1.136 in equation 2a) to be nearly identical for potassium and for sodium if the ratios (PSK:PSNa) in capillaries in different hearts are the same and if the immediately accessible extravascular volumes are similar. In fact, PSK:PSNa should be theoretically equal to
in which σ is the reflection coefficient and D is the free diffusion coefficient in water. In multiple-tracer experiments, Yipintsoi et al. (29) found that PSK:PSNa was indistinguishable from DK/DNa, as would be expected when the reflection coefficients are small, as confirmed in Grabowski and Bassingthwaighte's (10) experiments with osmotic methods, in which σNa was 0.06. The higher PScap for potassium promotes relatively more early back-flux of potassium relative to sodium. However, this effect is opposed by the slightly larger immediately accessible extravascular space for potassium related to slow entry of potassium into the cell. Therefore, we think that a more detailed analysis would give values little different from those obtained with equation 2a.
Not all of the capillary bed is continuously open; slow periodic opening and closing of capillaries occur. Because Emax is measured over an interval of a few seconds, the resultant PScap reflects only a fraction of the total capillary surface area. However, slow K+ washout occurs not only through open capillaries but also into blood-filled but transiently stagnant capillaries. This suggests that the effective PScap during prolonged K+ washout is higher than that calculated from the first-pass tracer-dilution curves. Thus, we used the high PScap values for calculating PScw from PST.
In our high-flow 42K+ efflux experiments, calculated from the early washout curves was 2–3 times higher than obtained after l–4 h. Because the residue of 42K+ in these hearts decreased to less than 10 % by 60 min, calculation of PScw based on should provide the rnost realistic estimate of mean cell wall 42K+ conductance for the bulk of the exchanging membrane. Lower values for may reflect 42K+ efflux from poorly perfused areas of myocardium, perhaps associated with larger cell size and vd Heterogeneities in PScap and PScw may also result in lower exchange ratios during the late phase of the 42K+ efflux. Our data do not distinguish among these various explanations (alone or in combination) for the observed differences between and .
PScw and PScap are measures of the total K+ conductance across the cell wall and capillary membrane, respectively, per gram of myocardium. Based on in the high-flow studies, mean PScw:PScap was 0.64, indicating that the total K+ conductance across the cell wall was somewhat lower than across the capillary membrane. In order to estimate relative permeability (P) of the two membranes, we corrected for differences in surface area (S) available for exchange. Using Bassingthwaighte and Reuter's (2) value for cell surface area (4,200 cm2/g myocardium) and 500 cm2/g for capillary surface area (5, 22) in mammalian hearts, we calculate that Pcw:Pcap is approximately 0.06 for the bulk of 42K+ exchange reflected in the early washout curve and does not exceed 0.02 during the late phase of the efflux (Table 2).
Conn and Robertson (7) studied 42K+ exchanges across the myocardial cell wall in intact dogs by maintaining a constant arterial 42K+ specific activity and measuring uptake of isotope by the myocardium over a 25-min period. They analyzed their results on the basis of a two-compartment model and suggested that the cell wall provided the major barrier to exchange of 42K+ between capillary blood and the intracellular K+ pool. Their slowest rate constant, 0.016 min−1 (using their λ, with T1/2 of 45 min), is slightly lower than our mean . However, from their K12 and K23, we calculated PScw:PScap ratios of 0.025–0.50, which are considerably lower than the values we observed at all flows.
Langer and Brady (15) studied 42K+ washout from isolated canine papillary muscle perfused with physiologic saline at 24°C. The rate constant for their phase 2, which persisted for up to 3 h, was 0.0139 min−1, similar to our at low FP. In one illustration, a third phase was seen with an exchange rate of 0.004 min−1, a value about half of our . Schreiber (23) also reported a similar value, 0.006 min−1, in working frog hearts. On the other hand, Humphrey and Johnson (13) measured K+ efflux in isolated saline-perfused rabbit hearts and showed connecting data points at 30 and 60 min giving a much higher rate constant, 0.198 min−1.
Ziegler and Goresky (32) recordedI 125-labeled albumin, [14C]sucrose, and 86Rb+ curves from the coronary sinus of the canine heart after simultaneous injection of all three tracers into a blood-perfused left coronary artery. From first-pass tracer-dilution curves obtained over 25–30 s, they arrived at estimates of PScw and PScap (their E and K) for 86Rb+, using a model with resistances localized to capillary and cell membranes. Their PScw values ranged from 0.71 to 1.16 ml min−1 g−1 and were independent of flow, while PScap increased linearly with flow, resulting in lower conductance ratios at high flows. From their data, we calculated PScw:PScap ratios of 1.76–0.77 for FP of 0.44–0.96 ml min−1 g−1. Their values for PScw calculated from early portions of tracer-dilution curves are similar to our PScw derived from the early 42K+ washout.
Sheehan and Renkin (24) analyzed the barriers to blood-tissue transport of 42K+ and 86Rb+, using constant infusion or impulse injection of isotopes into blood perfusing isolated gracilis muscle. Early fractional extractions of 86Rb+ and 42K+, calculated from the first few blood samples, were identical but later steady-state extractions were greater for 42K+. Because 42K+ and 86Rb+ have similar permeabilities, they proposed that the early extraction values reflected diffusional exchanges across the capillary membrane, whereas steady-state extractions were related to diffusion of isotope across the capillary wall and the interstitial space (nondiscriminating barriers) and across the muscle cell membrane (the discriminating barrier). Considering these barriers as two resistances in series, they calculated that the capillary wall provides 70 % of the total resistance to 42K+ exchange between capillary blood and the intracellular K+ pool, with the remaining 30 % localized to the cell wall. However, the capillary surface area in skeletal muscle is about one-seventh that in the heart, which probably accounts for the lower total conductance across capillary wall in skeletal muscle.
In our analysis, we did not take into account resistances at the sarcoplasmic reticulum or within the intracellular or interstitial media themselves. If significant K+ exchanges occur into the sarcoplasmic reticulum, which conducts ions readily to the cell surface at the site of the apposition of sarcoplasmic reticulum and the sarcolemma (6), then the greater surface area available for exchange would give rise to a much lower permeability value for the cell wall. Intracellular resistance, as well as resistance at the intercalated disk, to K+ movement was reported by Weidmann (26) to be much less than that at the surface membrane. This was supported by Kushmerick and Podolsky's (14) findings in frog muscle cells and Hodgkin and Keynes' (12) findings in axoplasm of giant squid axon. Weidmann (26) also reported that a large fraction of the extracellular space is well exchanged in the radial direction for K+, and Downey and Kirk (9) showed rapid equilibration of 42K+ between coronary venous blood and lymph draining the myocardium. Therefore, we think that measurement of PScap from first-pass tracer-dilution curves and of PST from the washout of 42K+ from the myocardium provides data for obtaining reasonable estimates of the 42K+ exchanges across the myocardial cell wall in the intact heart.
Acknowledgments
This investigation was supported in part by Research Grants HL-9719 and RR-7 from the National Institutes of Health, and by grants-in-aid from Control Data Corporation and the American Heart Association (69–1014).
Footnotes
Present address of T. Yipintsoi: Dept. of Medicine and Physiology, Albert Einstein College of Medicine, Bronx, N. Y.
REFERENCES
- 1.Bassingthwaighte JB. A concurrent flow model for extraction during transcapillary passage. Circulation Res. 1974;35:483–503. doi: 10.1161/01.res.35.3.483. [DOI] [PMC free article] [PubMed] [Google Scholar]
- 2.Bassingthwaighte JB, Reuter H. Calcium movements and excitation-contraction coupling in cardiac cells. In: De Mello WC, editor. Electrical Phenomena in the Heart. Academic; New York: 1972. pp. 353–395. [Google Scholar]
- 3.Bassingthwaighte JB, Strandell T, Donald DE. Estimation of coronary blood flow by washout of diffusible indicators. Circulation Res. 1968;23:259–278. doi: 10.1161/01.res.23.2.259. [DOI] [PMC free article] [PubMed] [Google Scholar]
- 4.Bassingthwaighte JB, Yipintsoi T. The emergence function: effects of flow and capillary-tissue exchange in the heart. In: Crone C, Lassen NA, editors. Capillary Permeability. Munksgaard; Copenhagen: 1970. pp. 239–252. [Google Scholar]
- 5.Bassingthwaighte JB, Yipintsoi T, Harvey RB. Microvasculature of the dog left ventricular myocardium. Microvascular Res. 1974;7:229–249. doi: 10.1016/0026-2862(74)90008-9. [DOI] [PMC free article] [PubMed] [Google Scholar]
- 6.Birks RI, Davey DF. Osmotic responses demonstrating the extracellular character of the sarcoplasmic reticulum. J. Physiol., London. 1969;202:171–l 88. doi: 10.1113/jphysiol.1969.sp008802. [DOI] [PMC free article] [PubMed] [Google Scholar]
- 7.Conn HL, Jr., Robertson JS. Kinetics of potassium transfer in the left ventricle of the intact dog. Am. J. Physiol. 1955;181:319–324. doi: 10.1152/ajplegacy.1955.181.2.319. [DOI] [PubMed] [Google Scholar]
- 8.Crone C. The permeability of capillaries in various organs as determined by use of the “indicator diffusion” method. Acta Physiol. Stand. 1963;58:292–305. doi: 10.1111/j.1748-1716.1963.tb02652.x. [DOI] [PubMed] [Google Scholar]
- 9.Downey HF, Kirk ES. Coronary lymph: specific activities in interstitial fluid during uptake of 42K. Am. J. Physiol. 1968;215:1177–1182. doi: 10.1152/ajplegacy.1968.215.5.1177. [DOI] [PubMed] [Google Scholar]
- 10.Grabowski EF, Bassingthwaighte JB. A 3-species, 3-component model for osmotic transients in myocardium (Abstract) Physiologist. 1973;16:328. [Google Scholar]
- 11.Guller B, Yipintsoi T, Orvis AL, Bassingthwaighte JB. Myocardial sodium extraction at varied coronary flows in the dog: estimation of capillary permeability by residue and outflow detection. Circulation Res. doi: 10.1161/01.res.37.3.359. In press. [DOI] [PMC free article] [PubMed] [Google Scholar]
- 12.Hodgkin AL, Keynes RD. The mobility and diffusion coefficient of potassium in giant axons from Sepia. J. Physiol., London. 1953;119:513–528. doi: 10.1113/jphysiol.1953.sp004863. [DOI] [PMC free article] [PubMed] [Google Scholar]
- 13.Humphrey EW, Johnson JA. Potassium flux in the isolated perfused rabbit heart. Am. J. Physiol. 1960;198:1217–1222. doi: 10.1152/ajplegacy.1960.198.6.1217. [DOI] [PubMed] [Google Scholar]
- 14.Kushmerick MJ, Podolsky RJ. Ionic mobility in muscle cells. Science. 1969;166:1297–1298. doi: 10.1126/science.166.3910.1297. [DOI] [PubMed] [Google Scholar]
- 15.Langer GA, Brady AJ. Potassium in dog ventricular muscle: kinetic studies of distribution and effects of varying frequency of contraction and potassium concentration of perfusate. Circulation Res. 1966;18:164–177. [Google Scholar]
- 16.Lassen NA, Crone C. The extraction fraction of a capillary bed to hydrophilic molecules: theoretical considerations regarding the single injection technique with a discussion of the role of diffusion between laminar streams (Taylor's effect) In: Crone C, Lassen NA, editors. Capillary Permeability. Munksgaard; Copenhagen: 1970. pp. 48–59. [Google Scholar]
- 17.Moulder PV, Eichelberger L, Rams JJ, Greenburg AG. Water, nitrogen. and electrolyte content of right and left ventricular walls and interventricular septum of normal canine hearts. Circulation Res. 1966;19:662–667. doi: 10.1161/01.res.19.3.662. [DOI] [PubMed] [Google Scholar]
- 18.Naor P, Shinnar R. Representation and evaluation of residence time distributions. Ind. Eng. Chem. Fundamentals. 1963;2:278–286. [Google Scholar]
- 19.Perl W. An interpolation model for evaluating permeability from indicator dilution curves. In: Crone C, Lassen NA, editors. Capillary Permeability. Munksgaard; Copenhagen: 1970. pp. 185–201. [Google Scholar]
- 20.Renkin EM. Transport of potassium-42 from blood to tissue in isolated mammalian skeletal muscles. Am. J. Physiol. 1959;197:1205–1210. doi: 10.1152/ajplegacy.1959.197.6.1205. [DOI] [PubMed] [Google Scholar]
- 21.Sangren WC, Sheppard CW. A mathematical derivation of the exchange of a labeled substance between a liquid flowing in a vessel and an external compartment. Bull. Math. Biophys. 1953;15:387–394. [Google Scholar]
- 22.Schafer DE, Johnson JA. Permeability of mammalian heart capillaries to sucrose and inulin. Am. J. Physiol. 1964;206:985–991. doi: 10.1152/ajplegacy.1964.206.5.985. [DOI] [PubMed] [Google Scholar]
- 23.Schreiber SS. Potassium and sodium exchange in the working frog heart: effects of overwork, external concentrations of potassium and ouabain. Am. J. Physiol. 1956;185:337–347. doi: 10.1152/ajplegacy.1956.185.2.337. [DOI] [PubMed] [Google Scholar]
- 24.Sheehan RM, Renkin EM. Capillary, interstitial, and cell membrane barriers to blood-tissue transport of potassium and rubidium in mammalian skeletal muscle. Circulation Res. 1972;30:588–607. doi: 10.1161/01.res.30.5.588. [DOI] [PubMed] [Google Scholar]
- 25.Sheppard CW, Martin WR, Beyl G. Cation exchange between cells and plasma of mammalian blood. II. Sodium and potassium exchange in the sheep, dog, cow, and man and the effect of varying the plasma potassium concentration. J. Gen. Physiol. 1951;34:41l–429. doi: 10.1085/jgp.34.4.411. [DOI] [PMC free article] [PubMed] [Google Scholar]
- 26.Weidmann S. The diffusion of radiopotassium across intercalated disks of mammalian cardiac muscle. J. Physiol., London. 1966;187:323–342. doi: 10.1113/jphysiol.1966.sp008092. [DOI] [PMC free article] [PubMed] [Google Scholar]
- 27.Yipintsoi T, Bassingthwaighte JB. Circulatory transport of iodoantipyrine and water in the isolated dog heart. Circulation Res. 1970;27:461–477. doi: 10.1161/01.res.27.3.461. [DOI] [PMC free article] [PubMed] [Google Scholar]
- 28.Yipintsoi T, Scanlon PD, Bassingthwaighte JB. Density and water content of dog ventricular myocardium. Proc. Sot. Exptl. Biol. Med. 1972;141:1032–1035. doi: 10.3181/00379727-141-36927. [DOI] [PMC free article] [PubMed] [Google Scholar]
- 29.Yipintsoi T, Tancredi R, Richmond D, Bassingthwaighte JB. Myocardial extractions of sucrose, glucose, and potassium. In: Crone C, Lassen NA, editors. Capillary Permeability. Munksgaard; Copenhagen: 1970. pp. 153–156. [Google Scholar]
- 30.Yudilevich D, Martin de Julián P. Potassium, sodium, and iodide transcapillary exchange in the dog heart. Am. J. Physiol. 1965;208:959–967. doi: 10.1152/ajplegacy.1965.208.5.959. [DOI] [PubMed] [Google Scholar]
- 31.Ziegler WH, Goresky CA. Transcapillary exchange in the working left ventricle of the dog. Circulation Res. 1971;29:18l–207. doi: 10.1161/01.res.29.2.181. [DOI] [PubMed] [Google Scholar]
- 32.Ziegler WH, Goresky CA. Kinetics of rubidium uptake in the working dog heart. Circulation Res. 1971;29:208–220. doi: 10.1161/01.res.29.2.208. [DOI] [PubMed] [Google Scholar]
- 33.Zierler KL. Theory of use of indicators to measure blood flow and extracellular volume and calculation of transcapillary movement of tracers. Circulation Res. 1963;12:464–471. [Google Scholar]