

Abstract
We explored the neural basis of spoken language deficits in children with reading difficulty, specifically focusing on the role of orthography during spoken language processing. We used functional magnetic resonance imaging (fMRI) to examine differences in brain activation between children with reading difficulties (aged 9-to-15 years) and age-matched children with typical achievement during an auditory rhyming task. Both groups showed activation in bilateral superior temporal gyri (BA 42, 22), a region associated with phonological processing, with no significant between-groups differences. Interestingly, typically achieving children, but not children with reading difficulties, showed activation of left fusiform cortex (BA 37), a region implicated in orthographic processing. Furthermore, this activation was significantly greater for typically achieving children compared to those with reading difficulties. These findings suggest that typical children automatically activate orthographic representations during spoken language processing, while those with reading difficulties do not. Follow-up analyses revealed that the intensity of the activation in the fusiform gyrus was associated with significantly stronger behavioral conflict effects in typically achieving children only (i.e., longer latencies to rhyming pairs with orthographically dissimilar endings than to those with identical orthographic endings; jazz-has vs. cat-hat). Finally, for reading disabled children, a positive correlation between left fusiform activation and non-word reading was observed, such that greater access to orthography was related to decoding ability. Taken together, the results suggest the integration of orthographic and phonological processing are directly related to reading ability.
Keywords: Phonology, Orthography, Dyslexia, fMRI, Language Deficits, Spoken Word Processing
Reading is a complex task spanning several levels of processing. Both orthography and phonology are central to word reading, which involves translating print into sound. Importantly, phonological abilities have been crucially linked to reading skill, such that phonology has long been considered a core deficit in reading disability (Bradley & Bryant, 1983; Harm & Seidenberg, 2001; Leonard, Eckert, Lomnardino, Oakland, Kranzler, Mohr, King & Freeman, 2001; Pugh, Mencl, Jenner, Katz, Frost, Lee, et al., 2000; Stanovich, 1988). Indeed, the phonological deficit hypothesis holds that reading difficulties arise as a result of impairments in processing and/or representing phonemes. That is, that underspecified phoneme representations lead to poor development of the grapheme-phoneme correspondences that are essential to reading (Snowling, 1998). Orthographic deficits have also been suggested in reading disability (Badian, 2005; Meyler & Breznitz, 2003); however, the precise basis of such deficits is far from clear. Critically, given that reading involves making connections between orthographic and phonological representations (Foorman, 1994), it may be that the processes mitigating the integration of these two kinds of representations are related to reading failure (Booth, MacWhinney, Thulborn, Sacco, Voyvodic & Feldman, 1999; Booth, Perfetti, MacWhinney & Hunt, 2000; Plaut & Booth, 2000). Thus, in addition to separately investigating deficits in phonological and orthographic processes in individuals with reading difficulties, there is a need to examine the interactions between these processes.
It is clear that phonology plays a key role in reading, since, as noted above, this process involves relating print to sound. However, the role of orthography in spoken word processing is not obvious – and is far less understood. Despite this opacity, several studies have suggested that orthography does in fact play a distinct role in auditory word processing. For instance, orthographic intrusion has been observed during tasks such as phoneme deletion (Landerl, Frith, & Wimmer, 1996), pseudohomophone priming (Taft, Castles, Davis, Lazendic & Nguyen-Hoan, 2008), and spoken word recognition (Perre, Midgley, & Ziegler, 2009; Zeigler, Muneaux, & Grainger, 2003; Ziegler & Muneaux, 2007). As well, although irrelevant for making auditory rhyme judgments, the orthographic endings of words have been found to influence performance on such rhyme decisions in both adults and children (adults: Donnenwerth-Nolan, Tanenhaus & Seidenberg, 1981; Kramer & Donchin, 1987; Rugg & Barrett, 1987; Seidenberg & Tanenhaus, 1979; and children: Cone, Burman, Bitan, Bolger & Booth, 2008). Interestingly, given that tasks such as auditory rhyming only require processing in the phonological domain; the findings suggest that orthographic representations are accessed involuntarily during phonological processing. Furthermore, it appears that this influence of orthography on phonology occurs automatically during the time course of processing, and is not merely a consequence of making a response (e.g., Peereman, Dufour, & Burt, 2009; Perre & Ziegler, 2008; Pattamadilok, Perre, Dufau, & Ziegler, 2009). Further evidence for this comes from a number of studies by Ziegler and colleagues, who have revealed orthographic consistency effects during spoken word processing. Moreover, using event related potentials [ERPs] they found that the timing of this effect differed based on where in the word the orthographic inconsistency took place (i.e., early vs. late), providing direct evidence for the on-line integration of orthographic and phonological processes in typical individuals.
With the understanding that orthographic and phonological processes interact during spoken word processing, a handful of studies have examined whether this integration is impaired in dyslexia; however, these studies have had mixed results. In some studies, when compared to controls, children with dyslexia showed greater orthographic interference effects (e.g., McPherson, Ackerman & Dykman, 1997; Rack, 1985), while others found the opposite: reduced orthographic interference in dyslexic children compared to controls (e.g., Zecker, 1991). These conflicting findings may be attributable in part to age differences in the participants of these studies; however, further research is required to elucidate whether, or under what conditions, children with dyslexia access orthographic representations during phonological processing.
Neuroimaging methods like functional magnetic resonance imaging [fMRI] can provide substantial insight into our understanding of reading development and reading difficulties. Indeed, over a decade of neuroimaging research has provided considerable understanding of the neurocognitive language network, revealing that activation in certain brain areas is related to processing certain kinds of representations. For instance, the left fusiform gyrus (BA 37) has been linked to visuo-orthographic processing. Furthermore, some researchers have proposed that within this area of the left lateral occipital temporal cortex is a region of perceptual expertise for visual word recognition (c.f., the visual word form area, VWFA, see McCandliss, Cohen, & Dehaene, 2003 for a review). The fusiform gyrus becomes increasingly attuned to processing visual word forms over development, and that more robust activation in this region is associated with better reading skills (Shaywitz, Shaywitz, Pugh, Mencl, Fulbright, Skudlarski et al., 2002). Another area of the language network, the posterior superior temporal gyrus, Wernicke’s area, BA 22, has been found to be related to auditory-phonological processing, Démonet, Chollet, Ramsay, et al., 1992; Mesulam, 1998). This area is sensitive to processing auditory phonological information, but not other auditory inputs like tones (Démonet et al., 1992), such that like the fusiform gyrus, this region is selective in the type of information it processes. Of relevance to the present discussion, this selectivity is not always modality specific. That is, during visual word reading, phonological processing is also marked by activity in the superior temporal gyrus (Booth, Burman, Meyer, Gitelman, Parrish, & Mesulam, 2002); and during auditory word processing orthographic intrusion is marked by activity in the fusiform gyrus (i.e., for auditory word rhyming, Cone et al., 2008).
Neuroimaging studies of dyslexia have shown disruptions in brain activation in dyslexia related to these processes and brain systems. However, several different patterns have been observed, with some studies showing disruptions in both phonological and orthographic processing (e.g., Shaywitz, Shaywitz, Pugh, Fulbright, Constable, Mencl et al., 1998; Temple, Poldrack, Salidis, Deutsch, Tallal, Merzenich et al., 2001), while others find deficits in only one of these processes. For instance, only phonological disruptions, as indicated by underactivation of superior temporal gyrus (Shaywitz et al., 2002; Simos, Breier, Fletcher, Foorman, Bergman, Fishbeck et al., 2000), or only orthographic disruptions, as indicated by underactivation of fusiform gyrus (Aylward, Richards, Berninger, Nagy, Field, Grimme, et al., 2003; Cao, Bitan, Chou, Burman, & Booth, 2006). As we noted with respect to the behavioral evidence, given these mixed results, examining how these processes interact might reveal further insight into the neurocognitive underpinnings of reading disorder.
Indeed, some neuroimaging studies have evaluated deficits in the interaction between orthographic and phonological processing in dyslexia (e.g., Eckert, 2004; Lyytinen, Guttorm, Huttunen, Hämäläinen, Leppänen, & Vesterinen, 1995). One approach to this has been to measure neural responses during visual-rhyme judgment, given that both orthographic and phonological representations must be accessed to perform the task (Cao et al., 2006; Hoeft, Hernandez, McMillon, Taylor-Hill, Martindale, Meyler et al., 2006; Simos et al., 2000; Temple et al., 2001; Temple, Deutsch, Poldrack, Miller, Tallal, Merzenich et al., 2003). While these studies have provided valuable insights into deficits underlying dyslexia, since reading is of inherent difficulty for these children, some aspect of the results may be obscured by the nature of their disorder. Therefore, further examination of the degree to which phonological and orthographic processes interact in these children in the auditory modality, promises to offer further evidence regarding the specific nature of their impairment.
The Present Study
The present study fMRI study employed an auditory rhyme decision task with an orthographic manipulation in order to investigate the role of orthography during phonological processing in children with reading difficulties. We included both a phonological manipulation (rhyming or not rhyming) and an orthographic manipulation, for which the endings of each pair of words were either conflicting (i.e., pint-mint, jazz-has) or non-conflicting (i.e., gate-hate, press-list; see Table 1 for examples of all stimulus conditions). If dyslexia is characterized by primary deficits in phonological processing, we would expect differences in activation between typically achieving children and those with reading difficulties in left superior temporal gyrus. However, if children with dyslexia have deficits in the integration of orthographic and phonological representations, we would expect group differences in activation in left fusiform gyrus. Moreover, if activation in left fusiform gyrus during spoken language processing was systematically related to behavioral performance or reading skill this would provide direct evidence of the importance of this region in language processing.
Table 1.
Group mean scaled scores and standard deviations (in parentheses) for standardized tests of achievement for the reading difficulty (RD) and typically achieving (TA) group.
| Standardized Measure | RD | TA |
|---|---|---|
| Verbal IQ (WASI) ** | 96 (12) | 108 (10) |
| Performance IQ (WASI) ** | 96 (14) | 110 (10) |
| Full-Scale IQ (WASI) ** | 95 (14) | 110 (10) |
| Word Identification (WJ-III) *** | 81 (16) | 109 (10) |
| Word Attack (WJ-III)*** | 79 (12) | 107 (9) |
| Sight Word Efficiency (TOWRE) *** | 80 (11) | 105 (8) |
| Phonetic Decoding Efficiency (TOWRE) *** | 76 (13) | 102 (13) |
| Average of four reading tests *** | 79 (12) | 105 (8) |
| Phonemic Awareness Composite (CTOPP) *** | 79 (10) | 99 (13) |
p ≤ .01,
p ≤ .001, two-tailed.
WASI: Wechsler Abbreviated Intelligence Scale; WJ-III: Woodcock Johnson Tests of Achievement – III; TOWRE: Test of Word Reading Efficiency; CTOPP: Comprehensive Test of Phonological Processing.
Importantly, activation in the fusiform gyrus during this spoken word rhyming task is suggestive of the automatic activation of orthographic representations during phonological processing. Because of this, we were also interested in evaluating individual differences in this activity based on specific skill measures and task conditions. First, because nonword reading is one of the constructs most consistently demonstrating differences between typically achieving children and those with reading difficulties (e.g., Griffiths & Snowling, 2002; Rack, Snowling, & Olson, 1992; Ziegler, Perry, Ma-Wyatt, Ladner, & Schulte-Körne, 2003), we conducted analyses to explore the relationship between nonword reading ability and fusiform activity. Next, the contrast between conflicting and non-conflicting conditions provides an additional approach to examining how orthography interferes with rhyme judgment. We examined the effect of conflict between orthographic and phonological information by comparing the conflicting versus non-conflicting conditions for the rhyming and for the non-rhyming word pairs separately, comparing conflict between conditions with similar response characteristics (i.e., “yes” or “no” rhyme decision). Given that any fusiform activation during auditory rhyming is suggestive of integration, how individuals perform on these conditions relative to each other (conflicting versus non-conflicting) should provide further insight into the interaction between phonological and orthographic representations.
Results
Behavioral Results
Accuracy and reaction time for typically achieving (TA) children and those with reading difficulties (RD; see Table 2 for standardized test scores) on the lexical (i.e., word) and null trials are reported in Table 3. We calculated a 2 group (TA, RD) x 4 lexical conditions (O+P+, O+P-, O-P+, O-P-) repeated measures ANOVA separately for accuracy and reaction time. Overall, children with RD were significantly less accurate and marginally slower at rhyme judgments than TA children (F(1,22) = 8.64, p < .01, and F(1,22) = 3.52, p < .10, respectively). There was also a significant main effect of condition for accuracy but not for reaction time (F(1,22) = 4.47, p < .05, and F(1,22) = 0.52, ns). However, there was not a significant interaction between group and condition for accuracy or reaction time (F(3,20) = 0.34, ns, F(3,20) = 0.04, ns). Follow-up paired t-tests of the main effect of condition in accuracy indicated a significant accuracy difference (Bonferroni corrected for six comparisons, p < 0.002), only between the O+P- and O-P- conditions, with lower accuracy in the conflicting O+P- condition, and additional marginally significant differences (p < 0.05) between the O+P- condition and each of the remaining two conditions, O+P+ and O-P+. The lack of a significant interaction between group and condition indicated that the two groups did not differ significantly in the behavioral conflict effect (i.e., neither on O+P- vs. O-P- for “no” responses, nor on O-P+ vs. O+P+ for “yes” responses).
Table 2.
Lexical rhyme conditions.
| Similar Orthography | Dissimilar Orthography | |
|---|---|---|
| Similar Phonology (Rhyming) | O+P+ gate - hate | * O-P+ jazz - has |
| Dissimilar Phonology (Non-rhyming) | * O+P- pint - mint | O-P- press - list |
Note.
denotes conflicting conditions, in which phonological information (whether or not the two words rhyme) conflicts with orthographic information (whether or not the two words are spelled the same from the first vowel on).
Table 3.
Mean accuracy (proportion), reaction time (ms) and their standard deviations (in parentheses) for each group on each lexical condition, average of all lexical conditions and null events.
| Conflicting | Non-Conflicting | All Lexical | Null | ||||
|---|---|---|---|---|---|---|---|
| O-P+ | O+P- | O+P+ | O-P- | ||||
| Reading Difficulties (RD) | Accuracy | .74 (.19) | .68 (.20) | .75 (.21) | .76 (.18) | .73 (.15) | .82 (.17) |
| RT | 1639 (265) | 1670 (389) | 1638 (278) | 1668 (317) | 1654 (288) | 1537 (376) | |
| Typically Achieving (TA) | Accuracy | .92 (.10) | .78 (.19) | .94 (.07) | .89 (.13) | .88 (.09) | .94 (.11) |
| RT | 1437 (294) | 1459 (221) | 1425 (237) | 1480 (264) | 1450 (241) | 1379 (295) | |
Brain Activation
See Table 4 for a description of both the location and intensity of activation for the TA and RD groups. Contrasts between conditions for each subject were performed at the first level, and second level analyses to explore between-group differences were carried out using two-sample t-tests. Between-group differences in activation were examined using a mask of the union of the activation for each of the groups on the rhyming task at a lenient threshold (p < 0.01). Areas of activation reported for all analyses were significant at the voxel level using FDR correction (see Table 4 for exact p-values for each area), with a minimum cluster size of 15 voxels. For each group, the comparison of all lexical conditions versus null revealed activation in bilateral superior/middle temporal gyri (see Figure 1 and Table 4). This activation extended into left supramarginal gyrus in the TA group and into right insula and left inferior parietal lobule in the RD group. Medial frontal activation was also found in both groups, falling in medial frontal gyrus in the TA group and cingulate gyrus in the RD group. Only in the TA group was additional significant activation found in left fusiform gyrus. The only significant group difference in activation between the RD and TA groups for the contrast of the four lexical conditions versus null was greater activation in the TA group than the RD group in left fusiform/ inferior temporal gyrus (see Figure 3). Examination of conflict effects for the rhyming conditions (O-P+ vs. O+P+) and the non-rhyming conditions (O+P- vs. O-P-) revealed no significant activation in either group. There were also no significant group differences in either of the conflicting versus non-conflicting contrasts (O+P- vs. O-P-, or O-P+ vs. O+P+).
Table 4.
Regions of activation for the lexical conditions vs. null contrast, separately for the typically-achieving and reading difficulties groups of children.
| Region | Hemisphere | BA | Voxels | p-value* | x | y | z | t-value |
|---|---|---|---|---|---|---|---|---|
| LEXICAL-NULL | ||||||||
| Typically-Achieving Group | ||||||||
| Supramarginal Gyrus | L | 40 | 829 | <.001 | −63 | −24 | 15 | 12.33 |
| Superior/Middle Temporal Gyrus | L | 42, 22, 21 | <.001 | −63 | −27 | 3 | ||
| Superior Temporal Gyrus | L | 22 | <.001 | −54 | −15 | −3 | ||
| Superior Temporal Gyrus/ Heschl’s Gyrus | R | 22, 42, 41 | 734 | <.001 | 66 | −12 | 3 | 10.33 |
| Superior Temporal Gyrus/ Heschl’s Gyrus | R | 42, 41 | <.001 | 60 | −24 | 12 | ||
| Middle Temporal Gyrus | R | 21 | <.001 | 57 | −30 | −3 | ||
| Medial Frontal Gyrus | L/R | 6, 8 | 55 | <.001 | 0 | 12 | 54 | 6.57 |
| Fusiform Gyrus | L | 37 | 16 | <.001 | −48 | −63 | −24 | 5.17 |
| Fusiform Gyrus | L | 37 | <.001 | −48 | −54 | −18 | ||
| Reading Difficulties Group | ||||||||
| Middle Temporal Gyrus | R | 21 | 901 | <.001 | 57 | −12 | −3 | 18.39 |
| Superior Temporal Gyrus/ Heschl’s Gyrus/ Insula | R | 22, 42, 41, 13 | <.001 | 57 | −27 | 6 | ||
| Superior Temporal Gyrus/ Heschl’s Gyrus/ Inferior Parietal Lobule | L | 22, 42, 41, 40 | 770 | <.001 | −60 | −21 | 9 | 9.94 |
| Middle Temporal Gyrus | L | 21 | <.001 | −63 | −12 | −3 | ||
| Superior Temporal Gyrus | L | 42 | <.001 | −66 | −33 | 9 | ||
| Anterior Cingulate Cortex | L | 32 | 31 | <.001 | −6 | 6 | 42 | 5.78 |
| Anterior Cingulate Cortex | R | 32 | <.001 | 3 | 24 | 30 | ||
| Anterior Cingulate Cortex | L | 32 | <.005 | −3 | 18 | 36 | ||
Note. Reported p values are corrected at the voxel level using an FDR correction
For hemisphere, L = left, R = right; BA = Brodmann Area; x, y, z: Montreal Neurological Institute (MNI) coordinates listed only for clusters with volume greater than 15 voxels. All coordinates listed correspond to global maxima within a region (voxels and t-value given) or local maxima within a region (t-value not given).
Figure 1.
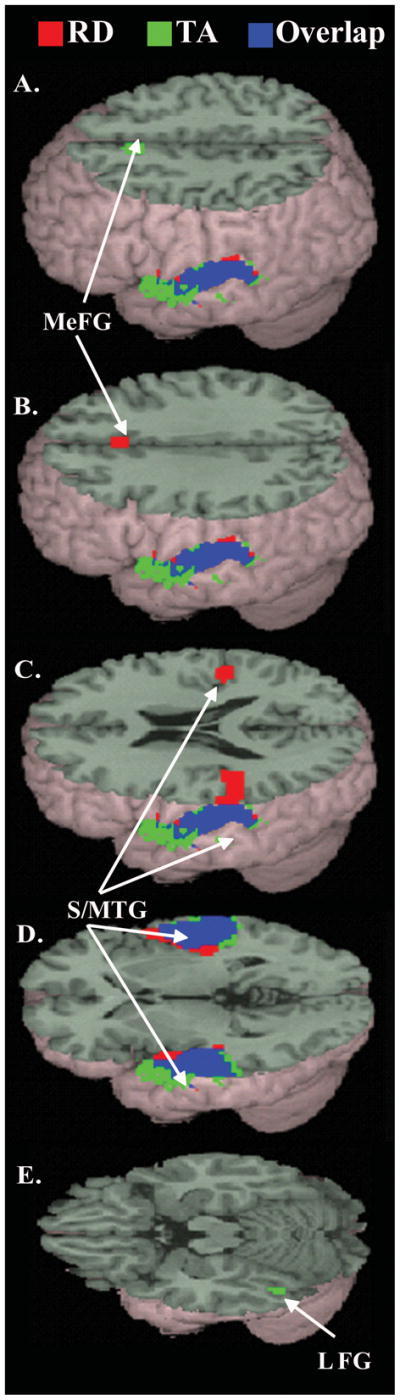
Main effects of the four lexical conditions versus null, within each group. (see Table 4 for coordinates). Activation from the reading difficulty (RD) group in red; for the typically achieving (TA) group in green, and overlap in blue. MeFG = Medial Frontal Gyrus; S/MTG = Superior and Middle Temporal Gyri; L FG = Left Fusiform Gyrus.
Figure 3.

Brain image (Panel A) illustrates TA greater than RD group difference across four lexical conditions versus null in left fusiform/ inferior temporal gyrus (BA 37; x = −48, y = −51, z = −15; voxels = 22; t-value = 5.01). L FG = Left Fusiform Gyrus. Bar graphs (Panels B and C) indicate mean intensity of activation (with standard error bars) for each group (TA in blue, RD in red) in a 6-mm sphere around the above cluster maxima (Panel A), across lexical conditions (Panel B) and for individual lexical conditions (Panel C). Scatter plot (Panel D) illustrates correlation within each group between reaction time conflict score for yes responses (conflicting minus non-conflicting reaction time in rhyming conditions: O+P+ minus O-P+) and activation in a 6-mm sphere around the left fusiform gyrus cluster represented in Panel A. Asterisk indicates a significant correlation in the TA group.
It is important to note that although both groups of children had normal to above normal nonverbal IQ; there were significant group differences on this construct. Thus, we ran additional analyses to investigate any significant role of nonverbal IQ in our findings. First, for analyses in which significant group differences were found, we ran an identical analysis with nonverbal IQ entered in separately as a covarariate. This analysis showed that all of the same regions were significantly active; only the number of voxels activated above-threshold in each of the regions differed between this and the original analysis. Second, we did correlational analyses to explore the relationship between activation in the fusiform and nonverbal IQ scores. Using the extracted beta weights from the fusiform activation observed in our original analyses, we calculated the correlation between IQ scores and activation strength for each group separately and for both groups together on the nonverbal IQ composite, as well as each nonverbal subtask (block design and matrix reasoning). These follow-up analyses revealed that the activity in the fusiform was not correlated with nonverbal IQ (for all analyses, all p-values > 0.24).
Correlations of brain activation in the four lexical conditions vs. null in left fusiform gyrus1 with scores on a standardized measure of nonword reading (WJ-III, Word Attack) revealed that the RD group’s correlation was significantly positive, while the TA group’s correlation failed to reach significance (rRD = 0.66, p = 0.02; rTA = 0.27, p = 0.39; see Figure 2). However, a statistical comparison of the correlation coefficients between the two groups revealed no significant group difference in this relationship (Fischer’s Z = 1.08, p = 0.28).
Figure 2.
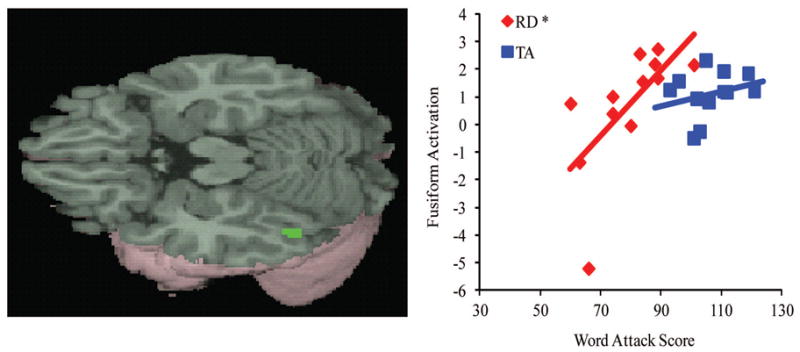
Main effects of across four lexical conditions versus null in the TA group in left fusiform gyrus. Scatter plot illustrates correlation within each group between non-word reading score (from the WJ-III Word Attack subtest) and activation in a 6-mm sphere around this cluster maxima (BA 37; x = −48, y = −63, z = −24). Asterisk indicates a significant correlation in the RD group.
Correlations of brain activation in the four lexical conditions vs. null in left fusiform gyrus2 with reaction time conflict effect scores for the “yes” responses (calculated by subtracting reaction time to the non-conflicting rhyming condition, O+P+, from the conflicting rhyming condition, O-P+) revealed that the TA group’s correlation was significantly positive, while the RD group’s correlation failed to reach significance(see Figure 3, Panel D). A statistical comparison of the correlation coefficients between the two groups revealed that the correlation was significantly stronger in the TA group than in the RD group (rTA = 0.63, p = .03; rRD = −0.25, p = 0.43; Fischer’s Z = 0.21, p = 0.03). There were no significant correlations between activation in the fusiform gyrus and the conflict effect scores on the “no” responses (i.e., non-rhyming trials).
Discussion
The goal of the present study was to evaluate the relationship between orthography and phonology during auditory word processing in typically achieving children and those with reading difficulties. Our investigation of the differences in brain activation between these two groups, revealed two key findings. First, the two groups of children showed similar bilateral activation of the superior temporal gyrus during auditory rhyme judgment, providing no evidence that children with reading difficulties differ in terms of the basic phonological processes subserved by this region (also see Binder et al., 1994). Next, unlike typically achieving children, children with reading disabilities did not show reliable activation of the fusiform gyrus during the auditory rhyming task. Importantly, this finding suggests that while typically achieving children appear to activate orthographic representations automatically and reliably during phonological processing, those with reading difficulties do not.
Orthographic representations appear to be accessed automatically and reliably in typically achieving children during spoken language processing, but not in those with reading difficulties. Comparisons of brain activation during the rhyme decision task revealed neural response in the fusiform gyrus for typically achieving children only, and moreover, that there was a significant difference between the two groups in their activation in this region. Although behavioral measures have been employed to examine orthographic influences in spoken language processing, these have yielded inconsistent findings with respect to children with reading disabilities (e.g., greater vs. smaller consistency effects: McPherson, et al., 1997; Rack 1985; and Zecker, 1991, respectively). Instead, the present study revealed a clear effect where the integration of orthographic and phonological processing is concerned: children with reading difficulties do not show the same automatic access of visual-orthographic representations during auditory phonological processing. This finding both echoes and expands upon a finding that was only briefly discussed in a study by Corina and colleagues (2001); that is, greater activation in the left occipital cortex for controls compared to dyslexic children. Our study was specifically designed to examine this question using an event-related design and a phonological task in which we explicitly manipulated orthography, whereas the Corina et al.’s (2001) finding was incidental, nevertheless suggesting that visual processes occur during auditory word processing. Our study is the first to our knowledge to show that children with reading difficulties less automatically activate brain regions implicated in orthographic representations during spoken language processing.
The finding that the automaticity with which orthographic representations are activated during auditory phonological processing can be interpreted within the framework of both interactive activation models of language processing (which suggest that phonology, orthography, and semantics are all interconnected during language processing, Seidenberg & McClelland, 1989) and the Phonological Deficit Hypothesis of reading disability (Snowling, 1998). That is, children with typical reading develop strong interconnections between phonology and orthography, while children with reading difficulties do not. In children with reading difficulties, deficits in processing and representing phonology are related to the impoverished development of the grapheme-phoneme correspondences that are essential to reading. Without this, the connections between phonology and orthography are not strengthened (or possibly not made), rendering them with limited access to orthography during auditory phonological processing.
It is important to note that the present study used a spoken language task with a phonological (i.e., rhyming) judgment to assess the automaticity with which children with reading difficulties access orthographic information during auditory processing. Although auditory rhyming does not require orthographic analysis, further research is needed to determine whether these effects hold in a spoken word processing task without a phonological judgment. Based on evidence from typically achieving individuals that suggests orthography is activated automatically and on-line during spoken word recognition (e.g., using auditory lexical decision and ERPs, Perre & Ziegler, 2007), as well as the fact that by age 8 or 9 auditory rhyme judgment is easy for children, even for those with reading difficulties (e.g., Desroches, Joanisse, & Robertson, 2006; Swan & Goswami, 1997), we hypothesize that orthographic effects would be similar across a variety of spoken word tasks.
Although, as a group, the children with reading disabilities did not show reliable activation of orthographic representations during phonological processing, the magnitude of the activation in the fusiform gyrus was related to their reading skill. Using correlation, we found a significant relationship between left fusiform activation and nonword reading score (WJ-III Word Attack, a measure of decoding ability) for children with reading difficulties. As nonword reading scores increased, so did activation in the left fusiform gyrus for children with reading difficulties. Of note, a follow up analysis of this correlation removing an outlier value still revealed a significant correlation (that was in fact numerically higher, r = 0.73, p < 0.01 without the outlier vs. r = 0.66, p = 0.02 with the outlier). This relationship failed to reach significance in the typically achieving children; however, there were no significant differences between the groups in their correlation between left fusiform activation and nonword reading. Importantly, our findings revealed that while children with reading difficulties do not appear to automatically activate their orthographic representations during auditory phonological processing; those with higher decoding abilities do in fact show greater recruitment of a brain region associated with orthographic processing. Therefore, increasing automaticity or efficiency in this phono-orthographic mapping process in children with reading difficulties may be associated with both increasing nonword (decoding) skill and increasingly automatic orthographic processing during spoken language tasks (Van der Leij & Van Daal, 1999; Zecker, 1991).
With respect to typically achieving children, the present findings are consistent with findings from past studies revealing orthographic consistency effects during auditory phonological tasks (e.g., Seidenberg & Tanenhaus, 1979; Ziegler et al., 2008), as well as with our own previous finding of activation in the fusiform gyrus during auditory rhyming in a larger group of typically achieving children (Cone et al., 2008). Taken together, the past and present findings suggest that orthographic information is accessed automatically during auditory phonological processing in non-impaired readers, and also that phonological and orthographic information are highly integrated in these individuals.
We further examined the integration of orthographic and phonological processes by exploring the activation associated with the resolution of conflict between phonological and orthographic representations. Neither group of children showed significant differences in the contrast of the conflicting versus the non-conflicting conditions (O+P- vs. O-P- and O-P+ vs. O+P+), with no significant between-group differences being observed. While comparing these contrasts was not informative for the question at hand, subsequent correlational analyses were useful. A positive correlation was found between activation in the fusiform and the behavioral reaction time conflict effect on rhyming trials (O-P+ vs. O+P+) in the typically achieving children only. Not surprisingly, this effect was significantly stronger for typically achieving children compared to those with reading difficulties, who did not show any evidence of such a relationship. These results further emphasize the claim that children with reading difficulty have less automatic or obligatory phono-orthographic mapping (Meyler & Breznitz, 2003; Van der Leij & Van Daal., 1999; Zecker, 1991).
The correlation between activation in the fusiform and the conflict effect in the typically achieving children indicates that as the influence of conflict on reaction times increased (i.e., greater delays in reaction times for conflicting versus non-conflicting word pairs such as jazz-has vs. gate-hate), activation in fusiform gyrus also increased. This indicates a close relationship between behavioral and neural influences of orthographic representations during phonological processing in typically achieving children. Consistent with this, we have previously shown that slower reaction times across all lexical conditions result in greater activation in left fusiform gyrus in older (15-year-olds) as compared to younger (9- to 13-year-olds) typically achieving children (Cone et al., 2008).
Notably, the fusiform activation did not vary across the four different lexical conditions in the typically achieving children (Figure 3, Panel C), suggesting that the relationship between fusiform activation and the behavioral conflict effect are not merely a result of the presence of the phono-orthographic conflict. Instead, activation in the fusiform gyrus increased specifically with the degree to which participants’ reaction times were affected by the presence of this conflict (Figure 3, Panel D). Increased reaction times are suggestive of more effortful processing; therefore, two possible interpretations follow. First, it might be that individuals who activate orthographic representations more automatically during spoken language processing, are more susceptible to having greater behavioral phono-orthographic conflict effects. Alternatively, it is possible that the typically achieving children in the present study who show greater fusiform activation relative to their other typically achieving peers do so because their phono-orthographic mapping is more effortful or inefficient. Such inefficient mapping might result in greater fusiform activation (Bookheimer et al., 2000), as well as in longer reaction times when an orthographic comparison of the two words conflicts with the task-relevant phonological comparison, possibly due in part to a more effortful/inefficient re-mapping to double-check the phonological rhyme comparison (Seidenberg & Tanenhaus, 1979).
In the present discussion we attribute the observed differences in brain activity to differences in reading level; however, given the discrepancy in nonverbal IQ between the two groups of children, an alternate interpretation could also be made. Consider the following: given that lower verbal and nonverbal IQ scores relate to a range of abilities including speed of processing, working memory and executive functioning, it could be that lower IQ abilities impede the development of interconnections between representational systems. Under this account, it might be that the IQ discrepancy between groups, coupled with the phonological deficits in children with reading difficulties, drives the observed between group differences in brain activity. While we cannot discount such an interpretation, we view it as the less likely alternative for several reasons: 1) the findings still hold when additional analyses were performed that partialed for IQ, 2) the activation in the FG was not correlated with IQ for either group on any subtest or composite, and 3) support from a growing body of literature suggesting that nonverbal IQ is often lower in children with reading difficulties, and that IQ is not a significant contributor to their deficits (see Pennington, 2008 for a review; and also D’Angiulli & Sigel, 2003; Dennis, Francis, Cirino, Schachar, Barnes, & Fletcher, 2009; Jimenez, Siegel, O’Shanahan, & Ford, 2009; Stanovich, 1991; Snowling, Gallager, & Frith, 2003; Stuebing, Fletcher, LeDoux, Lyon, Shaywitz & Shaywitz, 2002; Velluntino, Scanlon, & Lyon, 2000).
Finally, with respect to more basic auditory-phonological processes, we did not observe any significant differences between the two groups, as indicated by similar activation in bilateral superior temporal cortex (BA 22; also see Binder et al., 1994). However, it is important to note that the findings of the present study do not negate the presence of such deficits. Given that our stimuli were not designed to assess subtle changes in phonemic variation, but rather larger phonological segments (i.e., rhyme), this study may not have had the sensitivity to discern such deficits. Rather, at least at the level of processing pairs of rhyming and non-rhyming words compared to a null control, children with reading difficulties show no deficits compared to typically achieving controls.
Conclusion
The current study indicates that during spoken language processing, phonological and orthographic processes are more integrated in typically achieving children compared to children with reading difficulties. This is demonstrated by greater fusiform activation in the typically achieving children in the auditorily-presented rhyme decision task. Furthermore, greater activation in this region is associated task difficulty in typically achieving children, and with higher nonword decoding skill in children with reading difficulties. Taken together, the findings suggest that although some aspects of the neural bases of spoken word processing appear to be intact in children with reading difficulties, other aspects of processing, including the integration of phonological and orthographic representations are impaired.
Method
Participants
Twelve TA children (mean age = 11.5, SD = 2.2, range = 8.8 to14.9 years; 8 boys) and twelve children with RD (mean age = 11.4 years, SD = 2.3; range = 8.7 to 14.8 years; 10 boys) participated in the fMRI study. Children were recruited from the Chicago metropolitan area.
Parents of children were given an informal interview to insure that all children met the following inclusionary criteria: (1) native English speakers, (2) right-handedness, (3) normal hearing and normal or corrected-to-normal vision, (4) free of neurological disease or psychiatric disorders, (5) not taking medication affecting the central nervous system, (6) no history of intelligence or oral-language deficits, and (7) no Attention Deficit Hyperactivity Disorder (ADHD). After the interview, informed consent was obtained in accordance with procedures approved by the Institutional Review Board at Northwestern University and Evanston Northwestern Healthcare Research Institute.
Standardized testing was then administered to assess children’s IQ, reading, and language abilities. This included the Wechsler Abbreviated Scale of Intelligence (WASI, Wechsler, 1999) with two verbal subtests (vocabulary, similarity) and two performance subtests (block design, matrix reasoning); measures of word and nonword reading accuracy (Word Identification and Word Attack subtests of the Woodcock Johnson III Tests of Achievement, WJ-III; Woodcock, McGrew & Mather, 2001) and speed (Sight Word Efficiency and Phonetic Decoding Efficiency subtests of the Test of Word Reading Efficiency, TOWRE; Wagner, Torgesen & Rashotte, 1999a); as well as phonological awareness measures from the Comprehensive Test of Phonological Processing (CTOPP, Elision and Blending Words subtests; Wagner, Torgesen & Rashotte, 1999b).
Children with RD had standard scores of 85 or below on at least one of the four reading measures. Each child in this group also met the following group inclusionary criteria: (1) verbal IQ above 80, and (2) average of the four reading measures (word and nonword accuracy and speed) below 95. For all but two of these children, the average reading score fell below 90, with a group range of 57 to 93. The age-matched TA children, none of whom had a history of reading difficulties, met the following group criteria: (1) difference of age with matched RD children equal to or less than four months, (2) verbal IQ above 80, and (3) average of the four reading measures above 95 (ranging from 96 to 124). See Table 1 for each group’s mean standard score (and standard deviation) on each of the standardized tests3.
We compared the two groups on their standardized reading and language performance using a 2 group (RD and TA children) x 2 test (verbal IQ and reading test average) analysis of variance (ANOVA). As expected, we found a significant interaction between group and test (F(1,22) = 9.90, p = 0.005). Follow-up t-tests showed that although children with RD scored lower than TA children on both verbal IQ and the average of reading tests, the difference between the two groups was greater on the average of reading tests (t(22) = 2.79, p = 0.011, and t(22) = 6.31, p < 0.001, respectively).
Rhyme Judgment Task
On each trial, children heard two sequentially presented auditory words, presented binaurally through earphones. The pairs of words either rhymed, or did not rhyme, and children were required to make a rhyme judgment response by pressing one of two keys on a handheld keypad. Participants were instructed to quickly and accurately as possible to respond to all trials, using the right index finger for a yes (rhyme) response and the right middle finger for a no (non-rhyme) response. Throughout the trial, a black fixation-cross remained on the screen to help minimize eye movements. The duration of each word was between 500 and 800 milliseconds (ms) followed by a brief period of silence, with the second word beginning 1000 ms after the onset of the first. A red fixation-cross appeared on the screen 1000 ms after the onset of the second word, indicating the need to make response during. This response interval had a duration of 2400 ms. Word pairs, varying in terms of their orthographic and/or phonological similarity (Table 2), were presented in one of four lexical conditions (24 pairs per condition). Two conditions were non-conflicting, such that the words in each pair had similar orthographic and phonological endings (O+P+: e.g., gate-hate), or had different orthographic and phonological endings (O-P-: e.g., press-list). Two additional conditions were conflicting, such that both words had similar orthographic but different phonological endings (O+P-, e.g., pint-mint), or had different orthographic but similar phonological endings (O-P+, e.g., jazz-has).
All words were monosyllabic, and were matched across conditions for written word frequency in adults and children (Zeno, Ivens, Millard & Duvvuri, 1996) and for adult word frequency for written and spoken language (Baayen, Piepenbrock & Gulikers, 1995). One-way ANOVAs did not reveal significant differences in word frequency across conditions. Although we attempted to match the lexical conditions for word consistency, the limited number of available words and the specific structure of the conditions precluded this possibility. Two measures of word consistency were calculated: phonological and orthographic (Bolger, Hornickel, Cone, Burman & Booth, 2008). ANOVA analyses of phonological or orthographic consistency as dependent variables and lexical condition as the independent variable showed a significant effect of condition (F(3,177) = 35.4, and F(3,177) = 10.9, p < .001, respectively). The highest phonological inconsistency in the O+P- condition and the highest orthographic inconsistency was in the O-P+ condition (see Bolger et al., 2008, for more details related to consistency differences across conditions).
Control trials were included to control for visual processing, motor responses, and extraneous nonlinguistic auditory processing. These control trials were 72 null events for which participant was required to press a button when a black fixation-cross at the center of the visual field turned red. The null event had the same visual stimuli and motor response characteristics as both the lexical task and the perceptual controls, with sequential presentation of black fixation cross followed by a red fixation cross indicating the need to press the yes button on the response box. Two other control conditions were included as part of a larger study, but were not of interest in the current experiment. These included simple perceptual trials (single pure tone stimuli) and complex perceptual trials (three-tone stimuli) where the participant was asked to decide whether two sequentially presented items were the same (see Cone et al., 2008) for further details on the perceptual conditions).
Experimental Procedure
Prior to taking part in the fMRI scanning session, participants were required to complete a practice scan session, in which they were trained in minimizing head movement in front of a computer screen using an infrared tracking device. At this time, they performed one run of the rhyming task in a simulator scanner, in order to make sure they understood the tasks and to acclimatize themselves to the scanner environment. Different stimuli were used in the practice and in the scanning sessions. Scanning took place within a week of the practice session.
MRI Data Acquisition
Participants lay in the scanner with their head position secured with a specially designed vacuum pillow (Bionix, Toledo, OH). An optical response box was placed in the participants’ right hand (Current Designs, Philadelphia, PA). Visual stimuli were projected onto a screen, while participants viewed them via a mirror attached to the inside of the head coil. Participants wore sound attenuating headphones to hear auditory stimuli and minimize the effects of the ambient scanner noise (Resonance Technology, Northridge, CA). The rhyming task was administered in two 8 minute runs, with 108 trials per run. The order of lexical, perceptual and fixation trials was optimized for event-related design using OptSeq (Burock, Woldorff, Rosen & Dale,1998; http://surfer.nmr.mgh.harvard.edu/optseq/), with this order being fixed for all subjects.
Images were acquired using a 1.5 Tesla GE (General Electric) scanner. The BOLD (blood oxygen level dependent) signal was measured using a susceptibility weighted single-shot EPI (echo planar imaging) method. Functional images were interleaved from bottom to top in a whole brain acquisition. The following scan parameters were used: TE = 35 ms, flip angle = 90°, matrix size = 64 × 64, field of view = 24 cm, slice thickness = 5 mm, number of slices = 24; TR = 2000 ms. Each functional run had 240 repetitions. A high resolution, T1 weighted 3D image was acquired (TR = 21 ms, TE = 8 ms, flip angle = 20°, matrix size = 256 × 256, field of view = 22 cm, slice thickness = 1 mm, number of slices = 124), using an identical orientation as the functional images.
Data was analyzed using SPM2 (Statistical Parametric Mapping) (http://www.fil.ion.ucl.ac.uk/spm). Images were spatially realigned to the first volume to correct for head movements. No run had more than 4 mm displacement in any of the x, y or z dimensions. Sinc interpolation was used to minimize timing-errors between slices. Functional images were co-registered with the anatomical image, and normalized to the standard T1 Montreal Neurological Institute (MNI) template volume. The data was smoothed with a 10 mm isotropic Gaussian kernel. Statistical analyses at the first-level were calculated using an event-related design with the four lexical conditions, two perceptual conditions, and the null condition included as conditions of interest. A high pass filter with a cutoff of 128 seconds was applied. Word pairs and perceptual pairs were treated as individual events for analysis and modeled using a canonical hemodynamic response function (HRF).
In order to examine activation associated with linguistic processing, we first created a mask to include cortical areas involved in the rhyme task. First, contrast maps were generated for each group, based on the subtraction of activation of the group’s average lexical condition versus null at a lenient threshold (p = 0.01, uncorrected). Next, the contrast map for the two groups were added together to create a map of the union of the activation for both groups. Finally, this mask was applied to all analyses to determine significant within-group activation and significant activation differences between groups. One-sample t-tests were used to examine main effects within each group, and two-sample t-tests to examine group differences for each of the following contrasts: (1) the average of the lexical conditions versus null, (2) the O+P- versus the O-P- conditions (conflicting versus non-conflicting for the non-rhyming pairs), and (3) the O-P+ versus the O+P+ conditions (conflicting versus non-conflicting for the rhyming pairs). We examined the effect of conflict between orthographic and phonological information by comparing the conflicting versus non-conflicting conditions for the rhyming and for the non-rhyming word pairs separately, such that this effect was evaluated by comparing conflict between conditions with similar response characteristics (i.e., “yes” or “no” rhyme decision). Areas of activation reported for all analyses were significant at p < 0.001, uncorrected, at the voxel level, with a minimum cluster size of 15 voxels.
Where between-group analyses were significant, we repeated the analyses using performance IQ and age as covariates (separately). These additional analyses were performed in order to ensure that observed group differences were not due to differences in age or nonverbal intelligence. We also further explored how the neural activation in regions associated with orthographic processing (i.e., left fusiform gyrus) might be related to performance and/or skill, such that where we observed significant within-group effects or between-group differences, we extracted individual contrast values of activation from this region in order to perform further analyses. We performed within-group correlations between these values and behavioral data, including nonword decoding (WJ-III Word Attack subtest) score and the conflict effect (reaction time to conflicting minus non-conflicting conditions, separately for “yes” and “no” responses). We then compared group differences in these correlation coefficients statistically, using z-tests.
Acknowledgments
The authors would like to acknowledge the support of grants from the National Institute of Child Health and Human Development (HD042049) to James R. Booth, and salary support from the Natural Sciences and Engineering Research Council of Canada (Postdoctoral Fellowship) to Amy S. Desroches. We thank Caroline Na for her assistance in the analysis of the fMRI data.
Footnotes
Contrast values extracted from individuals, separately within each group, around the maxima coordinate of significant activation in the TA group only
Contrast values extracted from individuals, separately within each group, around the maxima coordinate of significant difference between the two groups
Standardized tests have a population mean of 100 and a standard deviation of 15.
Publisher's Disclaimer: This is a PDF file of an unedited manuscript that has been accepted for publication. As a service to our customers we are providing this early version of the manuscript. The manuscript will undergo copyediting, typesetting, and review of the resulting proof before it is published in its final citable form. Please note that during the production process errors may be discovered which could affect the content, and all legal disclaimers that apply to the journal pertain.
References
- Aylward EH, Richards TL, Berninger VW, Nagy WE, Field KM, Grimme AC, et al. Instructional treatment associated with changes in brain activation in children with dyslexia. Neurology. 2003;61(2):212–219. doi: 10.1212/01.wnl.0000068363.05974.64. [DOI] [PubMed] [Google Scholar]
- Baayen RH, Piepenbrock R, Gulikers L. The CELEX Lexical Database [CD-ROM]. Version Release 2. Philadelphia, PA: Linguistic Data Consortium, University of Pennsylvania; 1995. [Google Scholar]
- Binder JR, Rao SM, Hammerer TA, Yetkin FZ, Jesmanowicz A, Bandettini PA, et al. Functional magnetic resonance imaging of human auditory cortex. Annals of Neurology. 1994;35(6):662–72. doi: 10.1002/ana.410350606. [DOI] [PubMed] [Google Scholar]
- Bolger DJ, Hornickel J, Cone NE, Burman DD, Booth JR. Neural correlates of orthographic and phonological consistency effects in children. Human Brain Mapping. 2007;29(12):1416–29. doi: 10.1002/hbm.20476. [DOI] [PMC free article] [PubMed] [Google Scholar]
- Bookheimer SY, Strojwas MH, Cohen MS, Saunders AM, Pericak-Vance MA, Mazziotta JC, et al. Patterns of brain activation in people at risk for Alzheimer's disease. New England Journal of Medicine. 2000;343(7):450–6. doi: 10.1056/NEJM200008173430701. [DOI] [PMC free article] [PubMed] [Google Scholar]
- Booth JR, Macwhinney B, Thulborn K, Sacco K, Voyvodic J, Feldman H. Functional organization of activation patterns in children: Whole brain fMRI imaging during three different cognitive tasks. Progress in Neuro-Psychopharmacology & Biological Psychiatry. 1999;23(4):669–682. doi: 10.1016/s0278-5846(99)00025-1. [DOI] [PMC free article] [PubMed] [Google Scholar]
- Booth JR, Perfetti C, MacWhinney B, Hunt S. The association of rapid temporal perception with orthographic and phonological processing in children and adults with reading impairment. Scientific Studies of Reading. 2000;4(2):101–132. [Google Scholar]
- Booth JR, Burman DD, Meyer JF, Gitelman DR, Parrish TB, Mesulam MM. Functional anatomy of intra- and cross-modal lexical tasks. Neuroimage. 2002;16:7–22. doi: 10.1006/nimg.2002.1081. [DOI] [PubMed] [Google Scholar]
- Bradley L, Bryant PE. Categorizing sounds and learning to read-a causal connection. Nature. 1983;301(3):419–421. [Google Scholar]
- Burock MA, Buckner RL, Woldorff MG, Rosen BR, Dale AM. Randomized event-related experimental designs allow for extremely rapid presentation rates using functional MRI. NeuroReport. 1998;9:3735–3739. doi: 10.1097/00001756-199811160-00030. [DOI] [PubMed] [Google Scholar]
- Cao F, Bitan T, Chou TL, Burman DD, Booth JR. Deficient orthographic and phonological representations in children with dyslexia revealed by brain activation patterns. Journal of Child Psychology and Psychiatry. 2006;47(10):1041–1050. doi: 10.1111/j.1469-7610.2006.01684.x. [DOI] [PMC free article] [PubMed] [Google Scholar]
- Cohen L, Jobert A, Le Bihan D, Dehaene S. Distinct unimodal and multimodal regions for word processing in the left temporal cortex. Neuroimage. 2004;23(4):1256–70. doi: 10.1016/j.neuroimage.2004.07.052. [DOI] [PubMed] [Google Scholar]
- Cone NE, Burman DD, Bitan T, Bolger DJ, Booth JR. Developmental changes in brain regions involved in phonological and orthographic processing during spoken language processing. Neuroimage. 2008;41(2):623–635. doi: 10.1016/j.neuroimage.2008.02.055. [DOI] [PMC free article] [PubMed] [Google Scholar]
- Corina D, Richards T, Serafini S, Richards A, Steury K, Abbott R, et al. fMRI auditory language differences between dyslexic and able reading children. Neuroreport. 2001;12(6):1195–1201. doi: 10.1097/00001756-200105080-00029. [DOI] [PubMed] [Google Scholar]
- D’Angiulli A, Siegel LS. Cognitive functioning as measured by the WISC-R: Do children with learning disabilites have distinctive patterns of performance? Journal of Learning Disabilites. 2003;36:48–58. doi: 10.1177/00222194030360010601. [DOI] [PubMed] [Google Scholar]
- Démonet JF, Chollet F, Ramsay S, Cardebat D, Nespoulous JL, Wise R, Rascol A, Frackowiack R. The anatomy of phonological and semantic procesing in normal subjects. Brain. 1992;115:1173–1768. doi: 10.1093/brain/115.6.1753. [DOI] [PubMed] [Google Scholar]
- Dennis M, Francis DJ, Cirino PT, Schachar R, Barnes MA, Fletcher JM. Why IQ is not a covariate in cognitive studies of neurodevelopmental disorders. Journal of the International Neuropsychological Society. 2009;15:331–343. doi: 10.1017/S1355617709090481. [DOI] [PMC free article] [PubMed] [Google Scholar]
- Desroches AS, Joanisse MF, Robertson EK. Specific phonological impairments in dyslexia revealed by eyetracking. Cognition. 2006;100(3):B32–B42. doi: 10.1016/j.cognition.2005.09.001. [DOI] [PubMed] [Google Scholar]
- Donnenwerth-Nolan S, Tanenhaus MK, Seidenberg MS. Multiple code activation in word recognition: evidence from rhyme monitoring. Journal of Experimental Psychology. 1981;7(3):170–80. [PubMed] [Google Scholar]
- Eckert M. Neuroanatomical Markers for Dyslexia: A Review of Dyslexia Structural Imaging Studies. The Neuroscientist. 2004;10(4):362. doi: 10.1177/1073858404263596. [DOI] [PubMed] [Google Scholar]
- Foorman BR. Phonological and orthographic processing: Separate but equal? In: Berninger VW, editor. The varieties of orthographic knowledge I: Theoretical and developmental issues. Dordrecht, The Netherlands: Kluwer; 1994. pp. 321–357. [Google Scholar]
- Griffiths YM, Snowling MJ. Predictors of exception word and nonword reading in dyslexic children: The severity hypothesis. Journal of Educational Psychology. 2002;94(1):34–43. [Google Scholar]
- Harm MW, Seidenberg MS. Are there orthographic impairments in phonological dyslexia? Cognitive Neuropsychology. 2001;18(1):71–92. doi: 10.1080/02643290125986. [DOI] [PubMed] [Google Scholar]
- Hoeft F, Hernandez A, McMillon G, Taylor-Hill H, Martindale JL, Meyler A, et al. Neural Basis of Dyslexia: A Comparison between Dyslexic and Non-dyslexic Children Equated for Reading Ability. Journal of Neuroscience. 2006;26(42):10700–10708. doi: 10.1523/JNEUROSCI.4931-05.2006. [DOI] [PMC free article] [PubMed] [Google Scholar]
- Jimenez JE, Siegel L, O’Shanahan I, Ford L. The relative roles of IQ and cognitive processes in reading disability. Educational Psychology. 2009;29(1):27–43. [Google Scholar]
- Kramer AF, Donchin E. Brain potentials as indices of orthographic and phonological interaction during word matching. Journal of Experimental Psychology: Learning Memory and Cognition. 1987;13(1):76–86. doi: 10.1037//0278-7393.13.1.76. [DOI] [PubMed] [Google Scholar]
- Landerl K, Frith U, Wimmer H. Intrusion of orthographic knowledge on phoneme awareness: Strong in normal readers, weak in dyslexic readers. Applied Psycholinguistics. 1996;17:1–14. [Google Scholar]
- Leonard CM, Eckert MA, Lomnardino LJ, Oakland T, Kranzler J, Mohr CM, King WM, Freeman A. Anatomical risk factors for phonological dyslexia. Cerebral Cortex. 2001;11:148–157. doi: 10.1093/cercor/11.2.148. [DOI] [PubMed] [Google Scholar]
- Lyytinen H, Guttorm TK, Huttunen T, Hämäläinen J, Leppänen PHT, Vesterinen M. Psychophysiology of developmental dyslexia: a review of findings including studies of children at risk for dyslexia. Journal of Neurolinguistics. 2005;18(2):167–195. [Google Scholar]
- McCandliss BD, Cohen L, Dehaene S. The visual word form area: expertise for reading in the fusiform gyrus. Trends in Cognitive Sciences. 2003;7(7):293–99. doi: 10.1016/s1364-6613(03)00134-7. [DOI] [PubMed] [Google Scholar]
- McPherson W, Ackerman P, Dykman R. Auditory and visual rhyme judgments reveal differences and similarities between normal and disabled adolescent readers. Dyslexia. 1997;3:64–77. [Google Scholar]
- Mesulam MM. From sensation to cognition. Brain. 1998;121:1013–1052. doi: 10.1093/brain/121.6.1013. [DOI] [PubMed] [Google Scholar]
- Meyler A, Breznitz Z. Processing of phonological., orthographic and cross-modal word representations among adult dyslexic and normal readers. Reading and Writing. 2003;16(8):785–803. [Google Scholar]
- Pattamadilok C, Perre L, Dufau S, Ziegler JC. On-line orthographic influences on spoken language in a semantic task. Journal of Cognitive Neuroscience. 2009;21(1):169–179. doi: 10.1162/jocn.2009.21014. [DOI] [PubMed] [Google Scholar]
- Peereman R, Dufour S, Burt JS. Orthographic influences in spoken word recognition: The consistency effect in semantic and gender categorization tasks. Psychonomic Bulletin & Review. 2009;16(2):363–368. doi: 10.3758/PBR.16.2.363. [DOI] [PubMed] [Google Scholar]
- Pennington BF. Diagnosing Learning Disorders. The Guilford Press; NY: 2008. [Google Scholar]
- Perre L, Midgley K, Zeigler JC. When beef primes reef more than leaf: Orthographic information affects phonological priming in spoken word recognition. Psychophysiology. 2009;46:739–746. doi: 10.1111/j.1469-8986.2009.00813.x. [DOI] [PubMed] [Google Scholar]
- Plaut DC, Booth JR. Individual and developmental differences in semantic priming: Empirical and computational support for a single-mechanism account of lexical processing. Psychological Review. 2000;107(4):786–823. doi: 10.1037/0033-295x.107.4.786. [DOI] [PubMed] [Google Scholar]
- Pugh KR, Mencl WE, Jenner AR, Katz L, Frost SJ, Lee JR, Shaywitz SE, Shaywitz BA. Functional neuroimaging studies of reading and reading disability (Developmental Dyslexia) Mental Retardation and Developmental Disabilities Research Reviews. 2000;6:207–213. doi: 10.1002/1098-2779(2000)6:3<207::AID-MRDD8>3.0.CO;2-P. [DOI] [PubMed] [Google Scholar]
- Rack J. Orthographic and phonetic coding in developmental dyslexia. British Journal of Psychology. 1985;76(3):325–340. doi: 10.1111/j.2044-8295.1985.tb01956.x. [DOI] [PubMed] [Google Scholar]
- Rack JP, Snowling MJ, Olson RK. The nonword reading deficit in developmental dyslexia: A review. Reading Research Quarterly. 1992;27(1):29–53. [Google Scholar]
- Rugg MD, Barrett SE. Event-related potentials and the interaction between orthographic and phonological information in a rhyme-judgment task. Brain Lang. 1987;32(2):336–61. doi: 10.1016/0093-934x(87)90132-5. [DOI] [PubMed] [Google Scholar]
- Seidenberg M, McClelland JL. A distributed, developmental model of word recognition. Psychological Review. 1989;96(4):523–568. doi: 10.1037/0033-295x.96.4.523. [DOI] [PubMed] [Google Scholar]
- Seidenberg M, Tanenhaus M. Orthographic effects on rhyme monitoring. Journal of Experimental Psychology: Human Learning & Memory. 1979;5(6):546–554. [PubMed] [Google Scholar]
- Shaywitz S, Shaywitz B, Pugh K, Fulbright R, Constable R, Mencl W, et al. Functional disruption in the organization of the brain for reading in dyslexia. Proceedings of the National Academy of Sciences of the United States of America. 1998;95(5):2636–41. doi: 10.1073/pnas.95.5.2636. [DOI] [PMC free article] [PubMed] [Google Scholar]
- Shaywitz BA, Shaywitz SE, Pugh KR, Mencl WE, Fulbright RK, Skudlarski P, et al. Disruption of posterior brain systems for reading in children with developmental dyslexia. Biological Psychiatry. 2002;52(2):101–110. doi: 10.1016/s0006-3223(02)01365-3. [DOI] [PubMed] [Google Scholar]
- Simos P, Breier J, Fletcher J, Foorman B, Bergman E, Fishbeck K, et al. Brain activation profiles in dyslexic children during non-word reading: a magnetic source imaging study. Neuroscience Letters. 2000;290(1):61–5. doi: 10.1016/s0304-3940(00)01322-7. [DOI] [PubMed] [Google Scholar]
- Snowling M. Dyslexia as a phonological deficit: Evidence and implications. Child Psychology and Psychiatry Review. 1998;3(1):4–11. [Google Scholar]
- Snowling MJ, Gallagher A, Frith U. Family risk of dyslexia is continuous: Individual differences in the precursors of reading skills. Child Development. 2003;74:358–373. doi: 10.1111/1467-8624.7402003. [DOI] [PubMed] [Google Scholar]
- Stanovich KE. Explaining the differences between the dyslexic and the garden-variety poor reader: the phonological–core variable-difference model. Journal of Learning Disabilities. 1988;21(10):590–603. doi: 10.1177/002221948802101003. [DOI] [PubMed] [Google Scholar]
- Stanovich KE. Conceptual and empirical problems with discrepancy definitions of reading disability. Learning Disability Quarterly. 1991;14:269–280. [Google Scholar]
- Stuebing KK, Fletcher JM, LeDoux JM, Lyon GR, Shaywitz SE, Shaywitz BA. Validity of IQ-discrepancy classifications of reading disabilities: A meta-analysis. American Educational Research Journal. 2002;39:469–518. [Google Scholar]
- Swan D, Goswami U. Phonological awareness deficits in developmental dyslexia and the phonological representations hypothesis. Journal of Experimental Child Psychology. 1997;66:18–41. doi: 10.1006/jecp.1997.2375. [DOI] [PubMed] [Google Scholar]
- Taft M, Castles A, Davis C, Lazendic G, Nguyen-Hoan M. Automatic activation of orthography in spoken word recognition: Pseudohomograph priming. Journal of Memory and Language. 2008;58:366–379. [Google Scholar]
- Temple E, Deutsch GK, Poldrack RA, Miller SL, Tallal P, Merzenich MM, et al. Neural deficits in children with dyslexia ameliorated by behavioral remediation: Evidence from functional MRI. Proceedings of the National Academy of Sciences. 2003;100(5):2860–2865. doi: 10.1073/pnas.0030098100. [DOI] [PMC free article] [PubMed] [Google Scholar]
- Temple E, Poldrack R, Salidis J, Deutsch G, Tallal P, Merzenich M, et al. Disrupted neural responses to phonological and orthographic processing in dyslexic children: An fMRI study. Neuroreport. 2001;12(2):299–307. doi: 10.1097/00001756-200102120-00024. [DOI] [PubMed] [Google Scholar]
- Van der Leij A, Van Daal VHP. Automatization aspects of dyslexia: Speed limitations in word identification, sensitivity to increasing task demands, and orthographic compensation. Journal of Learning Disabilities. 1999;32(5):417. doi: 10.1177/002221949903200507. [DOI] [PubMed] [Google Scholar]
- Velluntino FR, Scanlon DM, Lyon GR. Differentiating between difficult-to-remediate and readily remediated poor readers: More evidence against the IQ-achievement discrepancy definition of reading disability. Journal of Learning Disabilities. 2000;33:223–238. doi: 10.1177/002221940003300302. [DOI] [PubMed] [Google Scholar]
- Wagner RK, Torgesen JK, Rashotte . Test of Word Reading Efficiency: TOWRE. 1999a. PRO-ED. [Google Scholar]
- Wagner RK, Torgesen JK, Rashotte . Comprehensive Test of Phonological Processing: CTOPP. 1999b. PRO-ED. [Google Scholar]
- Wechsler D. Wechsler Abbreviated Scale of Intelligence. The Psychological Corporation; a Harcourt Brace & Company; 1999. [Google Scholar]
- Woodcock RW, McGrew KS, Mather N. Woodcock-Johnson III Tests of Achievement. Riverside Pub; 2001. [Google Scholar]
- Zecker SG. The orthographic code: Developmental trends in reading-disabled and normally-achieving children. Annals of Dyslexia. 1991;41:178–192. doi: 10.1007/BF02648085. [DOI] [PubMed] [Google Scholar]
- Zeno SM, Ivens SH, Millard RT, Duvvuri R. The Educator’s Word Frequency Guide [CD-ROM, DOS version] Brewster, NY: Touchstone Applied Science Associates; 1996. [Google Scholar]
- Ziegler JC, Perry C, Ma-Wyatt A, Ladner D, Schulte-Körne G. Developmental dyslexia in different languages: Language-specific or universal? Journal of Experimental Child Psychology. 2003;86:169–193. doi: 10.1016/s0022-0965(03)00139-5. [DOI] [PubMed] [Google Scholar]
- Ziegler JC, Muneaux M, Grainger J. Neighborhood effects in auditory word recognition: Phonological competition and orthographic facilitation. Journal of Memory & Language. 2003;48:779–793. [Google Scholar]
- Zeigler JC, Muneaux M. Orthographic facilitation and phonological inhibition in spoken word recognition: A developmental study. Psychological Bulletin & Review. 2007;14:75–80. doi: 10.3758/bf03194031. [DOI] [PubMed] [Google Scholar]