Substantial attention has been devoted to nanoparticles conjugated with functional ligands. Application of these materials has included building blocks for nano-scale structures,[1] materials for sensing and detection,[2] platforms for targeted delivery,[3] imaging and diagnostic systems,[4] and probes of biological structure.[5] One of the challenging features of these systems is the heterogeneous distribution of ligands per particle. For the vast majority of systems reported, these distributions are not characterized nor are they incorporated in design parameters. The implications of this heterogeneity are two-fold: First, mixtures containing many ligand/particle ratios make studies that investigate composition–activity relationships complex; second, production of materials with a consistent distribution of ligand/particle ratios is problematic because of inconsistencies in the nanoparticle preparations and reaction kinetics. New methods that exhibit precise control over the number of ligands per particle have the potential for dramatically improved functional efficacy, batch reproducibility, and an enhanced ability to probe the relationship between activity and the number of ligands conjugated to a particle.
Significant progress has been made towards precisely controlled materials using gold nanoparticles. A number of strategies exist in the literature to synthesize and/or isolate milligram quantities of gold nanoparticles with a single functional group[6] and up to 95% purity has been achieved. Gold nanoparticles with 0–5 conjugated ligands have also been isolated in sub milligram quantities using either gel electrophoresis or ion-exchange chromatography.[7]
This level of control has not been attained for other nanoparticle-based systems. In fact, with few exceptions, the analytical techniques commonly used to characterize these systems (NMR, HPLC, GPC, MALDI-TOF, UV/Vis) have been unable to identify the distribution of nanoparticle-ligand components.
Recently, we have developed the ability to resolve the distribution of components using HPLC for poly(amidoamine) (PAMAM) dendrimer samples conjugated with 3-(4-(prop-2-ynyloxy)phenyl)propanoic acid (alkyne ligand).[8] The results of these studies revealed that dendrimer–ligand distributions are heterogeneous (a sample with a ligand mean of 5.7 was composed of 18 dendrimer–ligand components), are poorly represented by the arithmetic mean, and are sensitive to pre-existing distributions of conjugation sites on the parent dendrimer.
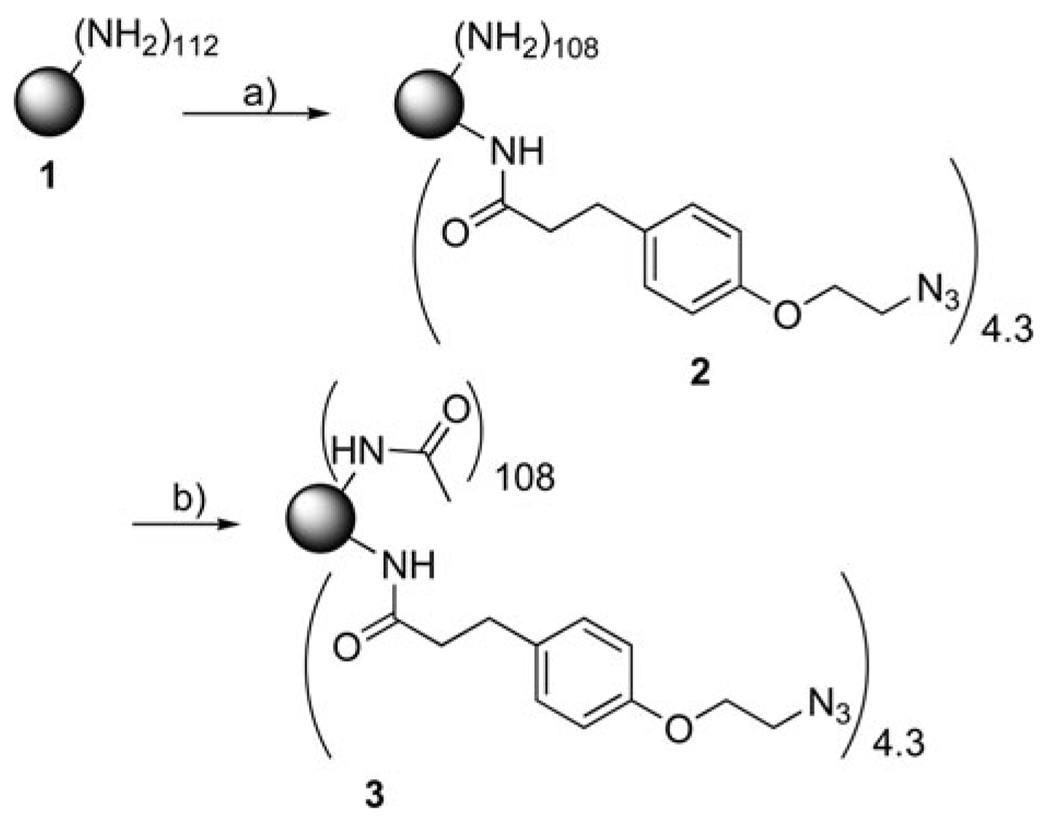
We have now employed semi-preparative HPLC to successfully isolate nine different dendrimer components with precise numbers of ligands. Generation 5 (G5) PAMAM dendrimer was conjugated with (3-(4-(2-azidoethoxy)phenyl)propanoic acid) (azide ligand) to produce dendrimer with a mean of 4.3 ligands (Scheme 1). Dendrimer samples with 0, 1, 2, 3, 4, 5, 6, 7 and 8 azide ligands were isolated from the dendrimer conjugate 3 and characterized by 1H NMR and analytical HPLC. Levels of purity for these samples were found to be greater than 80%.
Scheme 1.
a) Alkyne ligand, NHS, EDC, acetonitrile, water, RT, 12 h, 79% yield; b) acetic anhydride, triethylamine, MeOH, RT, 12 h, 61% yield. Detailed experimental methods can be found in the Supporting Information.
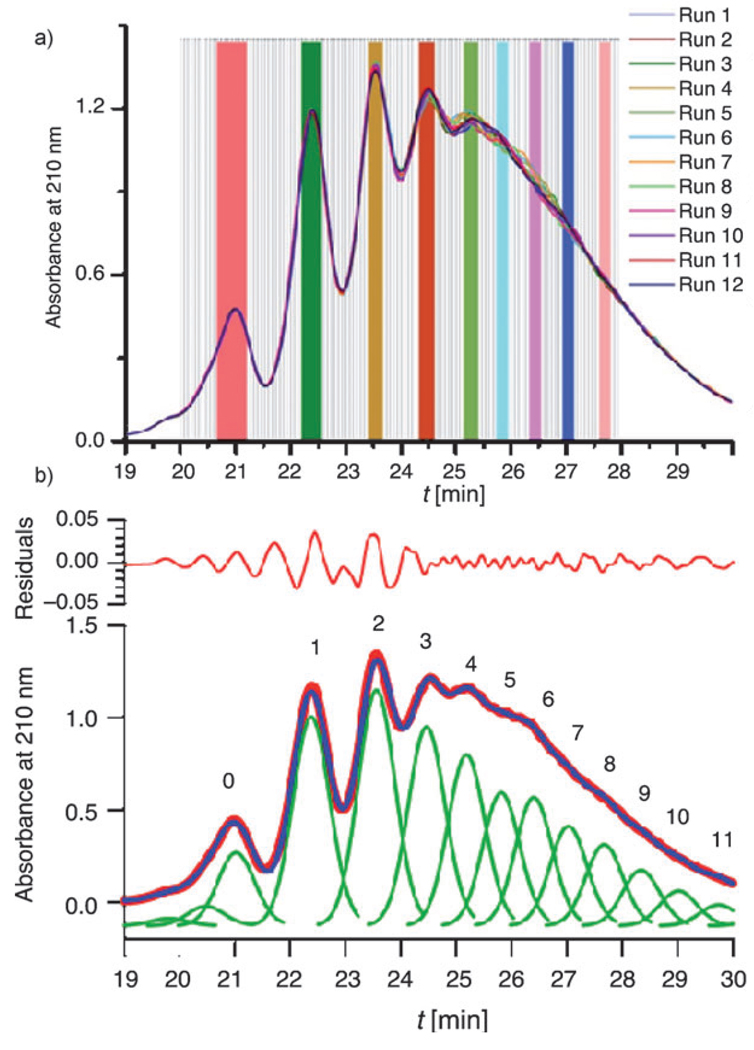
Isolation of practical quantities was achieved by carrying out the HPLC process for 12 runs. Figure 1 a shows the semi-preparative HPLC traces along with grey lines demarking the fractions that were collected every 4 s. A peak-fitting analysis determined the retention time of each component (Figure 1 b), thereby identifying the fractions in Figure 1 a to combine for dendrimer samples with 0–8 ligands. These fractions are highlighted in Figure 1 a by solid colored bars. The mass isolated by this process is listed in Table 1.
Figure 1.
Isolation of dendrimer–ligand components by semi-preparative HPLC. a) Semi-preparative HPLC traces for the 12 identical runs. The 120 fractions starting at 20 min are shown in grey. The selected fractions for each of the different dendrimer–ligand components (0–8) are highlighted in solid colored lines. b) Peak fitting analysis of the trace for Run 6. The HPLC data is presented in red circles and the multiple copies of the fitting peak are shown in green. The summation of these fitting peaks is shown in blue. The residual values in panel b are multiplied by 106.
Table 1.
Characterization of isolated dendrimer with precise numbers of ligands.
| HPLC Analysis | NMR Analysis | ||||||||
|---|---|---|---|---|---|---|---|---|---|
| Nominal no. of li- gands per dendrimer |
Mass re- covered [mg] |
No. li- gands per dendrimer |
Purity [%][a]Increase in purity[b] |
No. li- gands per dendrimer |
Difference [%][c] |
No. li- gands per dendrimer |
Difference [%][c] |
||
| 0 | 10.4 | 0.0 | 100 | 14× | 0 | 0 | 0 | 0 | Method |
| 1 | 10.1 | 1.0 | 97 | 6× | 1.2 | 20 | 1.1 | 10 | 1Method |
| 2 | 8.5 | 1.9 | 93 | 6× | 2.4 | 26 | 2.2 | 14 | 2 |
| 3 | 9.5 | 2.7 | 88 | 7× | 3.4 | 26 | 3.2 | 17 | |
| 4 | 8.7 | 3.8 | 86 | 9× | 4.3 | 13 | 3.9 | 3 | |
| 5 | 5.4 | 4.8 | 84 | 10× | 4.9 | 2 | 4.5 | 7 | |
| 6 | 6.7 | 5.8 | 84 | 12× | 5.7 | 2 | 5.2 | 10 | |
| 7 | 1.5 | 6.7 | 82 | 14× | 6.8 | 3 | 5.8 | 13 | |
| 8 | 1.8 | 7.7 | 79 | 16× | 7.8 | 1 | 6.9 | 10 | |
Defined by the number of ligands per dendrimer.
Fold increase in purity is relative to the amount of the component in the distribution (dendrimer 3).
Difference is calculated by the NMR ratio minus the HPLC ratio, divided by the HPLC ratio.
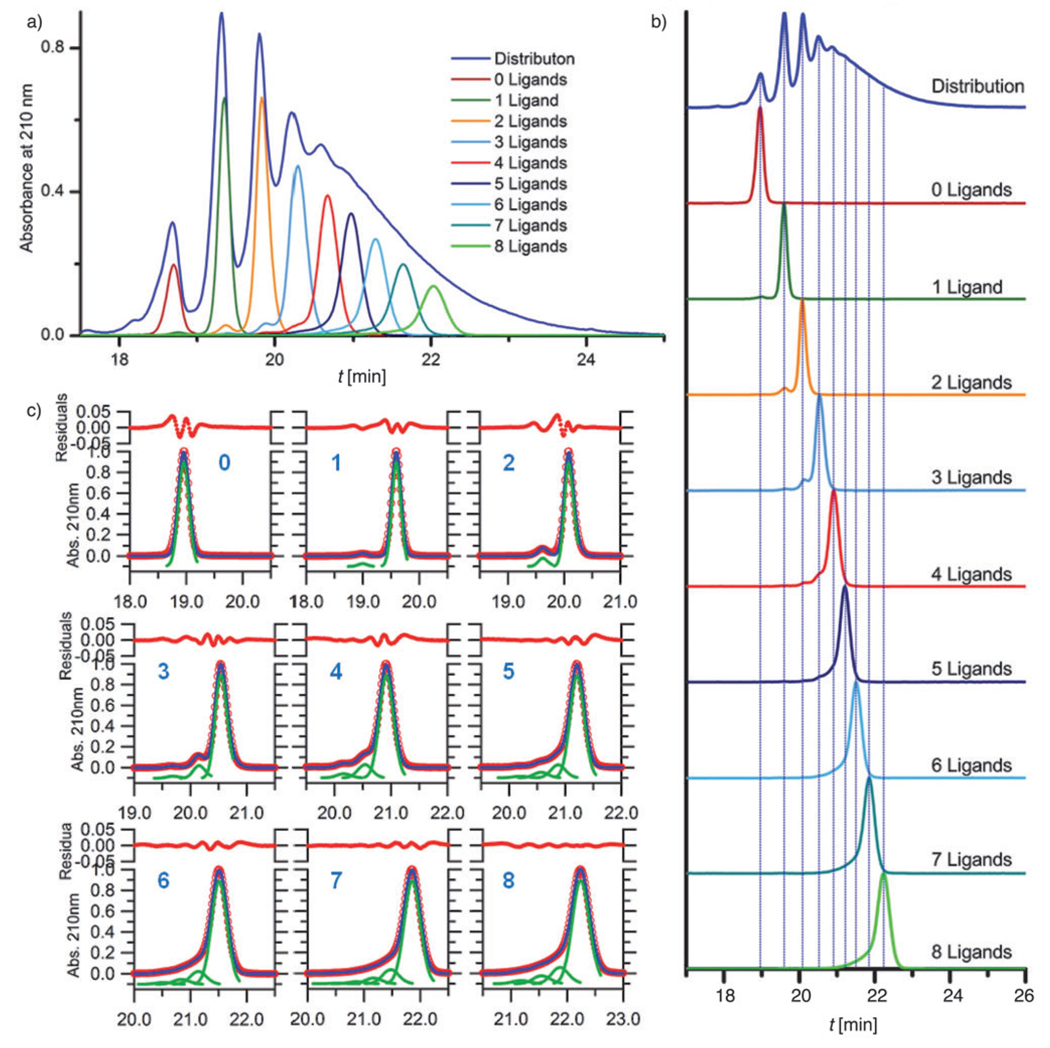
Analytical HPLC was used to characterize the samples both before and after purification. Figure 2 a displays the sample traces before purification. A normalized trace of 3 is included for reference. The peak area for each of the samples directly relates to the amount of material that was isolated because samples were characterized at the isolated concentration. Following purification, the samples were characterized again by analytical HPLC (Figure 2b) and 1H NMR spectroscopy.
Figure 2.
Analytical HPLC analysis for the isolated dendrimer–ligand components. a) Baseline-corrected traces for dendrimer–ligand components with 0–8 ligands run immediately after the isolation process. The area of each peak is directly proportional to the amount of isolated material. The HPLC trace (normalized) for the dendrimer distribution with a mean of 4.3 ligands is also included. b) Traces for the isolated dendrimer–ligand components after purification (each trace baseline corrected and normalized). Blue lines show relationship between the isolated component and the material with the distribution of components. In addition to the major peak in each component, small amount of other components have been detected. c) The peak fitting method was used to quantify the purity of each isolated component. Fitting peaks are shown in green, with the summation of these peaks in blue. The HPLC data is shown in red circles. The residual values in panel c are multiplied by 106.
Three main features stand out in Figure 2: First, each isolated component has the same retention time as its original position in the distribution; second, smaller peaks can be seen adjacent to the major peak in each sample. These smaller peaks have retention times consistent with other dendrimer–ligand components. The purity levels of the isolated samples (Table 1) were quantified by peak fitting (Figure 2 c); finally, no differences were observed in the HPLC traces before and after purification indicating that the samples did not degrade during the purification process.
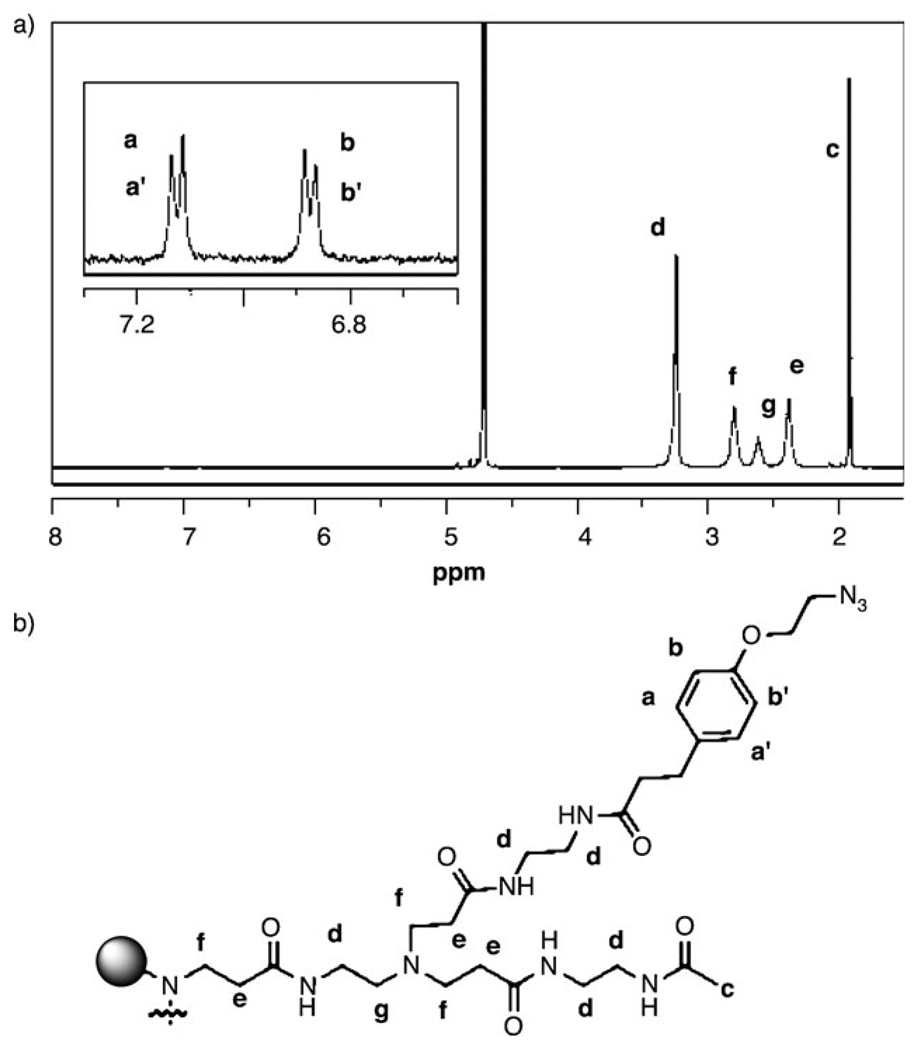
NMR is the second technique used to characterize the isolated samples. Figure 3 shows the 1H spectrum for the sample with one ligand. Two different methods were used to calculate the ligand/dendrimer ratio for each sample (Table 1).
Figure 3.
1H NMR characterization. a) Spectrum for the isolated dendrimer with 1 ligand. b) Chemical structure and proton labels for the azide ligand and acetyl-terminated dendrimer arms.
The first method has two assumptions: 1) All dendrimer end groups are either acetyl groups or ligands. 2) The mean number of end groups per dendrimer after HPLC isolation is 112. Method 1 uses the integrals for the aromatic ligand protons (aa′ and bb′), normalized by the number of these protons per ligand (4), divided by the numerator plus the integral for the methyl protons at 1.9 ppm normalized by the number of protons per acetyl group. The product (the ratio of ligands to the total number of end groups per dendrimer) is multiplied by 112 to yield the number of ligands per dendrimer.
Overall, there is good agreement between the ratios determined by HPLC and by NMR method 1. For samples 5–8, the difference between these values is 3% or less. Samples with 1–4 ligands, however, have differences between 13 and 26%. These larger differences suggest that the assumptions in Method 1 may not be appropriate. In addition to 3 being composed of a distribution of dendrimer/ligand ratios, the dendrimer alone is a polymer with different backbone structures. Considering that a small section of each component peak was isolated from the distribution in Figure 1 a, the isolated dendrimer particles in each sample may not have a mean of 112 end groups.
Using a different set of assumptions, a second method was used to calculate the NMR ratios. This method uses the protons from the interior of the dendrimer as a reference. The reference integral was determined using 4 which was also made from 1. In the 1H NMR spectrum for this material, the integral of the methyl protons c was normalized to 336. This provided the number of interior protons, f, g, and e per dendrimer. These protons were then used as an internal reference to quantify the ligand/dendrimer ratio in the isolated samples.
Method 2 assumes that all amine groups in 4 were acetylated and that the number of interior protons is not sensitive to the isolation process. The ligand/dendrimer ratios, calculated by Method 2, are reported in Table 1. Similar to Method 1, there is generally good agreement between the number of ligands by HPLC and the NMR calculation. For samples 1–4, the difference is between 3 and 17%. Samples 5–8 have differences between 7 and 13%.
Our ability to generate dendrimers with precise numbers of ligands is significant for two reasons: First, this method produces material with precise numbers of functional ligands. In this study, over 80% of the material in each sample is a single dendrimer–ligand component. This is an order of magnitude improvement in the purity of the desired component (Table 1). Since the ligand in this study has a terminal azide group, the samples can be modified with biologically active molecules using alkyne–azide “click” chemistry. The end result is a system in which ≥80% of the dendrimer particles have a same number of biologically active molecules. Second, our method directly addresses the batch-to-batch reproducibility challenge facing nanoparticle conjugate production. This is a problem that dendrimer-based systems have not escaped. Dendrimer-based drug delivery platforms with great in vivo activity, failed to advance to the clinic because of inconsistencies in the material being produced. Our new method achieves batch consistency because the resolution of dendrimer–ligand components by HPLC is highly reproducible. As a result of such consistent product, the process remains insensitive to variations in the dendrimer conjugate that usually results from batch-to-batch inconsistencies in the dendrimer synthesis and subsequent reaction kinetics.
In conclusion, we have successfully employed a semi-preparative HPLC to isolate dendrimer with 0–8 azide ligands. Peak fitting analysis on analytical HPLC traces determined the sample purity to be 80% or higher. The number of ligands per dendrimer, quantified by 1H NMR spectroscopy, were in good agreement with the number quantified by HPLC and peak fitting. Significantly, for dendrimer compounds with 0–4 ligands, over 8 mg of material was produced in this study. This approach shows great promise to overcome batch reproducibility challenges in dendrimer-based systems.
Supplementary Material
Acknowledgements
This work was supported in part with Federal funds from the National Cancer Institute, National Institutes of Health, under Award 1 R01 CA119409 and Department of Defense DARPA award W911NF-07-1-0437.
Footnotes
Supporting information for this article is available on the WWW under http://dx.doi.org/10.1002/chem.201001175.
References
- 1.a) Maye MM, Nykypanchuk D, Cuisinier M, van der Lelie D, Gang O. Nat. Mater. 2009;8:388–391. doi: 10.1038/nmat2421. [DOI] [PubMed] [Google Scholar]; b) Maye MM, Kumara MT, Nykypanchuk D, Sherman WB, Gang O. Nat. Nanotechnol. 2010;5:116–120. doi: 10.1038/nnano.2009.378. [DOI] [PubMed] [Google Scholar]
- 2.a) Medintz IL, Clapp AR, Mattoussi H, Goldman ER, Fisher B, Mauro JM. Nat. Mater. 2003;2:630–638. doi: 10.1038/nmat961. [DOI] [PubMed] [Google Scholar]; b) Jain KK. Clin. Chim. Acta. 2005;358:37–54. doi: 10.1016/j.cccn.2005.03.014. [DOI] [PubMed] [Google Scholar]
- 3.a) Tong R, Cheng JJ. Polym. Rev. 2007;47:345–381. [Google Scholar]; b) Peer D, Karp JM, Hong S, FaroKhzad OC, Margalit R, Langer R. Nat. Nanotechnol. 2007;2:751–760. doi: 10.1038/nnano.2007.387. [DOI] [PubMed] [Google Scholar]; c) Choi HS, Liu W, Liu F, Nasr K, Misra P, Bawendi MG, Frangioni JV. Nat Nanotechnol. 2010;5:42–47. doi: 10.1038/nnano.2009.314. [DOI] [PMC free article] [PubMed] [Google Scholar]
- 4.a) Nie SM, Xing Y, Kim GJ, Simons JW. Annu. Rev. Biomed. Eng. 2007;9:257–288. doi: 10.1146/annurev.bioeng.9.060906.152025. [DOI] [PubMed] [Google Scholar]; b) Landmark KJ, DiMaggio S, Ward J, Kelly C, Vogt S, Hong S, Kotlyar A, Myc A, Thomas TP, Penner-Hahn JE, Baker JR, Holl MMB, Orr BG. ACS Nano. 2008;2:773–783. doi: 10.1021/nn800034w. [DOI] [PubMed] [Google Scholar]; c) Thaxton CS, Elghanian R, Thomas AD, Stoeva SI, Lee JS, Smith ND, Schaeffer AJ, Klocker H, Horninger W, Bartsch G, Mirkin CA. Proc. Natl. Acad. Sci. USA. 2009;106:18437–18442. doi: 10.1073/pnas.0904719106. [DOI] [PMC free article] [PubMed] [Google Scholar]
- 5.Hong S, Leroueil PR, Majoros IJ, Orr BG, Baker JR, Holl MMB. Chem. Biol. 2007;14:107–115. doi: 10.1016/j.chembiol.2006.11.015. [DOI] [PubMed] [Google Scholar]
- 6.a) Hainfeld JF, Robinson JM, Histochem J. Cytochem. 2000;48:459–460. doi: 10.1177/002215540004800402. [DOI] [PubMed] [Google Scholar]; b) Chak CP, Xuan SH, Mendes PM, Yu JC, Cheng CHK, Leung KCF. ACS Nano. 2009;3:2129–2138. doi: 10.1021/nn9005895. [DOI] [PubMed] [Google Scholar]; c) Wilson R, Chen Y, Aveyard J. Chem. Commun. 2004:1156–1157. doi: 10.1039/b402786h. [DOI] [PubMed] [Google Scholar]
- 7.a) Zanchet D, Micheel CM, Parak WJ, Gerion D, Alivisatos AP. Nano Lett. 2001;1:32–35. [Google Scholar]; b) Zanchet D, Micheel CM, Parak WJ, Gerion D, Williams SC, Alivisatos AP. J. Phys. Chem. B. 2002;106:11758–11763. doi: 10.1021/ja017822w. [DOI] [PubMed] [Google Scholar]; c) Claridge SA, Liang HYW, Basu SR, Frechet JMJ, Alivisatos AP. Nano Lett. 2008;8:1202–1206. doi: 10.1021/nl0802032. [DOI] [PubMed] [Google Scholar]; d) Sperling RA, Pellegrino T, Li JK, Chang WH, Parak WJ. Adv. Funct. Mater. 2006;16:943–948. [Google Scholar]; e) Zikich D, Borovok N, Molotsky T, Kotlyar A. Bioconjugate Chem. 2010 doi: 10.1021/bc900527a. [DOI] [PubMed] [Google Scholar]
- 8.a) Mullen DG, Desai AM, Waddell JN, Cheng XM, Kelly CV, McNerny DQ, Majoros IJ, Baker JR, Sander LM, Orr BG, Holl MMB. Bioconjugate Chem. 2008;19:1748–1752. doi: 10.1021/bc8002106. [DOI] [PMC free article] [PubMed] [Google Scholar]; b) Mullen DG, Fang M, Desai AM, Baker JR, Orr BG, Holl MMB. ACS Nano. 2010;4:657–670. doi: 10.1021/nn900999c. [DOI] [PMC free article] [PubMed] [Google Scholar]
Associated Data
This section collects any data citations, data availability statements, or supplementary materials included in this article.


