Abstract
Background
Serum creatinine is a delayed marker of acute kidney injury (AKI). Our purpose was to discover and validate novel early urinary biomarkers of AKI after cardiac surgery.
Study Design
Diagnostic test study.
Setting & Participants
Children undergoing cardiopulmonary bypass surgery. The test set included 15 subjects with AKI and 15 matched controls (median age 1.5 years) among 45 subjects without AKI. The validation set included 365 children (median age 1.9 years).
Index Tests
Biomarkers identified by proteomic profiling: α1-microglobulin, α1-acid glycoprotein, and albumin.
Reference Test
AKI, defined as a 50% or greater increase in serum creatinine from baseline within three days of surgery.
Results
Proteomic profiling by SELDI-TOF MS revealed three protein peaks that consistently appeared within 2 hours in children who developed AKI after cardiopulmonary bypass surgery. The proteins were identified as α1-microglobulin, α1-acid glycoprotein, and albumin. Using clinical assays, the results were confirmed in a test set and validated in an independent prospective cohort. In the validation set, 135 (37%) developed AKI, in whom there was a progressive increase in urinary biomarker concentrations with severity of AKI. The area under the curve (AUC) for urinary α1-microglobulin, α1-acid glycoprotein, and albumin at 6 hours after cardiac surgery were 0.84 (CI 0.79–0.89), 0.87 (CI 0.83–0.91), and 0.76 (CI 0.71–0.81) respectively. Subjects with increasing quartiles of biomarkers demonstrated increasing length of hospital stay and duration of AKI (P<0.001).
Limitations
Single center study of children with normal kidney function at recruitment. The SELDI-TOF MS technique has limited sensitivity for the detection of proteins above the 20 kDa range.
Conclusions
Urinary α1-microglobulin, α1-acid glycoprotein, and albumin represent early, accurate, inexpensive and widely available biomarkers of AKI after cardiac surgery. They also offer prognostic information on duration of AKI and length of hospitalization after cardiac surgery.
Acute kidney injury (AKI) affects 2–5% of hospitalized patients in whom it represents an independent predictor of mortality and morbidity (1–3). In critical care settings, the prevalence of AKI requiring dialysis is about 5%, with a mortality rate exceeding 60% (3–5). The diagnosis depends on detection of a rise in serum creatinine concentration, which is an unreliable measure in the acute setting. Although experimental studies have identified interventions that may prevent or treat AKI if instituted before the serum creatinine rises (6), the lack of early predictive biomarkers has impaired our ability to translate these promising findings to humans..
Recent advances in clinical proteomics have accelerated the discovery of novel urinary biomarkers for kidney diseases (7–9). Of the various methods available, the Surface-Enhanced Laser Desorption/Ionization Time-of-Flight Mass Spectrometry (SELDI-TOF MS) technology offers the advantage of unbiased, rapid, high-throughput urinary protein profiling (7–11). This technique has recently revealed urinary peaks α2-microglobulin and other unidentified species in adult subjects who developed AKI after cardiopulmonary bypass surgery (10). Furthermore, the appearance of novel peaks identified as hepcidin-25 in the non-AKI urine samples has suggested a novel role for this iron-sequestering molecule in modulating AKI (10). We have previously shown in children undergoing cardiac surgery that a distinctive urinary proteomic profile consisting of enhanced peaks at 28.5, 43, and 66 kDa predicts the development of AKI (11). Therefore, the first objective of the present study was to identify the three urinary peaks. The second objective was to conduct a prospective observational study, first with a test set and then with a validation set of children undergoing cardiac surgery, to define the diagnostic and prognostic properties of the identified biomarkers.
METHODS
Protein Identification
Previous SELDI-TOF MS studies in children undergoing cardiopulmonary bypass surgery who subsequently developed AKI (defined as a 50% or greater increase in serum creatinine from baseline) revealed peptide species at 28.5, 43, and 66 kDa that were enhanced in urine obtained 2 hours post-surgery (11). The archived urine samples (n=10) were subjected to sodium dodecyl sulfate polyacrylamide gel electrophoresis (SDS-PAGE), and individual protein bands detected at 28.5, 43, and 66 kDa were excised and digested with trypsin. Single MS and tandem (MS/MS) spectra of peptide fragments were acquired on a tandem mass spectrometer (Q-Star XL, Applied Biosystems, www.appliedbiosystems.com) equipped with a PCI-1000 ProteinChip Interface (Vermillion [formely Ciphergen Biosystems], vermillion.com). The collisionally induced dissociation spectra were submitted to Mascot (Matrix Science, www.matrixscience.com) for protein identification..
Study Design
This investigation was approved by the Institutional Review Board of the Cincinnati Children’s Hospital Medical Center. Written informed consent was obtained from each patient or legal guardian before enrollment. All subjects undergoing elective cardiopulmonary bypass at Cincinnati Children’s Hospital Medical Center for surgical correction or palliation of congenital heart lesions were eligible for the prospective arms of this study. Exclusion criteria included pre-existing renal insufficiency, diabetes mellitus, and use of radiocontrast agents or nephrotoxic drugs up to 1 week before or during the study period. The test set was chosen from 60 subjects who consented to the study between January 2004 and June 2004. Fifteen patients met the criteria for AKI, and 15 additional age- and gender-matched controls were included from among the 60 consenting subjects. The validation set included 385 patients who agreed to participate in the study between July 2004 and June 2007, out of which 20 subjects met one of the exclusion criteria.
Spot urine samples obtained pre-operatively and at defined time intervals for up to 72 hours after initiation of cardiopulmonary bypass were centrifuged at 2000 g for 5 min, and the supernatants aliquoted and stored at −80°C. Samples were batched for biomarker measurements within 12 months of collection. No more than two freeze-thaw cycles were permissible for each sample. Serum creatinine was measured at baseline and routinely monitored every 24 hours post surgery.
The primary outcome variable was the development of AKI, defined as a 50% or greater increase in serum creatinine from baseline within three days of the surgery, which was sustained for more than 24 hours and not reversed by fluid administration or by other routine standard of care measures. For the validation set, subjects were stratified according to the severity of AKI, as mild (50–99% increase in serum creatinine from baseline), moderate (≥100% increase in serum creatinine) or severe (dialysis requirement or death during hospitalization). This simple but widely used classification was utilized because of the potential for errors in staging AKI by RIFLE criteria, as was recently described by Pickering and Endre (14). The secondary outcome variables included length of hospital stay and duration of AKI (defined as the number of days serum creatinine was elevated >50%). The candidate predictor variables assessed for the prediction of AKI included age, gender, ethnic origin, cardiopulmonary bypass time, inotrope score, and previous history of cardiac surgery. In order to provide an index of the subject’s post-operative hemodynamic status, we utilized the dosages of inotropic infusions to calculate the inotrope score at 24 hours post cardiopulmonary bypass, as previously described for similar patient cohorts (12).
Biomarker Measurements
All measurements were made in duplicate, and the laboratory investigators were blinded to the sample sources and clinical outcomes until the end of the study. Initially, the peak intensities of the identified urinary biomarkers on SELDI-TOF MS profiles were compared. In addition, the concentrations of the identified biomarkers were measured by nephelometry using a clinical laboratory platform (BN ProSpec, Siemens Healthcare Diagnostics, www.medical.siemens.com),. The inter- and intra-assay coefficient variations were < 5% for batched samples analyzed on the same day, and <10% for samples measured 6 months apart. No change in biomarker concentration was noted following up to three freeze-thaw cycles. Urine creatinine was measured using a quantitative colorimetric assay kit (Sigma, www.sigmaaldrich.com). Since urine creatinine measurements did not differ significantly between patients who developed AKI versus those who did not, no adjustment was required for changes in urinary concentrations, and the results of all assays were expressed per unit volume of urine.
Statistical Analysis
Paired t-test and chi-square test were conducted to test demographic, clinical and laboratory measurements differences between the AKI and the control groups. Analysis of variance as well as non-parametric Wilcoxon test was used to determine whether statistically significant differences existed between urinary biomarkers at various time points by severity of AKI. Multivariate logistic regression on biomarkers was conducted for diagnosis of AKI, adjusting for demographic and clinical variables. In the validation set, the biomarkers were dichotomized at values which optimize sensitivity and specificity, respectively. The logistic regression results were further utilized to compute odds ratios, along with their confidence intervals. To illustrate trends over time of the three biomarkers, sample means and standard errors were computed and depicted longitudinally for AKI and control groups. A mixed model analysis was performed by log-transforming biomarker values, and fitting the linear mixed model to the data, including fixed effects for time after surgery (2, 6, 12, 24, and 48 hours, with an origin of 2), group (AKI and non AKI), and their interaction, and random intercepts and slopes. The estimated interaction of time and group suggests much steeper average time trend for the biomarker in Non AKI group than in AKI group (P < 0.001 except for interaction of time and group for Alb with p = 0.08). To assess prediction accuracy of biomarkers for diagnosis of AKI, receiver operating curves (ROC) were plotted and the areas under the curves (AUC) were computed with their confidence intervals. Analysis of variance was conducted to assess the association of quartiles of biomarker levels with severity of clinical outcomes, such as percent change in serum creatinine, duration of AKI, and hospital length of stay. Bayes’ theorem was incorporated to generate individual post-test probabilities (15). Based on the sensitivity and specificity of the test, the likelihood ratios were calculated. The range of values for expected post-test probability of disease for any pre-test probability when a test of known sensitivity and specificity is positive or negative were obtained (15). All tests are two-sided with p-value < 0.05 indicating statistical significance. We analyzed the data using R 2.6.0 (R Foundation for Statistical Computing, www.r-project.org).
RESULTS
Identification of Early Biomarkers of AKI after Cardiopulmonary Bypass
Previous SELDI-TOF MS studies using the normal phase (NP20) protein array chip in children undergoing cardiopulmonary bypass surgery who subsequently developed AKI revealed peptide species at 28.5, 43, and 66 kDa that were enhanced in urine obtained 2 hours post-surgery (11). Tryptic digests of these peptides extracted from archived urine samples resulted in the identification of the following proteins: α1-microglobulin at 28.5 kDa, α1-acid glycoprotein at 43 kDa, and albumin at 66 kDa. The identity of these proteins was further confirmed in 15 subjects who developed acute kidney injury after cardiopulmonary bypass as follows. A research ELISA assay for α1-microglobulin (Immundiagnostik, www.immundiagnostik.com) showed a three-fold increase in this urinary biomarker within 2 hours of surgery (p<0.01 versus control; data not shown). Western blotting with a specific monoclonal antibody to α1-acid glycoprotein (Abcam, www.abcam.com) recognized a ten-fold induction of the predicted 43 kDa immunoreactive species in the urine within 2 hours of surgery (p<0.01 versus control, data not shown). Immunonephelometric testing (BN ProSpec, Siemens) revealed a five-fold increase in urinary albumin within 2 hours of surgery (p<0.01 versus control, data not shown). We therefore recruited a separate test set of subjects to measure the identified biomarkers by nephelometry.
Findings of the Test Set
The test set included 30 children who met the inclusion and exclusion criteria. The demographic, clinical and laboratory characteristics are shown in Table 1. The type of surgical procedures performed was similar to that previously reported in studies performed by our group (12, 13). Fifteen patients (25%) met the criteria for AKI, defined as a ≥50% increase in serum creatinine from baseline, within a three day period after cardiopulmonary bypass. We measured the identified biomarkers in those 15 subjects, and in 15 age- and gender-matched controls that did not develop AKI following cardiopulmonary bypass. No differences were noted with respect to race or history of previous cardiac surgery in cases and controls.
TABLE 1.
Demographic, Clinical and Laboratory Characteristics
| Test Set (n=30) | Validation Set (n=365) | |||||
|---|---|---|---|---|---|---|
| Control (n=15) | AKI (n=15) | P values | Control (n=230) | AKI (n=135) | P values | |
| Patient Demographics | ||||||
| Age (yr) | 3.9±5.3 | 4.0±7.8 | 0.9 | 3.9±4.5 | 3.6±4.6 | 0.6 |
| Males | 8 (53%) | 9 (60%) | 0.7 | 123(53%) | 72 (53%) | 0.9 |
| Caucasians | 13 (87%) | 13 (87%) | 0.9 | 191 (83%) | 117 (87%) | 0.4 |
| Previous surgery | 4 (27%) | 5 (33%) | 0.7 | 76 (33%) | 61 (45%) | 0.03 |
| Bypass Time (min) | 80.5±29.3 | 153.9±61.9 | <0.001 | 100.6±46 | 143.7±63.2 | <0.001 |
| Clinical Variables | ||||||
| Pre-op SCr | 0.47±0.2 | 0.42±0.2 | 0.5 | 0.5±0.2 | 0.4±0.2 | <0.001 |
| ΔSCr at 24 hr (%) | −3±20 | −7±25 | 0.3 | −4±18 | 25±35 | <0.001 |
| ΔSCr at 48 hr (%) | −11±23 | 83±49 | 0.002 | 2.3±20 | 68±59 | <0.001 |
| ΔSCr at 72 hr (%) | −11±46 | 79±44 | 0.001 | −1.5±20 | 91±74 | <0.001 |
| Inotrope Score | 3.9±3.6 | 9.0±6.2 | <0.001 | 2.0±4.6 | 5.9±7.3 | <0.001 |
| Hospital Stay (days) | 5.2±2.2 | 22.3±16.9 | <0.001 | 5.6 ± 4.3 | 13.1±15 | <0.001 |
| Dialysis | 0 (0%) | 1 (6.7%) | 0.3 | 0 (0%) | 7 (5%) | <0.001 |
| Death | 0 (0%) | 2 (13%) | 0.2 | 0 (0%) | 6 (4%) | 0.002 |
| Days in AKI | 0 | 3.1±2.3 | N/A | 0 | 3.6±3.7 | N/A |
| Laboratory Measures | ||||||
| Peak* A1M 0 hr | 0.47±0.26 | 0.46±0.2 | 0.9 | ND | ND | |
| Peak* A1M 2 hr | 0.54±0.27 | 3.93±1.4 | <0.001 | ND | ND | |
| A1M mg/dl 0 hr | 1.04±0.57 | 1.09±0.71 | 0.8 | 0.9±1.5 | 0.8±1.3 | 0.8 |
| A1M mg/dl 2 hr | 1.98±0.95 | 8.04±4.79 | <0.001 | 2.4±2.5 | 8.4±6.3 | <0.001 |
| Peak* AAG 0 hr | 0.29±0.07 | 0.30±0.1 | 0.8 | ND | ND | |
| Peak* AAG 2 hr | 0.32±0.08 | 2.48±1.3 | <0.001 | ND | ND | |
| AAG mg/dl 0 hr | 0.55±0.80 | 0.68±0.75 | 0.7 | 0.6±1.5 | 0.6±1.6 | 0.9 |
| AAG mg/dl 2 hr | 0.80±1.0 | 8.1±5.4 | <0.001 | 1±2 | 7.5±7.0 | <0.001 |
| Peak* Alb 0 hr | 1.67±0.98 | 1.87±0.74 | 0.5 | ND | ND | |
| Peak* Alb 2 hr | 2.27±1.49 | 34.73±11.7 | <0.001 | ND | ND | |
| Alb mg/dl 0 hr | 2.65±2.6 | 2.89±2.6 | 0.8 | 2.9±4.3 | 2.6±2.9 | 0.4 |
| Alb mg/dl 2 hr | 8.63±7.5 | 27.1±18.9 | <0.001 | 9.8±12.8 | 24.4±28.2 | <0.001 |
Values are means±SEM. P values are for comparisons between control and AKI groups.
AKI, acute kidney injury (defined as ≥50% increase in SCr from baseline values); SCr, serum creatinine; A1M, α1-microglobulin; AAG, α1-acid glycoprotein; Alb, albumin; N/A, not applicable; pre-op, pre-operative; ND, not done.
Refers to peak intensity
Peak intensities of the identified urinary biomarkers on SELDI-TOF MS profiles were analyzed. There were no differences in peak intensities of any of the three biomarkers at baseline between the two groups, and the control group showed no significant change at 2 hours post-surgery. However, there was a significant increase in peak intensity of all three biomarkers in the AKI group at 2 hours post surgery (all p<0.001). In agreement with these findings, nephelometric measurements revealed a four-fold increase in α1-microglobulin, a ten-fold increase in α1-acid glycoprotein, and a three-fold increase in albumin within 2 hours of surgery in the AKI group when compared to the control group (all p<0.001). We therefore designed a prospective validation study to further define the diagnostic and prognostic properties of the identified biomarkers measured by nephelometry.
Findings of the Validation Set
The validation set included 365 children who met the inclusion and exclusion criteria. The demographic, clinical and laboratory characteristics are shown in Table 1. One hundred and thirty five patients (37%) met the criteria for AKI within a three day period. The increase in serum creatinine of 50% or greater from baseline was delayed by 2.2±0.74 days after cardiopulmonary bypass. Based on this primary outcome, we classified subjects into those with and without AKI. No significant differences were noted with respect to age, gender, race, or urine output. Within the AKI group, oliguria was noted in only seven (5%) subjects. Subjects that developed AKI were more likely to have had previous cardiac surgery, longer duration of cardiopulmonary bypass, and greater inotrope scores. The length of hospital stay and duration of AKI were significantly greater in the group with AKI (all p<0.001 by ANOVA and by t-test and non-parametric Wilcoxon test).
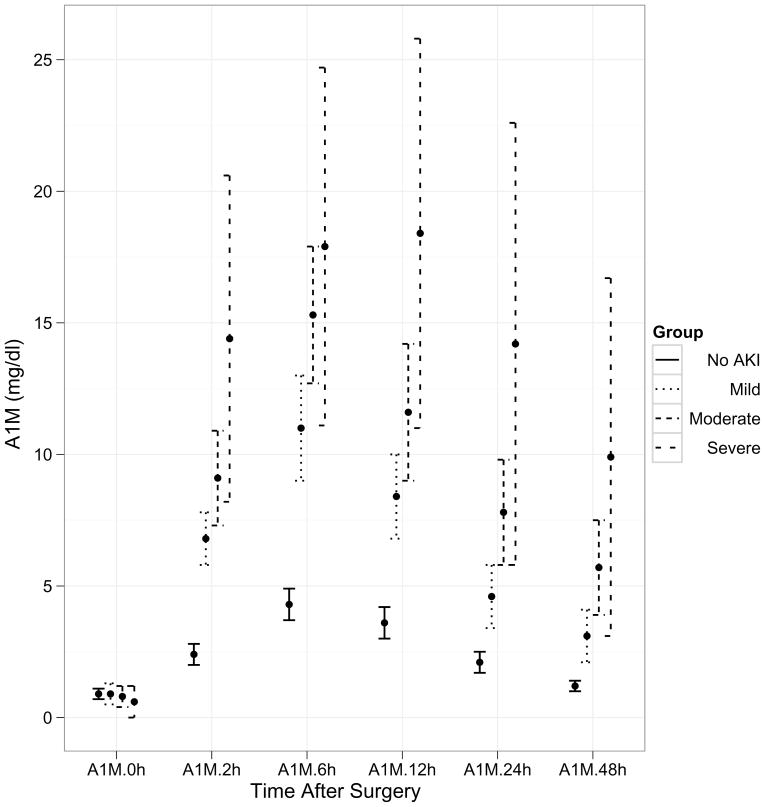
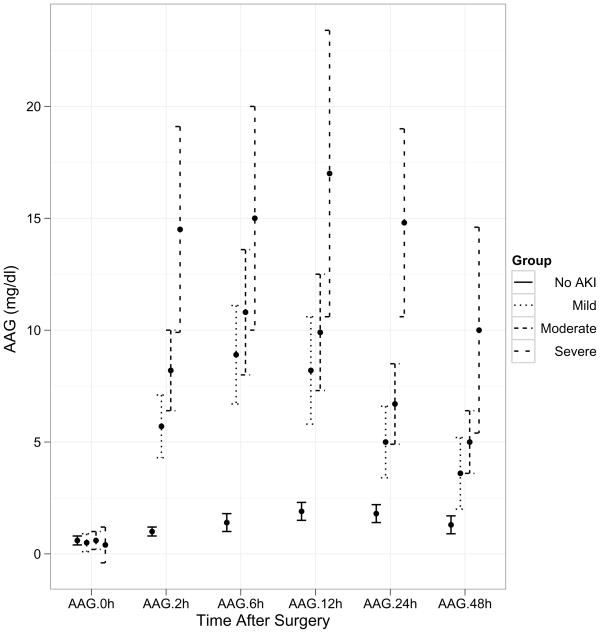
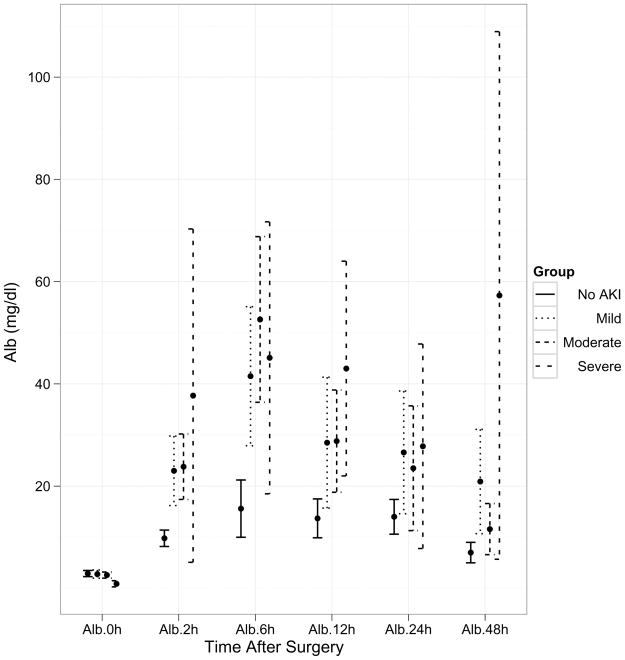
Within the AKI group, 44% displayed mild injury (50–99% increase in serum creatinine from baseline), 49% had moderate injury (≥100% increase in serum creatinine from baseline, and 7% were classified as severe injury (dialysis requirement or death during hospitalization). A time course of the pre- and post-operative values of the three biomarkers (α1-microglobulin, α1-acid glycoprotein, and albumin) is demonstrated in Figure 1. There was no difference in the biomarker values at baseline before surgery. However, post-operatively the biomarker concentrations were significantly different at all time-points between patients with and without AKI. The urine creatinine concentrations were not significantly different between patients with and without AKI at any of the time-points. The maximum separation of the biomarker concentrations between patients with and without AKI was evident at 6 hours after surgery, although all four biomarkers were significantly increased within 2 hours of initiation of cardiopulmonary bypass (all p<0.001 by ANOVA and by t-test and non-parametric Wilcoxon test). By additional mixed model analysis, there was a significant time effect indicating that each of the biomarkers was changing across time (p<0.001). There was also a significant group effect indicating that each biomarker is increased in the AKI group (P<0.001).
Figure 1.
Trends over time of the three biomarkers by severity of AKI after cardiopulmonary bypass. Values represent means±SEM for biomarker levels at each time-point. X axis represents various time-points in the validation set. Post-operative concentrations of all three biomarkers were significantly higher at all time-points between the four groups of severity of AKI (P<0.001). 1a: AIM (α1-microglobulin), 1b: AAG (α1-acid glycoprotein), 1c: Alb (albumin).
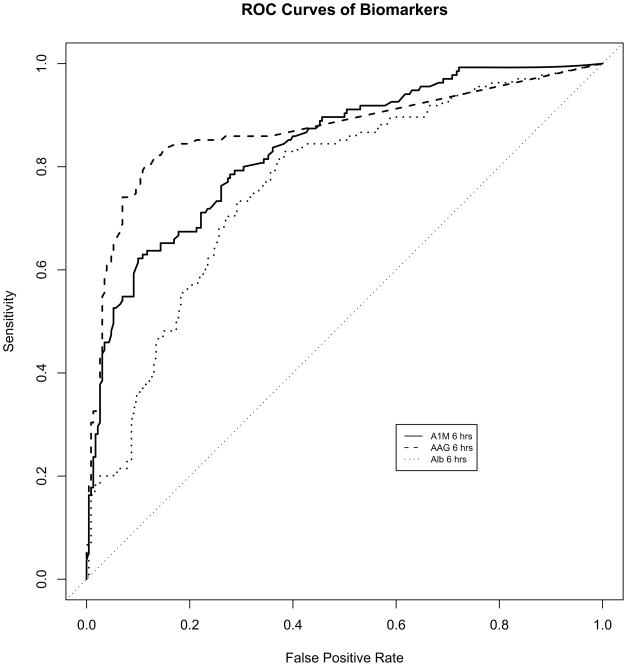
Table 2 lists the area under the receiver-operating characteristic curves (AUCs) for the prediction of AKI at different early time points following initiation of cardiopulmonary bypass, for the three biomarkers examined as well as other clinical parameters. The AUCs for urine α1-microglobulin, α1-acid glycoprotein, and albumin were optimal when measured at 6 hours after cardiopulmonary bypass, at 0.84 (CI 0.79–0.89), 0.87 (CI 0.83–0.91), and 0.76 (CI 0.71–0.81) respectively, as shown in Figure 2. The AUCs did not differ if the values were corrected for urine creatinine concentration (not shown). Due to the robustness of each biomarker, the AUC’s could also not be significantly improved when multiple combinations of these biomarkers were evaluated (not shown). The derived sensitivities, specificities, and predictive values at different cutoff concentrations for the urinary biomarkers measured at 6 hours after cardiopulmonary bypass in the validation set are shown in Table 3.
TABLE 2.
AUC analysis for the prediction of AKI following CPB
| Time post-CPB | Urine A1M | Urine AAG | Urine Alb | Urine Cr | CPB time | Inotrope score |
|---|---|---|---|---|---|---|
| 2 h | 0.85 (0.80–0.90) | 0.85 (0.80–0.90) | 0.69 (0.63–0.75) | 0.53 (0.47–0.59) | 0.71 (0.65–0.77) | 0.65 (0.59–0.71) |
| 6 h | 0.84 (0.79–0.89) | 0.87 (0.83–0.91) | 0.76 (0.71–0.81) | 0.52 (0.46–0.58) | ||
| 12 h | 0.78 (0.73–0.83) | 0.80 (0.75–0.85) | 0.68 (0.62–0.74) | 0.55 (0.49–0.61) | ||
| 24 h | 0.76 (0.71–0.81) | 0.70 (0.64–0.76) | 0.64 (0.58–0.70) | 0.58 (0.52–0.64) |
CPB time and inotrope score are not temporally related, and are available at all times post-CPB.
CPB, cardiopulmonary bypass; Cr, creatinine; AKI, acute kidney injury; AUC, area under the receiver operating characteristic curve. A1M, α1-microglobulin; AAG, α1-acid glycoprotein; Alb, albumin.
Figure 2.
Receiver-operating characteristic curves showing diagnostic accuracy of the novel biomarkers for the prediction of AKI when measured at 6 hours post-CPB. AIM, α1-microglobulin; AAG, α1-acid glycoprotein; Alb, albumin.
TABLE 3.
Urinary biomarker characteristics for prediction of AKI after CPB
| Biomarker (Time post-CPB) | Cut-off (mg/dl) | Sensitivity | Specificity | PPV | NPV |
|---|---|---|---|---|---|
| A1M (6 h) | 2.4 | 0.95 | 0.37 | 0.47 | 0.92 |
| 9.0 | 0.61 | 0.90 | 0.79 | 0.80 | |
| 12.7 | 0.48 | 0.95 | 0.85 | 0.76 | |
| AAG (6 h) | 2.0 | 0.86 | 0.73 | 0.66 | 0.90 |
| 4.0 | 0.79 | 0.89 | 0.81 | 0.83 | |
| 5.8 | 0.63 | 0.95 | 0.88 | 0.81 | |
| Alb (6 h) | 1.2 | 0.95 | 0.25 | 0.43 | 0.89 |
| 10.0 | 0.73 | 0.70 | 0.60 | 0.82 | |
| 70.0 | 0.20 | 0.95 | 0.73 | 0.67 |
CPB, cardiopulmonary bypass; Alb, albumin; A1M, α1-microglobulin; AAG, α1-acid glycoprotein; PPV, positive predictive value; NPV, negative predictive value. The reported cut-offs were chosen for 95% sensitivity, 95% specificity, and optimal sensitivity and specificity.
We performed univariate and multivariate logistic regression analysis of the biomarkers as well as clinical factors for the prediction of AKI (Table 4). We first constructed a logistic model with baseline clinical risk factors and CPB time. We then built a model with the addition of α1-microglobulin levels at 6 hours, to compare with the reference model using the log-likelihood ratio test. This yielded a significant p-value < 0.001. This procedure was repeated for α1-acid glycoprotein at 6 hours, and albumin at 6 hours, respectively. All p-values were < 0.001. Thus, each of these markers provided additional information as compared to clinical risk factors alone. By multivariate analysis, previous surgery, age, gender and race were not significant in assisting with the diagnosis of AKI. Cardiopulmonary bypass time and the biomarker concentrations at 6 hours after surgery were strong independent predictors of AKI. A value of >4 mg/dl for urine α1-acid glycoprotein was the strongest independent predictor of AKI, with an adjusted odds ratio of 12.87 (CI 6.25–25.41), followed by a value of >9 mg/dl for urine α1-microglobulin (adjusted odds ratio 4.03, CI 1.88–8.63).
TABLE 4.
Univariate and multivariate analysis of factors used to differentiate patients with and without AKI after CPB
| Variable | Unadjusted P-value | Unadjusted OR (95% CI) | Adjusted P-value | Adjusted OR (95% CI) |
|---|---|---|---|---|
| Age (/y) | 0.6 | 0.98 (0.94–1.03) | 0.9 | 1.00 (0.93–1.08) |
| Gender (male) | 0.9 | 1.00 (0.65–1.52) | 0.5 | 1.26 (0.67–2.37) |
| Race (black) | 0.4 | 0.75 (0.41–1.39) | 0.5 | 0.79 (0.33–1.86) |
| Previous surgery with CPB | 0.02 | 1.70 (1.08–2.58) | 0.9 | 0.99 (0.51–1.94) |
| CPB time (>100 min) | <0.001 | 3.60 (2.30–5.72) | <0.001 | 3.37 (1.74–6.54) |
| A1M at 6 h (>9 mg/dl) | <0.001 | 14.5 (8.23–25.5) | <0.001 | 4.03 (1.88–8.63) |
| AAG at 6 h (>4 mg/dl) | <0.001 | 30.0 (16.7–53.7) | <0.001 | 12.87 (6.52–25.41) |
| Alb at 6 h (>10 mg/dl) | <0.001 | 6.7 (4.16–10.77) | 0.003 | 2.9 (1.51–5.60) |
AKI, acute kidney injury; CI, confidence interval; CPB, cardiopulmonary bypass; A1M, α1-microglobulin; AAG, α1-acid glycoprotein; Alb, albumin; OR, odds ratio
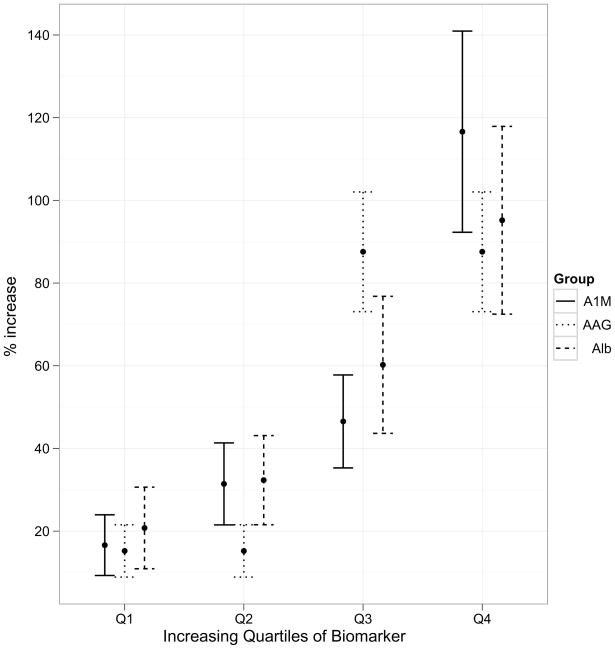
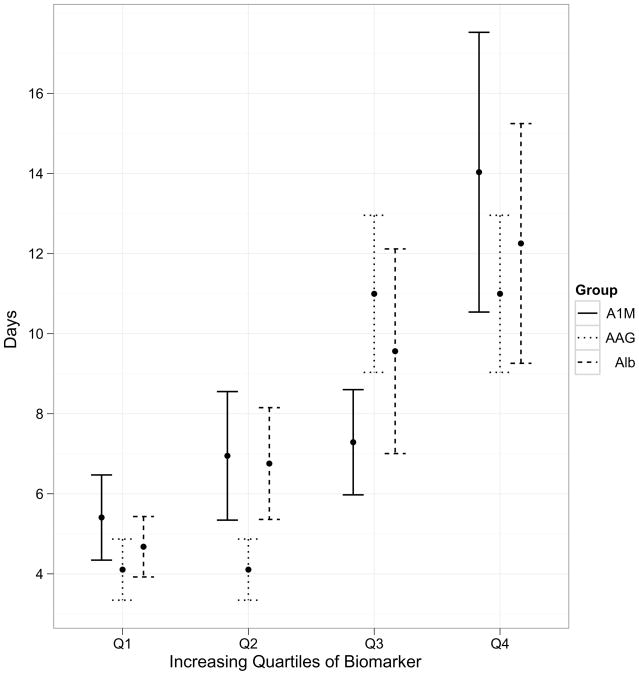
We created quartiles of biomarkers in order to demonstrate their prognostic potential with respect to clinical outcomes. The increasing quartiles of biomarkers demonstrated worsening severity for clinical outcomes, such as rise in serum creatinine (Figure 3a), length of hospital stay (Figure 3b) and duration of AKI (figure not shown, all P<0.001). Baseline or peak serum creatinine did not offer any prognostic potential for length of hospital stay.
Figure 3.
Association of quartiles of biomarker levels with severity of clinical outcomes. All the associations of biomarkers with outcomes are significant at P<0.005. 3a, association of biomarkers with increase in serum creatinine; 3b, association of biomarkers with length of hospital stay.
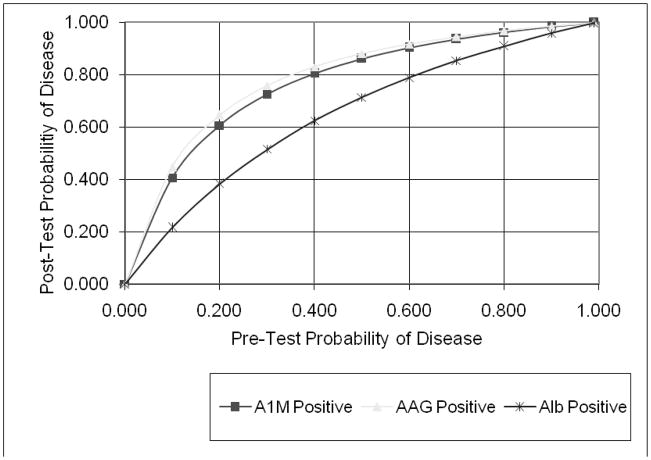
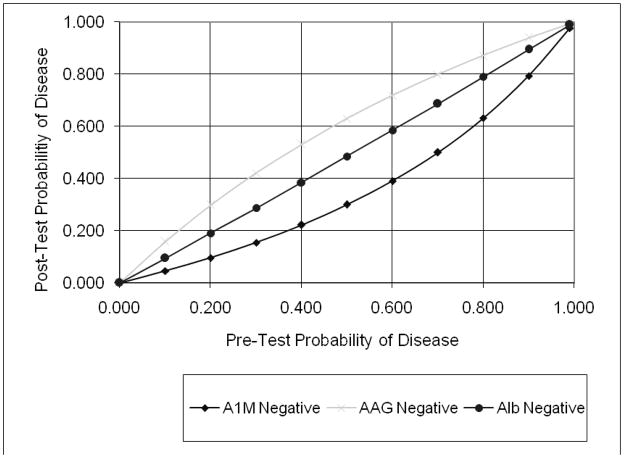
In order to illustrate the applicability of these results to individual patients, we plotted the conditional probabilities of the change in diagnosis of AKI following availability of the test results (15). Figure 4a shows the increase in post-test probability if the test results were positive, i.e. higher than the suggested optimal cut-off. Figure 4b illustrates the decrease in post-test probability if the tests were negative. We noted a substantial change in the intermediate zone of pre-test probability (30–70%), where the post-test probability of AKI is dramatically improved over and above the clinical diagnosis.
Figure 4.
Conditional probability of the three biomarkers in the setting of AKI after cardiopulmonary bypass. Initial assessment of the likelihood of disease (pre-test probability) was estimated, a test performed to shift suspicion one way or the other, and a final assessment of disease likelihood determined (post-test probability). AIM, α1-microglobulin; AAG, α1-acid glycoprotein; Alb, albumin. The lines in the graphs represent the likelihood ratios (LR) for each of the tests at their optimal cut-offs, as an estimate of how much one should shift clinical suspicion for a particular test result. Since tests can be positive or negative, there are at least two LRs for each test. In Figure 4a, the positive LR estimates the increase in disease probability if the test is positive. In Figure 4b, the negative LR estimates the decrease in disease probability if the test is negative. There are several scenarios when the pre-test probability of AKI is between 30–70% where the post-test probability of AKI is dramatically changed based on the biomarker test result.
DISCUSSION
The findings in this study describe the unbiased identification, initial testing, and systematic validation of three urinary biomarkers of AKI after cardiopulmonary bypass, elucidated through recently established phases of the diagnostic test development process (16–18). The three biomarkers demonstrated excellent separation at all post-operative time points between patients with and without AKI. When accuracy was assessed by receiver-operating characteristic curves, these biomarkers performed in the very good (for albumin) to excellent (for α1-microglobulin and α1-acid glycoprotein) range. The biomarkers also demonstrated excellent prognostic potential such that increasing quartiles of biomarker concentrations were associated with duration of AKI and length of hospital stay.
We employed a temporally predictable human model of AKI to uncover and validate these biomarkers, namely subjects undergoing cardiopulmonary bypass, the most frequent major surgical procedure performed in hospitals worldwide. AKI requiring dialysis represents the strongest independent risk factor for death in these patients (19). Even a minor degree of post-operative AKI as manifest by only a 0.2–0.3 mg/dl rise in serum creatinine from baseline is associated with a significant increase in mortality after cardiac surgery in adult cohorts (20). Additionally, AKI after adult cardiac surgery is associated with adverse outcomes such as prolonged intensive care and hospital stay, dialysis dependency, and increased long-term mortality (21–22). Children with congenital heart diseases may be especially vulnerable to developing AKI, since many require multiple surgeries for step-by-step repair of complex congenital anomalies. Indeed, the incidence of AKI in the validation set was 37%, similar to that previously reported in pediatric cardiac surgery cohorts (11–13, 23).
α1-microglobulin (A1M) is a 27 kDa glycoprotein produced in the liver. It’s biological functions remain unclear (24). It is freely filtered by the glomerulus and efficiently reabsorbed by the proximal tubule. A previous study (25) has shown that in adult patients with established acute kidney injury, an increase in urinary A1M predicted subsequent requirement of renal replacement therapy, with an AUC of 0.86 (CI 78–0.92). In a study of adults presenting to the emergency department (26), a single measurement of urinary A1M predicted the subsequent development of acute kidney injury, with an AUC of 0.89 (CI 0.84–0.93). A recent study of adults undergoing coronary artery bypass grafting revealed urinary A1M to be significantly elevated within 1 hour of initiating cardiopulmonary bypass in subjects who subsequently developed AKI (10), but biomarker characteristics were not reported. The findings reported herein validate A1M as a promising urinary biomarker for the prediction of AKI and its outcomes after cardiopulmonary bypass. However, the reported presence of urinary A1M in subjects with chronic glomerular disorders (8) as well in patients with sepsis (27) may limit the utility of this biomarker.
α1-acid glycoprotein is a 43 kDa acute phase reactant glycoprotein synthesized primarily in the liver. It has two major biological functions – transport of endogenous substances and an immunomodulatory role (28). Measurement of urinary α1-acid glycoprotein in adults presenting to the emergency department (26) predicted the subsequent development of acute kidney injury, with an AUC of 0.83 (CI 0.77–0.89). Our findings reported herein validate α1-acid glycoprotein as an excellent urinary biomarker for the prediction of AKI and its clinical outcomes in the pediatric cardiac surgical population. However, increases in urinary α1-acid glycoprotein concentrations have also been reported in nephrotic syndrome (8), acute inflammation (28), and type 2 diabetes with normal glomerular filtration rates (29).
Microalbuminuria is a well known consequence of many acute conditions, even in the absence of kidney injury. Postulated mechanisms include acute changes in capillary permeability (30) and an inflammatory insult (31). Studies have shown the predictive role of microalbuminuria for the development of multi-organ failure and mortality in critically ill subjects (32, 33). The results reported here identify and validate the potential utility of microalbuminuria as a simple and widely available test for the early diagnosis and prognosis of AKI after cardiopulmonary bypass.
This study has several strengths. First, we employed a prospective cohort design of children undergoing cardiopulmonary bypass, with distinct testing and validation datasets. Our homogeneous cohort of pediatric subjects with normal baseline kidney function in whom the only obvious etiology for AKI would be the result of cardiopulmonary bypass comprises an ideal population for the initial discovery and validation of AKI biomarkers (34). Second, the biomarkers themselves were uncovered using an unbiased, proteomic approach. Fortunately, all three identified biomarkers could be measured non-invasively by widely available clinical platforms, which accelerated the progress from discovery to validation.
This study also has important limitations. First, the SELDI-TOF MS proteomic technique has several shortcomings. It has limited sensitivity for the detection of proteins above the 10–20 kDa range, and other proteomic platforms will be necessary to explore the entire urine proteome in greater detail. SELDI-TOF MS is also only semi-quantitative, due to ion suppression effects that can confound mass-charge ratios. Second, our results will need to be validated in a larger randomized prospective trial, including adults undergoing cardiopulmonary bypass, in whom the biomarker performance may differ (23, 35, 36). Third, ours was a cohort with normal kidney function at recruitment, and it will be important to confirm our findings in documented high-risk settings such as pre-existing kidney dysfunction, diabetes mellitus, and concomitant nephrotoxic drug use. Fourth, the definition of AKI was based on elevations in serum creatinine, which raises the conundrum of using a flawed outcome variable to analyze the performance of novel biomarkers. This study may have yielded different results had there been a true “gold standard” for AKI. Instead, using a change in serum creatinine potentially sets up the biomarkers for lack of accuracy due to either false positives (true tubular injury but no significant change in serum creatinine) or false negatives (absence of true tubular injury, but elevations in serum creatinine due to pre-renal or other causes).
Finally, simultaneous examination of other urinary biomarkers as potential predictors of AKI may provide additional information (5). Recent studies have uncovered other AKI biomarkers such as neutrophil gelatinase-associated lipocalin (NGAL) (23, 36, 37), interleukin 18 (IL-18) (38) and kidney injury molecule 1 (KIM-1) (39) in clinical cohorts similar to that employed in this study. A collection of strategically selected candidates, perhaps including the three biomarkers reported herein, may prove of value for early and rapid diagnosis of AKI. Experimental studies continue to reveal therapies such as growth factors, stem cells, anti-apoptotic, anti-inflammatory, and anti-oxidant approaches that are effective in early AKI (6). It is anticipated that emerging biomarker panels will enable these promising agents to be investigated in humans with AKI, especially in temporally defined clinical situations such as subjects undergoing cardiopulmonary bypass.
Supplementary Material
Figure S1: Association of biomarker levels at 6 hours with severity of clinical outcomes, including (A) percent increase in serum creatinine, and (B) length of hospital stay in days. The linear regression models were fitted withthe outcomes to the biomarkers and the fitted regression lines were plotted. All the associations of biomarker with outcomes are significant at P<0.001. X axis is concentration of each biomarker in mg/dl.
Acknowledgments
Support: This study was supported by grants from the National Institutes of Health (R01 HL08676, R01 HL085757, R01 DK069749) and a Translational Research Initiative Grant from Cincinnati Children’s Hospital Medical Center.
Footnotes
Note: The supplementary material accompanying this article (doi:_______) is available at www.ajkd.org.
Financial Disclosure: Dr Devarajan and Cincinnati Children’s Hospital Medical Center have submitted a provisional patent application for the use of urine A1M, α1-acid glycoprotein, and albumin for the early diagnosis of AKI. Dr Devarajan is a co-inventor on patents related to NGAL as a biomarker of AKI, and is a consultant to Abbott Diagnostics and Biosite, Inc. Dr Parikh is a co-inventor on patents related to IL-18 as a biomarker of AKI, and is a consultant to Abbott Diagnostics.
Publisher's Disclaimer: This is a PDF file of an unedited manuscript that has been accepted for publication. As a service to our customers we are providing this early version of the manuscript. The manuscript will undergo copyediting, typesetting, and review of the resulting proof before it is published in its final citable form. Please note that during the production process errors may be discovered which could affect the content, and all legal disclaimers that apply to the journal pertain.
References
- 1.Chertow GM, Soroko SH, Paganini EP, et al. Mortality after acute renal failure: models for prognostic stratification and risk adjustment. Kidney Int. 2006;70:1120–1126. doi: 10.1038/sj.ki.5001579. [DOI] [PubMed] [Google Scholar]
- 2.The VA/NIH Acute Renal Failure Trial Network. Intensity of renal support in critically ill patients with acute kidney injury. N Engl J Med. 2008;359:7–20. doi: 10.1056/NEJMoa0802639. [DOI] [PMC free article] [PubMed] [Google Scholar]
- 3.Lameire N, Van Biesen W, Vanholder R. Acute renal failure. Lancet. 2005;365:417–430. doi: 10.1016/S0140-6736(05)17831-3. [DOI] [PubMed] [Google Scholar]
- 4.Uchino S, Kellum JA, Bellomo R, et al. Acute renal failure in critically ill patients: a multinational, multicenter study. JAMA. 2005;294:813–818. doi: 10.1001/jama.294.7.813. [DOI] [PubMed] [Google Scholar]
- 5.Lameire N, Van Biesen W, Vanholder R. Acute kidney injury. Lancet. 2008;372:1863–1865. doi: 10.1016/S0140-6736(08)61794-8. [DOI] [PubMed] [Google Scholar]
- 6.Devarajan P. Update on mechanisms of ischemic acute kidney injury. J Am Soc Nephrol. 2006;17:1503–20. doi: 10.1681/ASN.2006010017. [DOI] [PubMed] [Google Scholar]
- 7.Vanhoutte KJ, Laarakkers C, Marchiori E, et al. Biomarker discovery with SELDI-TOF-MS in human urine associated with early renal injury: evaluation with computational analytical tools. Nephrol Dial Transplant. 2007;22:2932–2943. doi: 10.1093/ndt/gfm170. [DOI] [PubMed] [Google Scholar]
- 8.Varghese SA, Powell TB, Budisavljevic MN, et al. Urine biomarkers predict the cause of glomerular disease. J Am Soc Nephrol. 2007;18:913–922. doi: 10.1681/ASN.2006070767. [DOI] [PMC free article] [PubMed] [Google Scholar]
- 9.Rossing K, Mischak H, Dakna M, et al. Urinary proteomics in diabetes and CKD. J Am Soc Nephrol. 2008;19:1283–1290. doi: 10.1681/ASN.2007091025. [DOI] [PMC free article] [PubMed] [Google Scholar]
- 10.Ho J, Lucy M, Krokhin O, et al. Mass spectrometry-based proteomic analysis of urine in acute kidney injury following cardiopulmonary bypass: a nested case-control study. Am J Kidney Dis. 2009;53:584–595. doi: 10.1053/j.ajkd.2008.10.037. [DOI] [PubMed] [Google Scholar]
- 11.Nguyen MT, Ross GF, Dent CL, Devarajan P. Early prediction of acute renal injury using urinary proteomics. Am J Nephrol. 2005;25:318–326. doi: 10.1159/000086476. [DOI] [PubMed] [Google Scholar]
- 12.Nguyen MT, Dent CL, Ross GF, et al. Urinary aprotinin as a predictor of acute kidney injury after cardiac surgery in children receiving aprotinin therapy. Pediatr Nephrol. 2008;23:1317–1326. doi: 10.1007/s00467-008-0827-9. [DOI] [PubMed] [Google Scholar]
- 13.Dent CL, Ma Q, Dastrala S, et al. Plasma neutrophil gelatinase-associated lipocalin predicts acute kidney injury, morbidity and mortality after pediatric cardiac surgery: a prospective uncontrolled cohort study. Crit Care. 2007;11(6):R127. doi: 10.1186/cc6192. [DOI] [PMC free article] [PubMed] [Google Scholar]
- 14.Pickering JW, Endre ZH. GFR shot by RIFLE: errors in staging acute kidney injury. Lancet. 2009;373:1318–1319. doi: 10.1016/S0140-6736(09)60751-0. [DOI] [PubMed] [Google Scholar]
- 15.Maceneaney PM, Malone DE. The meaning of diagnostic test results: a spreadsheet for swift data analysis. Clin Radiol. 2000;55:227–235. doi: 10.1053/crad.1999.0444. [DOI] [PubMed] [Google Scholar]
- 16.Pepe MS, Feng Z, Janes H, Bossuyt PM, Potter JD. Pivotal evaluation of the accuracy of a biomarker used for classification or prediction: standards for study design. J Natl Cancer Inst. 2008;100:1432–1438. doi: 10.1093/jnci/djn326. [DOI] [PMC free article] [PubMed] [Google Scholar]
- 17.Pepe MS, Etzioni R, Feng Z, et al. Phases of biomarker development for early detection of cancer. J Natl Cancer Inst. 2001;93:1054–1061. doi: 10.1093/jnci/93.14.1054. [DOI] [PubMed] [Google Scholar]
- 18.Knepper MA. Common sense approaches to urinary biomarker study design. J Am Soc Nephrol. 2009;20:1175–1178. doi: 10.1681/ASN.2009030321. [DOI] [PMC free article] [PubMed] [Google Scholar]
- 19.Chertow GM, Levy EM, Hammermeister KE, Grover F, Daley J. Independent association between acute renal failure and mortality following cardiac surgery. Am J Med. 1998;104:343–348. doi: 10.1016/s0002-9343(98)00058-8. [DOI] [PubMed] [Google Scholar]
- 20.Lassnigg A, Schmidlin D, Mouhieddine M, et al. Minimal changes of serum creatinine predict prognosis in patients after cardiothoracic surgery: a prospective cohort study. J Am Soc Nephrol. 2004;15:1597–1605. doi: 10.1097/01.asn.0000130340.93930.dd. [DOI] [PubMed] [Google Scholar]
- 21.Mangano CM, Diamondstone LS, Ramsay JG, Aggarwal A, Herskowitz A, Mangano DT. Renal dysfunction after myocardial revascularization: risk factors, adverse outcomes, and hospital resource utilization. The Multicenter Study of Perioperative Ischemia Research Group. Ann Intern Med. 1998;128:194–203. doi: 10.7326/0003-4819-128-3-199802010-00005. [DOI] [PubMed] [Google Scholar]
- 22.Loef BG, Epema AH, Smilde TD, et al. Immediate postoperative renal function deterioration in cardiac surgical patients predicts in-hospital mortality and long-term survival. J Am Soc Nephrol. 2005;16:195–200. doi: 10.1681/ASN.2003100875. [DOI] [PubMed] [Google Scholar]
- 23.Mishra J, Dent C, Tarabishi R, et al. Neutrophil gelatinase-associated lipocalin (NGAL) as a biomarker for acute renal injury after cardiac surgery. Lancet. 2005;365:1231–1238. doi: 10.1016/S0140-6736(05)74811-X. [DOI] [PubMed] [Google Scholar]
- 24.Penders J, Delanghe JR. Alpha-1 microglobulin: clinical laboratory aspects and applications. Clin Chim Acta. 2004;346:107–118. doi: 10.1016/j.cccn.2004.03.037. [DOI] [PubMed] [Google Scholar]
- 25.Herget-Rosenthal S, Poppen D, Husing J, Marggraf G, et al. Prognostic value of tubular proteinuria and enzymuria in nonoliguric acute tubular necrosis. Clin Chem. 2004;50:552–558. doi: 10.1373/clinchem.2003.027763. [DOI] [PubMed] [Google Scholar]
- 26.Nickolas TL, O’Rourke MJ, Yang J, et al. Sensitivity and specificity of a single emergency department measurement of urinary neutrophil gelatinase-associated lipocalin for diagnosing acute kidney injury. Ann Intern Med. 2008;148:810–819. doi: 10.7326/0003-4819-148-11-200806030-00003. [DOI] [PMC free article] [PubMed] [Google Scholar]
- 27.Magid E, Guldager H, Hesse D, Christiansen MS. Monitoring urimary orosomucoid in acute inflammation: observations on urinary excretion of orosomucoid, albumin, α1-microglobulin, and IgG. Clin Chem. 2005;51:2052–2058. doi: 10.1373/clinchem.2005.055442. [DOI] [PubMed] [Google Scholar]
- 28.Bachtiar I, Santoso JM, Atmanegara B, et al. Combination of alpha-1-acid glycoprotein and alpha-fetoprotein as an improved diagnostic tool for hetatocellular carcinoma. Clin Chim Acta. 2009;399:97–101. doi: 10.1016/j.cca.2008.09.024. [DOI] [PubMed] [Google Scholar]
- 29.Christiansen MS, Hommel E, Friberg L, Mølvig J, Magid E, Feldt-Rasmussen B. Increased urinary orosomucoid excretion is not related to impaired renal function in patients with type 2 diabetes. J Diabetes Complications. 2008 Sep 23; doi: 10.1016/j.jdiacomp.2008.08.001. [Epub ahead of print] [DOI] [PubMed] [Google Scholar]
- 30.Gosling P, Brudney S, McGrath L, Riseboro S, Manji M. Mortality prediction at admission to intensive care: a comparison of microalbuminuria with acute physiology scores after 24 hours. Crit Care Med. 2003;31:98–103. doi: 10.1097/00003246-200301000-00016. [DOI] [PubMed] [Google Scholar]
- 31.Molnar Z, Szakmany T, Heigi P. Microalbuminuria does not reflect increased systemic capillary permeability in septic shock. Intensive Care Med. 2003;29:391–395. doi: 10.1007/s00134-003-1651-0. [DOI] [PubMed] [Google Scholar]
- 32.Abid O, Sun Q, Sugimoto K, Mercan D, Vincent JL. Predictive value of microalbuminuria in medical ICU patients. Chest. 2001;120:1984–1988. doi: 10.1378/chest.120.6.1984. [DOI] [PubMed] [Google Scholar]
- 33.Thorevska N, Sabahi R, Upadya A, Manthous C, Amoateng-Adjepong Y. Microalbuminuria in critically ill medical patients: prevalence, predictors, and prognostic significance. Crit Care Med. 2003;31:1075–1081. doi: 10.1097/01.CCM.0000059316.90804.0B. [DOI] [PubMed] [Google Scholar]
- 34.Goldstein SL. Pediatric acute kidney injury: it’s time for real progress. Pediatr Nephrol. 2006;21:891–895. doi: 10.1007/s00467-006-0173-8. [DOI] [PubMed] [Google Scholar]
- 35.Han WK, Wagener G, Zhu Y, Wang S, Lee HT. Urinary biomarkers in the early detection of acute kidney injury after cardiac surgery. Clin J Am Soc Nephrol. 2009;4:873–882. doi: 10.2215/CJN.04810908. [DOI] [PMC free article] [PubMed] [Google Scholar]
- 36.Bennett M, Dent CL, Ma Q, et al. Urine NGAL predicts severity of acute kidney injury after cardiac surgery: A prospective study. Clin J Am Soc Nephrol. 2008;3:665–673. doi: 10.2215/CJN.04010907. [DOI] [PMC free article] [PubMed] [Google Scholar]
- 37.Haase M, Bellomo R, Devarajan P, Schlattmann P, Haase-Fielitz A on behalf of the NGAL Meta-analysis Investigator Group. Am J Kidney Dis. 2009;54(6):1012–1024. doi: 10.1053/j.ajkd.2009.07.020. [DOI] [PubMed] [Google Scholar]
- 38.Parikh CR, Mishra J, Thiessen-Philbrook H, et al. Urinary IL-18 is an early predictive biomarker of acute kidney injury after cardiac surgery. Kidney Int. 2006;70:199–203. doi: 10.1038/sj.ki.5001527. [DOI] [PubMed] [Google Scholar]
- 39.Han W, Waikar SS, Johnson A, et al. Urinary biomarkers in the early diagnosis of acute kidney injury. Kidney Int. 2008;73:863–869. doi: 10.1038/sj.ki.5002715. [DOI] [PMC free article] [PubMed] [Google Scholar]
Associated Data
This section collects any data citations, data availability statements, or supplementary materials included in this article.
Supplementary Materials
Figure S1: Association of biomarker levels at 6 hours with severity of clinical outcomes, including (A) percent increase in serum creatinine, and (B) length of hospital stay in days. The linear regression models were fitted withthe outcomes to the biomarkers and the fitted regression lines were plotted. All the associations of biomarker with outcomes are significant at P<0.001. X axis is concentration of each biomarker in mg/dl.


