Abstract
Elevated plasma free fatty acid (FFA) levels in obesity may play a pathogenic role in the development of insulin resistance. However, molecular mechanisms linking FFA to insulin resistance remain poorly understood. Oxidative stress acts as a link between FFA and hepatic insulin resistance. NADPH oxidase 3 (NOX3)-derived reactive oxygen species (ROS) may mediate the effect of TNF-α on hepatocytes, in particular the drop in cellular glycogen content. In the present study, we define the critical role of NOX3-derived ROS in insulin resistance in db/db mice and HepG2 cells treated with palmitate. The db/db mice displayed increased serum FFA levels, excess generation of ROS, and up-regulation of NOX3 expression, accompanied by increased lipid accumulation and impaired glycogen content in the liver. Similar results were obtained from palmitate-treated HepG2 cells. The exposure of palmitate elevated ROS production and NOX3 expression and, in turn, increased gluconeogenesis and reduced glycogen content in HepG2 cells. We found that palmitate induced hepatic insulin resistance through JNK and p38MAPK pathways, which are rescued by siRNA-mediated NOX3 reduction. In conclusion, our data demonstrate a critical role of NOX3-derived ROS in palmitate-induced insulin resistance in hepatocytes, indicating that NOX3 is the predominant source of palmitate-induced ROS generation and that NOX3-derived ROS may drive palmitate-induced hepatic insulin resistance through JNK and p38MAPK pathways.
Keywords: Insulin Resistance, JNK, Oxidative Stress, p38 MAPK, Reactive Oxygen Species (ROS), Free Fatty Acids, HepG2, NADPH Oxidase 3, db/db Mice
Introduction
Type 2 diabetes is a multifaceted disease, marked by decreased glucose peripheral uptake, increased hepatic glucose production, and decreased insulin secretion and reduced insulin sensitivity (1). Insulin resistance, defined as a diminished ability of cells, such as adipocytes, skeletal muscle cells, and hepatocytes, to respond to the action of insulin, plays a central role in the development of several metabolic abnormalities and diseases, such as obesity, type 2 diabetes, and the metabolic syndrome (2, 3).
Insulin resistance is induced by several molecules, including glucose, insulin, free fatty acids (FFAs), and certain cytokines, such as TNF-α (4–6). Elevated plasma FFA levels, which often accompany obesity, may play a causal role in insulin resistance. However, molecular mechanisms linking FFA to insulin resistance remain poorly understood.
Oxidative stress has also been implicated in the pathogenesis of insulin resistance. It has been suggested that increased reactive oxygen species (ROS)3 levels are an important trigger for insulin resistance (7). Enhanced ROS production can lead to abnormal changes in intracellular signaling and development of insulin resistance (8). Also, oxidative stress has been proposed as a link between FFA and hepatic insulin resistance (9).
We recently found that NADPH oxidase 3 (NOX3)-derived ROS mediate the effect of TNF-α on hepatocytes, in particular the drop in cellular glycogen content (10). Here, we demonstrate the critical role of NOX3-derived ROS in insulin resistance in db/db mice and HepG2 cells treated with palmitate. We show novel data indicating that NOX3-derived ROS may drive palmitate-induced hepatic insulin resistance through JNK and p38MAPK pathways.
EXPERIMENTAL PROCEDURES
Animals
We obtained db/db mice (C57BL/KsJ) from the Peking University Health Science Center (originally purchased from Jackson Laboratory). Briefly, db/db mice (n = 5) and age-matched wild-type (WT) mice (n = 5) were fed a standard laboratory diet for 12 weeks in a temperature-controlled (20–24 °C) and humidity-controlled (45–55%) environment. A 12 h/12 h light/dark cycle was maintained. Blood samples were collected from hearts of mice for measurement of blood glucose, plasma FFA, glycohemoglobin, and insulin contents. Liver tissues were removed surgically and frozen immediately in liquid nitrogen for further analysis. All animal procedures were performed in accordance with the National Institutes of Health Animal Care and Use Guidelines. All animal protocols were approved by the Animal Ethics Committee at the Beijing Institute of Geriatrics.
Cell Culture
HepG2 cells (American Type Culture Collection) were cultured in minimum Eagle's medium (low glucose; Invitrogen) supplemented with 10% fetal bovine serum (Hyclone), 100 units/ml penicillin (Invitrogen), and 0.1 mg/ml streptomycin (Invitrogen). Cells were maintained at 37 °C with humidified air and CO2 (5%).
Analysis of Glycogen Contents
Glycogen levels were measured in cells or liver tissues incubated for 3 h in the presence of 1 nm insulin (Usbio), using a glycogen assay kit (Biovision).
Glucose Production Assay
Cells were washed three times with PBS to remove glucose, incubated for 16 h in 1 ml of glucose production medium (glucose- and phenol red-free DMEM containing gluconeogenic substrates, 20 mm sodium lactate, and 2 mm sodium pyruvate) and in the presence of 1 nm insulin (Usbio) during the last 3 h. A quantity of 300 μl of medium was sampled for measurement of glucose concentration using a glucose assay kit (Sigma). Glucose concentration was normalized with cellular protein concentration (11).
Determination of ROS
Cells (3 × 10⁵ cells/ml) were incubated with 5 μm 2′,7′-dichlorofluorescein diacetate (Sigma) for 40 min at 37 °C. The 2′,7′-dichlorofluorescein fluorescence was measured by FACS. The sections of OCT-embedded liver tissues were incubated with 10 μm DHE (Sigma) for 15 min at room temperature. The sections were analyzed by fluorescence microscopy.
Western Blot
Cell lysates (15–30 μg of protein) were separated by 10% SDS-PAGE, transferred to PVDF membrane (Millipore), blocked with 5% nonfat dry milk, and probed with antibodies at 4 °C overnight. The blots were incubated with HRP-conjugated anti-IgG, followed by detection with ECL (Santa Cruz Biotechnology, Inc., Santa Cruz, CA). Antibodies against IRS-1, phospho-IRS-1 (Ser307), p38MAPK, phospho-p38MAPK (Thr180/Tyr182), phospho-JNK (Thr183/Tyr185), JNK, Akt, phospho-Akt (Ser473), GSK, phospho-GSK (Ser9), PTEN, and phospho-PTEN (Ser380/Thr382/Thr383) were all purchased from Cell Signaling. Antibodies against NOX3, p22phox, p47phox, p67phox, Rac1, β-actin, FOXO1, phospho-FOXO1 (Ser256), and PEPCK were obtained from Santa Cruz Biotechnology, Inc.
Oil Red O Staining
After incubation in the presence or absence of palmitate for 24 h, confluent cell monolayer was fixed in phosphate-buffered formalin (10%) for 10 min, rinsed with water followed by 70% ethanol, and stained with Oil Red O solution (6 parts of saturated Oil Red O dye in isopropyl alcohol + 4 parts of water) for 15 min. Excess stain was removed by washing with 70% ethanol. The stained cells were finally washed with water. The cell monolayer was then incubated for 5 min with 1.5 ml of 4% Nonidet P-40 in isopropyl alcohol, which dissolved stained oil droplets. The absorbance of the dye-triglyceride complex was measured at 520 nm after suitable dilution.
siRNA Transfection
The siRNA targeting the human NOX3 mRNA was transfected into HepG2 cells using Tran MessengerTM transfection reagent (Qiagen) according to the manufacturer's instructions. A luciferase siRNA (FAM) was used as a negative control. RNAi oligonucleotides are as follows: for NOX3, 5′-ACACGGAUGAGUGAGCAGGTT-3′ (sense) and 5′-CCUGCUCACUCAUCCGUGUTT-3′ (antisense); for negative control FAM, 5′-UUCUCCGAACGUGUCACGUTT-3′ (sense) and 5′-ACGUGACACGUUCGGAGAATT-3′ (antisense).
Statistical Analysis
All values are represented as means ± S.D. of the indicated number of measurements. A one-way analysis of variance test was used to determine significance, requiring p < 0.05 for statistical significance.
RESULTS
The db/db Mice Display Increased Plasma Insulin and FFA and Elevated ROS Generation and Lipid Accumulation but Decreased Glycogen Levels in Liver
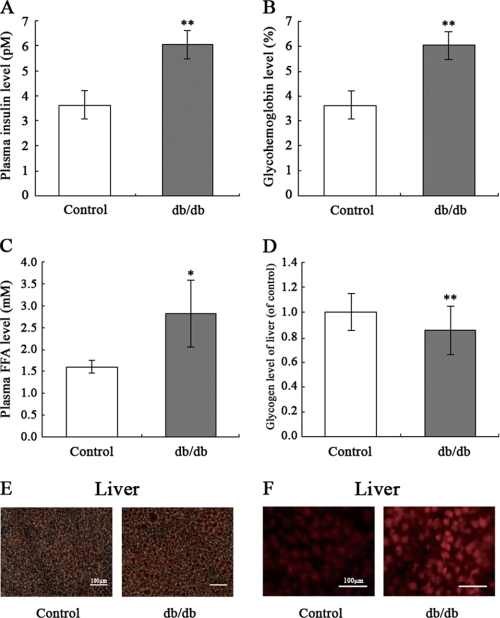
To examine the causal role of elevated plasma FFA levels in hepatic insulin resistance, db/db mice (n = 5) were fed a standard laboratory diet for 12 weeks. Plasma insulin levels in db/db mice were increased, suggesting compromised insulin sensitivity (Fig. 1A). Importantly, db/db mice displayed elevated glycohemoglobin levels (Fig. 1B) and plasma FFA levels (Fig. 1C). We also found that glycogen levels in the livers of db/db mice were significantly decreased, demonstrating a state of insulin resistance (Fig. 1D). It is noteworthy that Oil Red O staining for lipofuchsin shows lipid accumulation in the livers of db/db mice (Fig. 1E). ROS generation also was significantly elevated in the livers of db/db mice (Fig. 1F), suggesting that ROS may be a link between FFA and insulin resistance.
FIGURE 1.
Analysis of plasma insulin, glycohemoglobin, FFA, intracellular glycogen, and ROS in db/db mice. The db/db mice were fed a standard laboratory diet for 12 weeks. Plasma insulin (A), glycohemoglobin (B), plasma FFA (C), liver intracellular glycogen content (D), liver lipid accumulation assessed by Oil Red O staining (E), and liver ROS generation assessed by 2′,7′-dichlorofluorescein fluorescence (F) were measured. Data represent the means ± S.D. (error bars) (n = 5). *, p < 0.05; **, p < 0.01 versus control.
Palmitate Enhances ROS Production and Induced Insulin Resistance in HepG2 Hepatocytes
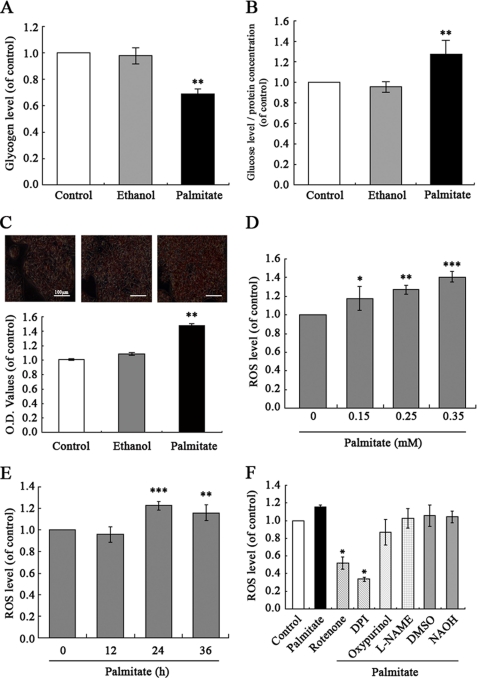
To extend these observations from db/db mice to a cellular model of insulin resistance, human HepG2 hepatocytes were treated with different concentrations of palmitate (0.15, 0.25, and 0.35 mm) to induce insulin resistance, as assessed by their decreased intracellular glycogen synthesis. We also quantified cell viability in different concentrations of palmitate-treated HepG2 by a 3-(4,5-dimethylthiazol-2-yl)-2,5-diphenyltetrazolium bromide assay to exclude the side effects associated with palmitate, such as apoptosis. The results indicate that glycogen content was significantly impaired, and no cytotoxicity was seen in connection with the time of exposure to palmitate (0.25 mm, 24 h) (data not shown). Therefore, we chose 0.25 mm palmitate used in HepG2 incubation. In previous studies, 0.25 mm palmitate was used to induce insulin resistance in the rat hepatocyte cell line H4IIEC3 (9). As shown in (Fig. 2A), glycogen content in HepG2 cells treated with palmitate (0.25 mm) for 24 h was significantly impaired. Exposure of HepG2 cells to palmitate enhanced gluconeogenesis, as shown by a glucose production assay (Fig. 2B). Similarly, Oil Red O staining shows increased lipid accumulation in HepG2 cells treated with palmitate (Fig. 2C). We next investigated whether ROS levels were altered by palmitate treatment. As shown in Fig. 2, D and E, ROS levels were increased in HepG2 cells by exposure to palmitate. In order to further assess the source of ROS production, we observed the effects of different inhibitors of ROS-generating systems: diphenyliodonium (NOX inhibitor; 2.5 μm), NG-nitro-l-arginine methyl ester (nitric-oxide synthase inhibitor; 50 μm), rotenone (mitochondrial respiratory chain inhibitor; 1 μm), and oxypurinol (xanthine oxidase inhibitor; 50 μm) on palmitate-induced increased ROS levels. Similarly, there was no cytotoxicity in HepG2 cells treated with inhibitors (data not shown). However, diphenyliodonium significantly and rotenone partially (but not NG-nitro-l-arginine methyl ester and oxypurinol) inhibited generation of ROS in response to palmitate (0.25 mm, 24 h) (Fig. 2F). These results suggest NOX as a leading candidate for production of ROS in HepG2 cells.
FIGURE 2.
Palmitate-induced increased ROS generation and insulin resistance in HepG2 hepatocytes. Exposure of human HepG2 hepatocytes to palmitate (0.25 mm) for 24 h decreased intracellular glycogen content (A) and increased gluconeogenesis (B) in the presence of 1 nm insulin (Usbio), and lipid accumulation (C) enhanced ROS generation in a dose- and time-dependent manner (D and E). NOX inhibitor diphenyliodonium (DPI; 2.5 μm) significantly inhibited generation of ROS in response to palmitate (F). Data represent means ± S.D. (error bars) (n = 3 independent experiments). *, p < 0.05; **, p < 0.01; ***, p < 0.01 versus control. L-NAME, NG-nitro-l-arginine methyl ester.
Palmitate Stimulates ROS Generation Mainly by Up-regulation of NOX3 in HepG2 Cells
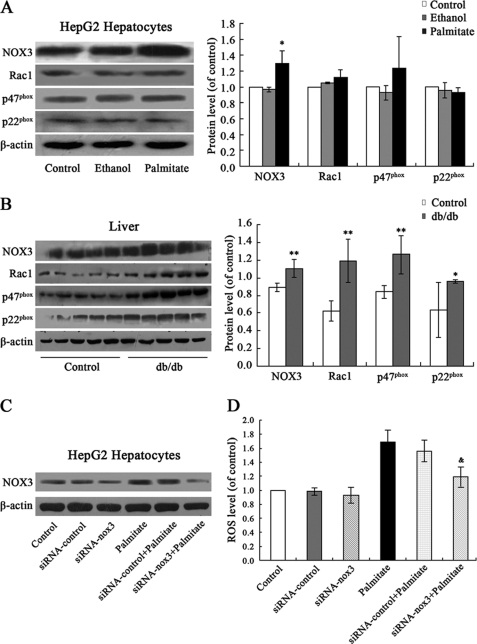
The members of NOX family, including NOX1, NOX2, NOX3, NOX4, and NOX5, have been identified in different tissues and cells (12). Using RT-PCR, we have found expression of NOX3 and subunits, such as p22phox, p67phox, p47phox, and Rac1 (but not NOX1, NOX2, NOX4, and NOX5) in HepG2 cells and rat hepatic tissue. In the present study, we examined effects of palmitate treatment on expression of NOX3 and subunits in HepG2 cells. As expected, palmitate significantly up-regulated expression of NOX3, but not Rac1, p47phox, and p22phox (Fig. 3A). However, NOX1, NOX2, NOX4, and NOX5 were also not expressed in palmitate-treated HepG2 cells (data not shown). The results show that palmitate increased ROS generation through up-regulation of NOX3 expression. Increased expression of NOX3, Rac1, p47phox, and p22phox, accompanied by elevated production of ROS, was also found in the livers of db/db mice (Fig. 3B).
FIGURE 3.
Palmitate stimulated ROS generation mainly by up-regulation of NOX3 in HepG2 cells. Shown are increased expression of NOX3, but not Rac1, p47phox, and p22phox, in HepG2 cells exposed to 0.25 mm palmitate for 24 h (A) and increased expression of NOX3, Rac1, p47phox, and p22phox in the livers of db/db mice (B), as shown by Western blot. Transfection of siRNA-NOX3 down-regulated the expression of NOX3 (C) and reduced the ROS production in HepG2 cells (D). Data represent means ± S.D. (error bars) (n = 3 independent experiments in HepG2 cells, n = 5 in db/db mice). *, p < 0.05; **, p < 0.01 versus control. &, p < 0.05 versus palmitate.
To further assess the role of NOX3 in palmitate-induced increased ROS generation in HepG2 cells, we generated the siRNA targeting NOX3 mRNA (siRNA-NOX3) and transfected them into HepG2 cells. Western blot analysis indicates that transfection with siRNA-NOX3 significantly down-regulates NOX3 expression both in control and in palmitate-treated cells, whereas control siRNA has no effect (Fig. 3C). Furthermore, transfection of siRNA-NOX3, but not control siRNA, significantly reduced ROS generation in HepG2 cells (Fig. 3D). Taken together, these observations point to NOX3 as the possible predominant source of ROS generation stimulated by palmitate.
Palmitate Induces Hepatic Insulin Resistance through JNK and p38MAPK Pathways
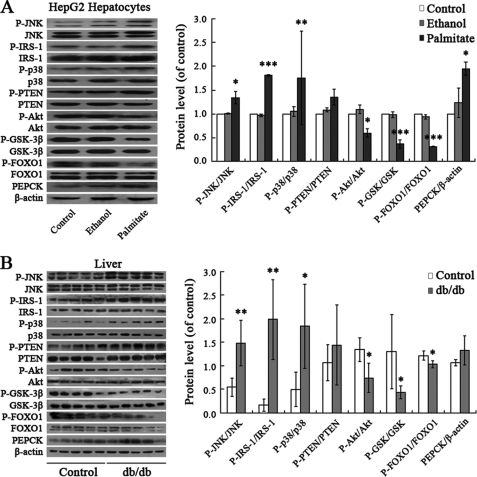
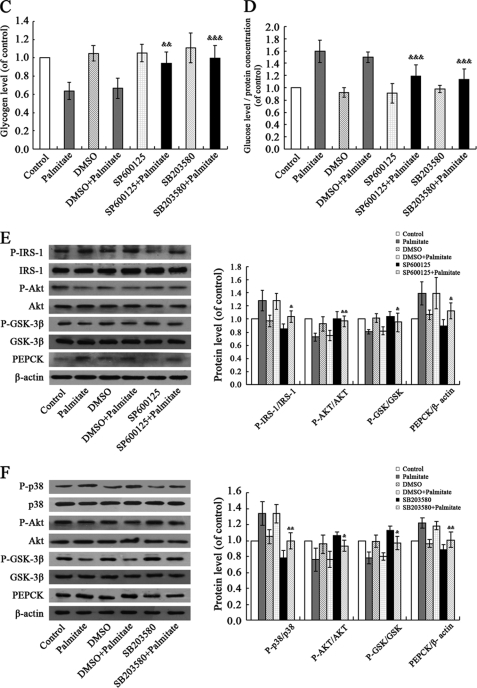
We then investigated what downstream pathways translate palmitate-induced elevated ROS levels into hepatic insulin resistance. ROS have been shown to induce various signaling pathways, including the p38MAPK, ERK, and JNK pathways. One attractive possibility is that ROS-induced insulin resistance is mediated by JNK. It is known that ROS promote activation of JNK (13). Inhibition of JNK activity through genetic knock-out or an inhibitor improves insulin sensitivity in mice (14). As shown in Fig. 4A, JNK was activated in response to palmitate treatment in HepG2 cells. In parallel with increased phosphorylation of JNK, phosphorylation of the residue Ser307 in IRS-1 was stimulated by palmitate treatment. Similarly, exposure to palmitate elevated the phosphorylation of p38MAPK and its downstream PTEN. Palmitate-induced activation of JNK and p38MAPK led to impaired phosphorylation of Akt, GSK, and FOXO1. Increased PEPCK levels in turn resulted in decreased glycogen synthesis and increased gluconeogenesis. These changes of JNK and p38MAPK pathways are consistent with data from db/db mice (Fig. 4B). To test if JNK and p38MAPK function as signaling intermediates in the cascade linking palmitate and hepatic insulin resistance, we further examined cellular glycogen levels in palmitate-stimulated HepG2 cells pretreated with JNK inhibitor SP600125 (10 μm) and p38MAPK inhibitor SB203580 (20 μm) for 30 min. As shown in Fig. 4, C and D, pretreatment of HepG2 cells with SP600125 or SB203580 can reverse decreased cellular glycogen levels and increased gluconeogenesis induced by palmitate. Effects of palmitate on activation of JNK and p38MAPK pathways were rescued via SP600125 and SB203580 treatment (Fig. 4, E and F). These results suggest that palmitate induced hepatic insulin resistance through JNK and p38MAPK pathways. This corroborates previous studies in rat hepatocyte H4IIEC3 (9).
FIGURE 4.
Palmitate induced hepatic insulin resistance through JNK and p38MAPK pathways. Palmitate (0.25 mm, 24 h) elevated phosphorylation of JNK, p38MAPK, PTEN, and IRS-1 (Ser307); impaired phosphorylation of AKT, GSK, and FOXO1; and increased PEPCK levels in HepG2 cells (A). Similar results were obtained from db/db mice (B). Pretreatment of HepG2 cells with JNK inhibitor SP600125 (10 μm) and p38MAPK inhibitor SB203580 (20 μm) for 30 min can reverse palmitate-induced decreased glycogen synthesis (C) and increased gluconeogenesis (D) and the activation of JNK and p38MAPK pathways (E and F). All experiments for analysis of IRS-1, AKT, GSK, FOXO1, and PEPCK in HepG2 cells were performed in the presence of 1 nm insulin. Data represent means ± S.D. (error bars) (n = 3 independent experiments in HepG2 cells; n = 5 in db/db mice). *, p < 0.05; **, p < 0.01; ***, p < 0.001 versus control. &, p < 0.05; &&, p < 0.01; &&&, p < 0.001 versus palmitate.
Restoring the Effects of Palmitate on Hepatic Insulin Resistance via siRNA-mediated Silencing of NOX3
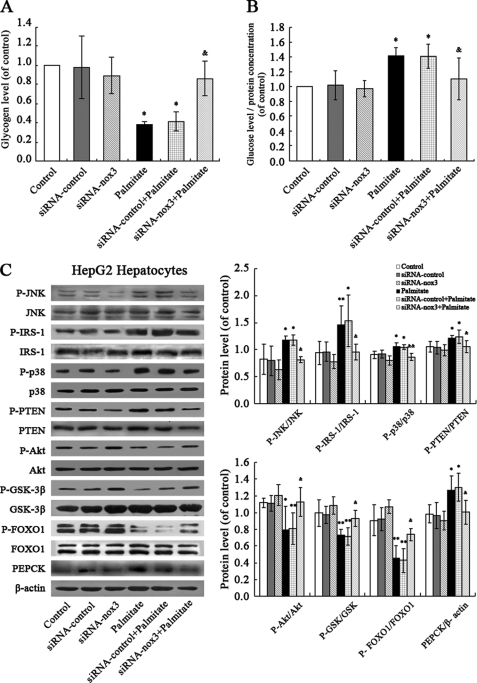
Cells transfected with siRNA-NOX3 were analyzed to further explore the role of NOX3 in palmitate-induced increased gluconeogenesis and decreased glycogen content in hepatocytes. The results show that NOX3 down-regulation suppressed palmitate-induced decreased glycogen synthesis and increased gluconeogenesis (Fig. 5, A and B). Effects of palmitate on activation of JNK and p38MAPK pathways were rescued via siRNA-mediated silencing of NOX3 (Fig. 5C).
FIGURE 5.
siRNA-NOX3 rescued palmitate-induced insulin resistance in HepG2 cells. NOX3 down-regulation suppressed palmitate-induced decreased glycogen synthesis (A) and increased gluconeogenesis (B) and rescued the effects of palmitate on activation of JNK and p38MAPK pathways (C). All experiments for analysis of IRS-1, AKT, GSK, FOXO1, and PEPCK were performed in the presence of 1 nm insulin. Data represent the means ± S.D. (error bars) (n = 3 independent experiments). *, p < 0.05; **, p < 0.01 versus control. &, p < 0.05; &&, p < 0.01 versus palmitate.
DISCUSSION
Insulin resistance precedes development of type 2 diabetes, which may occur in major metabolic tissues and organs, including muscle, adipose tissue, and liver. FFA has been proposed as a link between obesity and insulin resistance because there is an elevation of plasma FFA levels in obese animals and humans (15). Increased plasma concentrations of FFA lead to intramyocellular lipid accumulation in humans, suggesting that FFA may play a critical role in initiating and developing insulin resistance (16, 17). Our study found increased levels of insulin, glucose, and glycohemoglobin in blood, accompanied by elevated FFA levels in db/db mice. It is known that insulin resistance occurs in certain tissues, such as fat, muscle, and liver. But liver becomes resistant first, followed by muscle and, last, fat. Insulin resistance in the liver leads to impaired glycogen synthesis and failure to suppress glucose production (18). Plasma FFAs are composed of the saturated fatty acid palmitate (about 30–35%) and of the monounsaturated fatty acid oleate (about 40–50%). Thus, in vivo, the effects observed may have been caused by a mix of fatty acids or other plasma components. However, observational studies assessing fatty acid composition in serum or tissues suggest that insulin resistance is associated with relatively high intake of saturated fat (e.g. palmitic acid) and low intake of polyunsaturated fat (e.g. linoleic acid), findings that are supported by recent clinical data (19). Consumption of a high saturated fat diet decreased insulin sensitivity in comparison with a high monounsaturated fat diet (20). Because animal models of insulin resistance are complex and may be accompanied by alterations not restricted to the liver, it is difficult to determine the contribution of FFAs to hepatic insulin resistance. Therefore, the finding that db/db mice displayed a lipid accumulation and decreased glycogen content in the liver (Fig. 1, D and E), and the possibility that high levels of FFA may lead to hepatic insulin resistance need to be assessed in vitro. Importantly, it has been reported that a saturated fatty acid (palmitate) but not a monounsaturated fatty acid (oleate) induced insulin resistance in rat hepatocytes H4IIEC3 (9). Accordingly, we stimulated HepG2 cells with 0.25 mm palmitate for 24 h. The results indicate that palmitate treatment decreased glycogen content, increased gluconeogenesis, and increased lipid accumulation in HepG2 cells, suggesting a state of insulin resistance (Fig. 2, A–C).
What is the molecular link between FFA and insulin resistance? It is thought that oxidative stress may play an important role in decreasing insulin responsiveness (21, 22). Recently, it has also been shown that chronic exposure to elevated fatty acid concentrations can damage different types of cells by a variety of mechanisms, but oxidative stress may be a common link in cell dysfunction (23, 24). Increased FFA metabolism may also lead to increased ROS production. It has been reported that glucose or FFA initiates formation of ROS in muscle, adipocytes, and pancreatic β-cells (25–27). Our results show enhanced ROS production in the livers of db/db mice (Fig. 1F) and demonstrate that palmitate elevated ROS production in HepG2 cells (Fig. 2, D and E), resulting in hepatic insulin resistance. These observations suggest that ROS may be the link between FFA and insulin resistance. However, the data raised the issue of the source of ROS generation in palmitate-induced insulin resistance. It is thought that ROS are produced via multiple processes, such as mitochondrial electron transport chain, NOX, nitric-oxide synthase, and xanthine oxidase. Among these possibilities, recent attention has focused on NOX as a potential source of ROS production in insulin resistance conditions (28). By observing the effects of different inhibitors of ROS-generating systems, we demonstrate that NOX may be the predominant source of ROS in HepG2 cells, although rotenone, a mitochondrial respiratory chain inhibitor, may partially inhibit generation of ROS in response to palmitate (Fig. 2F). Recently, we analyzed the expression of NOX families in hepatocytes. RT-PCR indicated expression of NOX3 and subunits such as p22phox, p47phox, p67phox, and Rac1, but not NOX1, NOX2, NOX4, and NOX5, in HepG2 cells and rat hepatic tissue (10). Our study found a similar expression pattern of NOX and partners in hepatic tissue of db/db mice. Exposure of HepG2 to palmitate stimulated the generation of ROS and up-regulated the expression of NOX3 (Fig. 3A). It is noteworthy that increased NOX3 expression accompanied by elevated production of ROS was also found in the livers of db/db mice (Fig. 3B). NOX3 down-regulation by transfection of siRNA-NOX3 led to reduced ROS generation and, in turn, impaired insulin resistance in palmitate-treated HepG2 cells (Figs. 3D and 5, A and B). Taken together, we believe that this provides a strong argument for the critical role of NOX3-derived ROS in hepatic insulin resistance in HepG2 cells. However, determination of whether NOX3 is a source of ROS production in vivo and the mechanism by which palmitate up-regulates expression NOX3 will require further investigation.
It is well known that excessive levels of ROS not only directly damage cells by oxidizing DNA, protein, and lipid but also indirectly damage cells by activating a variety of stress-sensitive intracellular signaling pathways, such as NF-κB, p38MAPK, and JNK/SAPK (29, 30). Activation of these pathways results in increased expression of numerous gene products that may cause cellular damage and play a major role in insulin resistance (31–34). Accordingly, it has been proposed that there is a link among the FFA-induced increased ROS generation, activation of stress-sensitive pathways, and eventual development of insulin resistance.
Although the current in vitro study may not reflect the in vivo situation, there is strong evidence for oxidative stress-dependent changes in intracellular signaling, resulting in insulin resistance in vivo (35). From a mechanistic perspective, increased reactive molecules can trigger activation of stress-sensitive serine/threonine kinase signaling pathways, such as JNK and p38MAPK, that, in turn, phosphorylate multiple targets, including the insulin receptor and IRS proteins (36). Increased serine phosphorylation of IRS-1 reduces its ability to undergo tyrosine phosphorylation and may accelerate the degradation of IRS-1, followed by reduced Akt/protein kinase B phosphorylation. This offers a plausible explanation for the molecular basis of oxidative stress-induced decreased glycogen content in the liver (37). The link between Akt/protein kinase B and glycogen synthesis is established. It is demonstrated that Akt/protein kinase B phosphorylates and inhibits GSK-3 directly, which contributes to increased activation of glycogen synthase (38). GSK-3 is a serine/threonine protein kinase first identified by its ability to phosphorylate and inactivate glycogen synthase, the rate-limiting enzyme in glycogen synthesis (39), with important roles in the regulation of glycogen synthesis. Insulin administration results in serine phosphorylation and thus inactivation of GSK-3, thereby leading to an increase in glycogen synthase activity (40). However, oxidative stress-induced reduced Akt/protein kinase B phosphorylation leads to impaired phosphorylation of GSK, followed by suppressed glycogen synthase activity, resulting in decreased glycogen synthesis. Our results show that exposure of HepG2 cells to palmitate promoted phosphorylation of JNK and p38MAPK, leading to increased phosphorylation of the residue Ser307 in IRS-1 and PTEN, accompanied by decreased phosphorylation of Akt and GSK, followed by reduced glycogen content in HepG2 cells (Fig. 4A). Similar data of signaling pathway changes were obtained from db/db mice (Fig. 4B). Effects of palmitate on cellular glycogen levels and gluconeogenesis and activation of JNK/p38MAPK pathways were rescued via pretreatment of JNK inhibitor SP600125 (10 μm) and p38MAPK inhibitor SB203580 (20 μm) for 30 min (Fig. 4, C–F). Our results suggest that palmitate induced hepatic insulin resistance through JNK and p38MAPK pathways. However, it has been suggested that the effect on JNK and p38MAPK pathways is not specific to palmitate. It can also arise from exposure to other long- and medium-chain fatty acids (41–43). Interestingly, others have demonstrated that a saturated fatty acid (palmitate) but not a monounsaturated fatty acid (oleate) inhibited insulin-stimulated tyrosine phosphorylation of IRS2 and serine phosphorylation of Akt through JNK activation in rat H4IIEC3 cells (9). Most importantly, we found that palmitate-induced activation of JNK and p38MAPK was rescued by siRNA-mediated NOX3 reduction (Fig. 5C).
Regulation of hepatic gluconeogenesis is another important process in regulation of blood glucose levels, and pathological changes in glucose production of liver are a central characteristic in type 2 diabetes (44, 45). It is known that increased hepatic gluconeogenesis is induced by overexpression of PEPCK, a key gluconeogenic enzyme, and the catalytic subunit glucose-6-phosphatase, which is regulated by transcriptional and nontranscriptional mechanisms (46, 47). PEPCK catalyzes one of the rate-limiting steps of gluconeogenesis, the reaction of oxaloacetic acid to phosphoenolpyruvate, contributing to increased hepatic glucose output and elevated blood glucose levels in the initial stages of type 2 diabetes characterized by insulin resistance (48). Expression of PEPCK is regulated by Akt and FOXO1. Overexpression and activation of Akt in hepatoma cells and primary hepatocyte cultures decreases PEPCK gene transcription. It has been identified that FOXO1 mediates the observed suppression of PEPCK gene transcription by Akt (49). It is reported that phosphorylation of FOXO1 by Akt results in transcriptional inactivation and nuclear export of FOXO1. Reporter gene analysis demonstrated transactivation of the PEPCK promoter in vitro with FOXO1 binding. In addition, overexpression of a constitutively active FOXO1 mutant, which is resistant to inactivation by insulin, increased PEPCK expression and resulted in elevated fasting blood glucose concentrations (50). In our studies, reduced phosphorylation of FOXO1 and increased PEPCK expression, followed by elevated glucose output, were found in HepG2 cells treated by palmitate, demonstrating the hepatic gluconeogenesis state (Fig. 4A). The db/db mice also displayed reduced phosphorylation of FOXO1 and increased PEPCK expression in the liver (Fig. 4B).
In summary, as shown in Fig. 6, this study provides novel data that show the key role of NOX3-derived ROS in insulin resistance in HepG2 cells treated by palmitate. The effects of palmitate on hepatic insulin resistance are mediated by NOX3-derived ROS through JNK and p38MAPK pathways.
FIGURE 6.
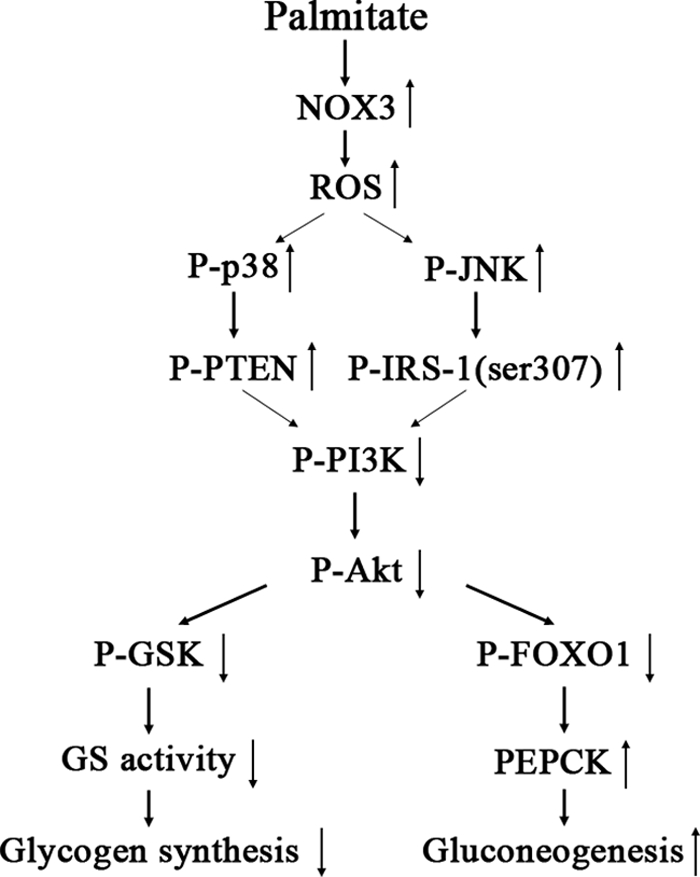
Proposed mechanisms of palmitate-induced insulin resistance in HepG2 cells. High concentrations of palmitate stimulate excess generation of ROS derived by NOX3, which results in activation of JNK and p38MAPK pathways and in turn induces hepatic insulin resistance assessed by impaired glycogen synthesis and failure to suppress glucose production. GS, glycogen synthase.
Acknowledgment
We thank Prof. Youfei Guan (Peking University Health Science Center) for providing db/db mice.
This work was supported by National Basic Research Program of China Grant 2006CB503910), National Natural Science Foundation of China Grant 30572082, and Natural Science Foundation of Beijing Grant 7052059.
- ROS
- reactive oxygen species
- NOX
- NADPH oxidase
- IRS
- insulin receptor substrate
- GSK
- glycogen synthase kinase
- PEPCK
- phosphoenolpyruvate carboxykinase.
REFERENCES
- 1.Guillausseau P. J., Meas T., Virally M., Laloi-Michelin M., Médeau V., Kevorkian J. P. (2008) Diabetes Metab. 34, S43–S48 [DOI] [PubMed] [Google Scholar]
- 2.Petersen K. F., Shulman G. I. (2006) Obesity 14, 34S–40S [DOI] [PMC free article] [PubMed] [Google Scholar]
- 3.Hirabara S. M., Silveira L. R., Abdulkader F., Carvalho C. R., Procopio J., Curi R. (2007) J. Cell. Physiol. 210, 7–15 [DOI] [PubMed] [Google Scholar]
- 4.Liu J., Wu X., Franklin J. L., Messina J. L., Hill H. S., Moellering D. R., Walton R. G., Martin M., Garvey W. T. (2010) Am. J. Physiol. Endocrinol. Metab. 298, E565–E576 [DOI] [PMC free article] [PubMed] [Google Scholar]
- 5.Houstis N., Rosen E. D., Lander E. S. (2006) Nature 440, 944–948 [DOI] [PubMed] [Google Scholar]
- 6.Haus J. M., Solomon T. P., Marchetti C. M., Edmison J. M., González F., Kirwan J. P. (2010) J. Clin. Endocrinol. Metab. 95, 323–327 [DOI] [PMC free article] [PubMed] [Google Scholar]
- 7.Fridlyand L. E., Philipson L. H. (2006) Diabetes Obes. Metab. 8, 136–145 [DOI] [PubMed] [Google Scholar]
- 8.Wei Y., Sowers J. R., Nistala R., Gong H., Uptergrove G. M., Clark S. E., Morris E. M., Szary N., Manrique C., Stump C. S. (2006) J. Biol. Chem. 281, 35137–35146 [DOI] [PubMed] [Google Scholar]
- 9.Nakamura S., Takamura T., Matsuzawa-Nagata N., Takayama H., Misu H., Noda H., Nabemoto S., Kurita S., Ota T., Ando H., Miyamoto K., Kaneko S. (2009) J. Biol. Chem. 284, 14809–14818 [DOI] [PMC free article] [PubMed] [Google Scholar]
- 10.Li L., He Q., Huang X., Man Y., Zhou Y., Wang S., Wang J., Li J. (2010) FEBS Lett. 584, 995–1000 [DOI] [PubMed] [Google Scholar]
- 11.Ito Y., Oumi S., Nagasawa T., Nishizawa N. (2006) Biosci. Biotechnol. Biochem. 70, 2191–2198 [DOI] [PubMed] [Google Scholar]
- 12.Bedard K., Krause K. H. (2007) Physiol. Rev. 87, 245–313 [DOI] [PubMed] [Google Scholar]
- 13.Kamata H., Honda S., Maeda S., Chang L., Hirata H., Karin M. (2005) Cell 120, 649–661 [DOI] [PubMed] [Google Scholar]
- 14.Nakatani Y., Kaneto H., Kawamori D., Hatazaki M., Miyatsuka T., Matsuoka T. A., Kajimoto Y., Matsuhisa M., Yamasaki Y., Hori M. (2004) J. Biol. Chem. 279, 45803–45809 [DOI] [PubMed] [Google Scholar]
- 15.Boden G. (2008) Endocrinol. Metab. Clin. North Am. 37, 635–646, viii–ix [DOI] [PMC free article] [PubMed] [Google Scholar]
- 16.McGarry J. D. (2002) Diabetes 51, 7–18 [DOI] [PubMed] [Google Scholar]
- 17.Azevedo-Martins A. K., Monteiro A. P., Lima C. L., Lenzen S., Curi R. (2006) Toxicol. In Vitro 20, 1106–1113 [DOI] [PubMed] [Google Scholar]
- 18.Samuel V. T., Liu Z. X., Qu X., Elder B. D., Bilz S., Befroy D., Romanelli A. J., Shulman G. I. (2004) J. Biol. Chem. 279, 32345–32353 [DOI] [PubMed] [Google Scholar]
- 19.Risérus U. (2008) Curr. Opin. Clin. Nutr. Metab. Care 11, 100–105 [DOI] [PubMed] [Google Scholar]
- 20.Galgani J. E., Uauy R. D., Aguirre C. A., Díaz E. O. (2008) Br. J. Nutr. 100, 471–479 [DOI] [PubMed] [Google Scholar]
- 21.Evans J. L., Goldfine I. D., Maddux B. A., Grodsky G. M. (2003) Diabetes 52, 1–8 [DOI] [PubMed] [Google Scholar]
- 22.Urakawa H., Katsuki A., Sumida Y., Gabazza E. C., Murashima S., Morioka K., Maruyama N., Kitagawa N., Tanaka T., Hori Y., Nakatani K., Yano Y., Adachi Y. (2003) J. Clin. Endocrinol. Metab. 88, 4673–4676 [DOI] [PubMed] [Google Scholar]
- 23.Kahn S. E. (2003) Diabetologia 46, 3–19 [DOI] [PubMed] [Google Scholar]
- 24.Kajimoto Y., Kaneto H. (2004) Ann. N.Y. Acad. Sci. 1011, 168–176 [DOI] [PubMed] [Google Scholar]
- 25.Talior I., Yarkoni M., Bashan N., Eldar-Finkelman H. (2003) Am. J. Physiol. Endocrinol. Metab. 285, E295–E302 [DOI] [PubMed] [Google Scholar]
- 26.Brownlee M. (2005) Diabetes 54, 1615–1625 [DOI] [PubMed] [Google Scholar]
- 27.Haber E. P., Procópio J., Carvalho C. R., Carpinelli A. R., Newsholme P., Curi R. (2006) Int. Rev. Cytol. 248, 1–41 [DOI] [PubMed] [Google Scholar]
- 28.Delbosc S., Paizanis E., Magous R., Araiz C., Dimo T., Cristol J. P., Cros G., Azay J. (2005) Atherosclerosis 179, 43–49 [DOI] [PubMed] [Google Scholar]
- 29.Klaunig J. E., Kamendulis L. M., Hocevar B. A. (2010) Toxicol. Pathol. 38, 96–109 [DOI] [PubMed] [Google Scholar]
- 30.Ghosh J., Das J., Manna P., Sil P. C. (2009) Toxicol. Appl. Pharmacol. 240, 73–87 [DOI] [PubMed] [Google Scholar]
- 31.Wei Y., Sowers J. R., Clark S. E., Li W., Ferrario C. M., Stump C. S. (2008) Am. J. Physiol. Endocrinol. Metab. 294, E345–E351 [DOI] [PubMed] [Google Scholar]
- 32.Evans J. L., Goldfine I. D., Maddux B. A., Grodsky G. M. (2002) Endocr. Rev. 23, 599–622 [DOI] [PubMed] [Google Scholar]
- 33.Davis J. E., Gabler N. K., Walker-Daniels J., Spurlock M. E. (2009) Horm. Metab. Res. 41, 523–530 [DOI] [PubMed] [Google Scholar]
- 34.Kaneto H., Kawamori D., Nakatani Y., Gorogawa S., Matsuoka T. A. (2004) Drug News Perspect. 17, 447–453 [DOI] [PubMed] [Google Scholar]
- 35.Katakam A. K., Chipitsyna G., Gong Q., Vancha A. R., Gabbeta J., Arafat H. A. (2005) J. Endocrinol. 187, 237–247 [DOI] [PubMed] [Google Scholar]
- 36.Bloch-Damti A., Bashan N. (2005) Antioxid. Redox Signal. 7, 1553–1567 [DOI] [PubMed] [Google Scholar]
- 37.Archuleta T. L., Lemieux A. M., Saengsirisuwan V., Teachey M. K., Lindborg K. A., Kim J. S., Henriksen E. J. (2009) Free Radic. Biol. Med. 47, 1486–1493 [DOI] [PMC free article] [PubMed] [Google Scholar]
- 38.Jensen J., Jebens E., Brennesvik E. O., Ruzzin J., Soos M. A., Engebretsen E. M., O'Rahilly S., Whitehead J. P. (2006) Am. J. Physiol. Endocrinol. Metab. 290, E154–E162 [DOI] [PubMed] [Google Scholar]
- 39.Doble B. W., Woodgett J. R. (2003) J. Cell Sci. 116, 1175–1186 [DOI] [PMC free article] [PubMed] [Google Scholar]
- 40.Ciaraldi T. P., Oh D. K., Christiansen L., Nikoulina S. E., Kong A. P., Baxi S., Mudaliar S., Henry R. R. (2006) Am. J. Physiol. Endocrinol. Metab. 291, E891–E898 [DOI] [PubMed] [Google Scholar]
- 41.Kadotani A., Tsuchiya Y., Hatakeyama H., Katagiri H., Kanzaki M. (2009) Am. J. Physiol. Endocrinol. Metab. 297, E1291–E1303 [DOI] [PubMed] [Google Scholar]
- 42.Ragheb R., Shanab G. M., Medhat A. M., Seoudi D. M., Adeli K., Fantus I. G. (2009) Biochem. Biophys. Res. Commun. 389, 211–216 [DOI] [PMC free article] [PubMed] [Google Scholar]
- 43.Kamata Y., Shiraga H., Tai A., Kawamoto Y., Gohda E. (2007) Neuroscience 146, 1073–1081 [DOI] [PubMed] [Google Scholar]
- 44.Basu R., Chandramouli V., Dicke B., Landau B., Rizza R. (2005) Diabetes 54, 1942–1948 [DOI] [PubMed] [Google Scholar]
- 45.Gastaldelli A., Baldi S., Pettiti M., Toschi E., Camastra S., Natali A., Landau B. R., Ferrannini E. (2000) Diabetes 49, 1367–1373 [DOI] [PubMed] [Google Scholar]
- 46.Seo H. Y., Kim M. K., Min A. K., Kim H. S., Ryu S. Y., Kim N. K., Lee K. M., Kim H. J., Choi H. S., Lee K. U., Park K. G., Lee I. K. (2010) Endocrinology 151, 561–568 [DOI] [PubMed] [Google Scholar]
- 47.Yu X., Huang Y., Hu Q., Ma L. (2009) Acta Biochim. Biophys. Sin. 41, 1027–1032 [DOI] [PubMed] [Google Scholar]
- 48.Wu M., Wang X., Duan Q., Lu T. (2007) Ann. Nutr. Metab. 51, 270–276 [DOI] [PubMed] [Google Scholar]
- 49.Liu H. Y., Wen G. B., Han J., Hong T., Zhuo D., Liu Z., Cao W. J. (2008) J. Biol. Chem. 283, 30642–30649 [DOI] [PMC free article] [PubMed] [Google Scholar]
- 50.Altomonte J., Richter A., Harbaran S., Suriawinata J., Nakae J., Thung S. N., Meseck M., Accili D., Dong H. (2003) Am. J. Physiol. Endocrinol. Metab. 285, E718–E728 [DOI] [PubMed] [Google Scholar]


