Abstract
The D1 protein (PsbA) of photosystem II (PSII) from Thermosynechococcus elongatus is encoded by a psbA gene family that is typical of cyanobacteria. Although the transcription of these three genes has been studied previously (Kós, P. B., Deák, Z., Cheregi, O., and Vass, I. (2008) Biochim. Biophys. Acta 1777, 74–83), the protein quantification had not been possible due to the high sequence identity between the three PsbA copies. The successful establishment of a method to quantify the PsbA proteins on the basis of reverse phase-LC-electrospray mass ionization-MS/MS (RP-LC-ESI-MS/MS) enables an accurate comparison of transcript and protein level for the first time ever. Upon high light incubation, about 70% PsbA3 could be detected, which closely corresponds to the transcript level. It was impossible to detect any PsbA2 under all tested conditions. The construction of knock-out mutants enabled for the first time a detailed characterization of both whole cells and also isolated PSII complexes. PSII complexes of the ΔpsbA1/psbA2 mutant contained only copy PsbA3, whereas only PsbA1 could be detected in PSII complexes from the ΔpsbA3 mutant. In whole cells as well as in isolated complexes, a shift of the free energy between the redox pairs in the PsbA3 complexes in comparison with PsbA1 could be detected by thermoluminescence and delayed fluorescence measurements. This change is assigned to a shift of the redox potential of pheophytin toward more positive values. Coincidentally, no differences in the QA-QB electron transfer could be observed in flash-induced fluorescence decay or prompt fluorescence measurements. In conclusion, PsbA3 complexes yield a better protection against photoinhibition due to a higher probability of the harmless dissipation of excess energy.
Keywords: Mass Spectrometry (MS), Membrane Proteins, Photosynthesis, Protein Purification, Protein Turnover, Spectroscopy, Photosystem II, PsbA/D1, Photoprotection
Introduction
The first step in the light reaction of photosynthesis is the light-driven oxidation of water into molecular oxygen and protons. During this process, which is catalyzed by the membrane protein complex PSII,2 electrons from the PSII donor site are transferred to the acceptor site via various cofactors. Most of these cofactors are coordinated by the central PSII subunit PsbA (2). In all known cyanobacteria, the PsbA protein is not encoded by a single psbA gene as in higher plants but by multiple psbA genes, the psbA gene family. The number of genes and their products varies depending on the species. Although there are gene families of up to five members (Anabaena PCC 7170), only four different PsbA protein forms are classified (D1:1, D1:2, D1m, and D1′) (3). D1m seems to be the standard PsbA form, the expression of which is not affected by any stress conditions. D1:1 is also expressed under standard conditions but repressed under stress conditions, whereas D1:2 is mainly expressed under stress conditions such as high light (4), UV light (5), or low temperatures (6). In all known cyanobacterial sequences, the only conserved difference between D1:1 and D1:2 is the amino acid at position 130, which is glutamine in D1:1 and glutamate in D1:2. This amino acid forms a hydrogen bond toward the pheophytin (7), which may be impaired by an exchange in this position. The effect of a Q130E exchange has been intensively studied by point mutants in Synechocystis PCC 6803, showing a clear impact on the electron transfer properties (8, 9). The divergent PsbA form (D1′) has been assumed to be not expressed at all, but very recently, an induction under microaerobic conditions could be shown for a few species (10).
The psbA gene family of Thermosynechococcus elongatus contains three members (psbA1, psbA2, and psbA3), of which psbA1 encodes the standard PsbA copy D1:1 and psbA3 is strongly induced under high light conditions (D1:2) (1). The divergent D1′ (psbA2) has been shown to be very weakly induced under microaerobic conditions (11). Here we report for the first time the exact and direct quantification of the amount of D1:1 and D1:2 protein by highly sensitive and accurate mass spectrometry. Up to now, such a quantification was impossible due to the high homology between the alternative PsbA copies. In parallel, we characterize knock-out mutants that express only one of the three PsbA copies. For the first time ever, these mutants not only allow a characterization on the level of whole cells but also on the level of isolated active PSII complexes.
MATERIALS AND METHODS
Construction of the Knock-out Mutants
For the deletion of psbA1 and psbA2 in the ΔpsbA1/psbA2 mutant, a plasmid was constructed containing psbA1 upstream region and psbA2 downstream region, and in between, most parts of the psbA1 and psbA2 genes were exchanged for a chloramphenicol resistance cassette.
The exchange of large parts of the psbA3 gene for a spectinomycin/streptomycin resistance cassette resulted in a plasmid used for the psbA3 deletion. Both plasmids were used for transformation of T. elongatus BP1 wild type according to Ref. 12.
Culture Conditions
T. elongatus cultures were routinely grown in liquid BG11 medium at 45 °C and bubbled with CO2-enriched air. The standard light intensity was 50 μE m−2 s−1. Mutants were additionally supplied with the respective antibiotic. For isotopic labeling of all proteins, the respective culture was grown on a modified BG11 medium, which contained 15NH4Cl as the sole nitrogen source.
PSII Purification
Highly active PSII complexes were isolated as described earlier (13).
Analysis of the psbA Transcript Level
The psbA transcript level was determined by quantitative real time PCR analysis. Immediately after harvesting, the cells were incubated with RNAprotect reagent (Qiagen,) and the total RNA was isolated with the RNeasy mini kit (Qiagen). The total RNA was digested with Turbo DNase (Ambion) and transcribed into cDNA with the QuantiTect reverse transcriptase kit (Qiagen). Real time PCR analysis was performed with the quantitative PCR core kit for SYBR Green I (Eurogentec) in the DNA Engine Opticon 2 Real time PCR detection system (MJ Research). The following primer pairs were used: psbA1, forward, 5′-ACTTGGGTATGGAAGTGAT-3′; psbA1, reverse, 5′-AAGTTCAGTAGATAACGTTGC-3′; psbA2, forward, 5′-CAACATTGGTATTGAGGTG-3′; psbA2, reverse, 5′-CACTAGAGAGGTTTAGGAGC-3′; psbA3, forward, 5′-ACTTGGGTATGGAAGTGAT-3′; psbA3, reverse, GGCTAGTTAGACTTGCTCC-3′.
Analysis of PsbA Protein Level
The PsbA protein level was determined by a mass spectrometric approach. Isolated complexes from cultures grown under specific growth conditions were mixed with isotopically labeled (15N) PSII complexes (cf. Ref. 14) from a mutant containing only PsbA3 in a 1:1 ratio based on the chlorophyll content. The subunits were isolated via SDS gel. For a typical gel, see supplemental Fig. S2. The band containing the D1 and D2 proteins was used for in-gel digestion with chymotrypsin. Eluted peptides were desalted by ZipTips (Millipore) and analyzed by reverse phase-LC-electrospray mass ionization-MS/MS, performed with an ESI-LTQ-Orbitrap mass spectrometer with an Accela chromatography system (Thermo Fisher). Settings and parameters were used as in Ref. 15. The intensity of labeled and unlabeled unique PsbA3 peptides was used to quantify the relative amount of PsbA3. To exclude artifacts due to unequal mixing of labeled and unlabeled PSII complexes, the ratio between labeled and unlabeled D2 peptides was used as an internal standard.
Thermoluminescence Measurements
Thermoluminescence curves were recorded in a home-built apparatus with whole cells or isolated PSII complexes being deposited on a filter paper, respectively (Whatman GF/C glass microfiber). Whole cells (50 μg of chlorophyll) were incubated for 3 min in the dark at 20 °C followed by one saturating flash at 5 or 0 °C in the presence of 10 μm DCMU. Upon rapid cooling to −20 °C, a temperature gradient was applied with a heating rate of 20 °C per min. Isolated complexes (10 μg of chlorophyll) were incubated for 20 min in the dark at 20 °C followed by a rapid cooling to −10 °C, a saturating flash, and a temperature gradient as in the case of whole cells.
Fluorescence Measurements
Delayed fluorescence and flash-induced fluorescence decay measurements were performed as reported earlier (1, 16).
RESULTS AND DISCUSSION
Quantification of PsbA Proteins
Quantification of the psbA transcripts using quantitative real time PCR has become a standard method that has been successfully used for various species and growth conditions (1, 17). Although this is a very powerful tool to monitor the rapid exchange between the different copies and the fast adaptation to stress conditions, the question how fast and to what extent these changes actually occur on the protein level still remains unsolved. This is due to the very high homology between the PsbA copies, where standard detection and quantification methods such as Western blot analysis simply fail. We therefore established a method based on highly sensitive and accurate mass spectrometry to monitor the time-dependent PsbA protein exchange.
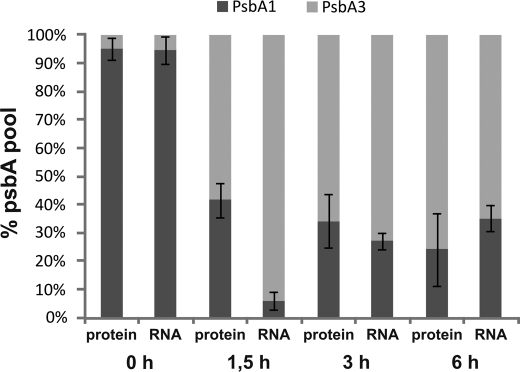
Isolated PSII complexes from T. elongatus cultures grown for 0, 1.5, 3, and 6 h under high light conditions (500 μE m−2 s−1) were used to estimate the exact PsbA protein amount. Additionally, the psbA transcript level of each sample was determined by quantitative real time PCR. The results of the protein and transcript quantification are shown in Fig. 1.
FIGURE 1.
Relative protein and transcript quantification. Protein and transcript amounts were determined in parallel 0, 1.5, 3, and 6 h after HL treatment. After a 3-h HL treatment, the PsbA3 content levels off to about 70% on the transcript as well as on the protein level. Data are presented as mean ± S.D. of three independent biological repetitions.
Under standard growth conditions (0 h), about 97% of both transcript and protein pool consisted of PsbA1 with a minor contribution of PsbA3 of about 3%. After a 1.5-h high light treatment, the ratio between PsbA1 and PsbA3 changed drastically. About 98% of the transcript pool and about 42% of the protein pool consisted of PsbA3. Interestingly, the content of psbA3 transcript decreased to about 73–80% if the high light treatment continued (3 and 6 h), whereas the content of PsbA protein increased to about the same level (72%), i.e. on both the transcriptional and the protein level, PsbA3 reaches about 70–80% under continuous high light treatment. This closely corresponds to previous transcriptional studies in Synechococcus PCC 7942 (4) and T. elongatus (1) where prolonged high light incubation yielded a similar D1:1/D1:2 ratio. In contrast, there are no reliable protein data available as in comparison with the mass spectrometric approach reported here, all previously reported protein quantification approaches were at best semiquantitative and rather indirect.
Functional Analysis of PsbA1 and PsbA3
The PsbA protein quantification has shown that a complete exchange from PsbA1 to PsbA3 cannot be achieved by high light incubation. To functionally characterize PsbA1 and PsbA3, it was necessary to construct knock-out mutants containing either PsbA1 or PsbA3 exclusively. The deletion of the psbA1 and psbA2 genes resulted in a ΔpsbA1/psbA2 mutant, whereas the deletion of the psbA3 gene generated a ΔpsbA3 mutant. Although the psbA2 gene was not deleted in the ΔpsbA3 mutant, the expression of the PsbA2 protein has never been detected in our work. Both mutants are fully segregated and were used for further investigations.
Growth Behavior
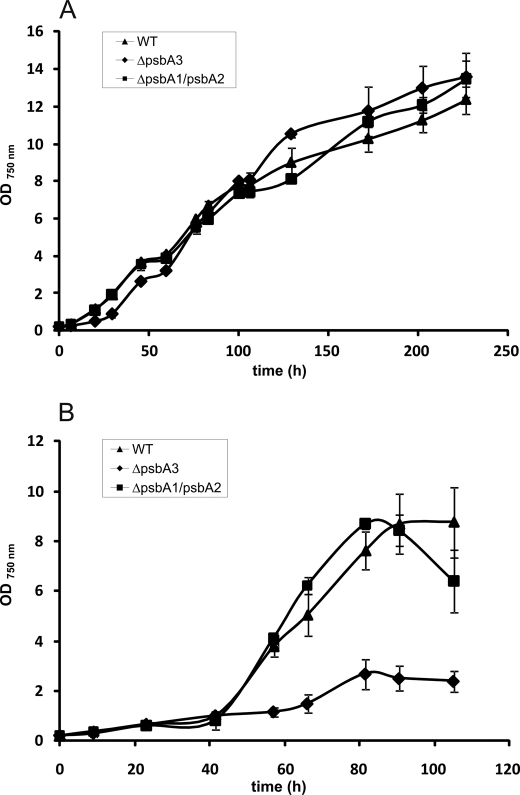
Fig. 2 shows the growth behavior of WT and both mutants under normal (50 μE m−2 s−1) and high light (500 μE m−2 s−1) conditions. Within range of error, their growth behavior is identical under normal light conditions (Fig. 2A), i.e. neither the loss of PsbA1 nor the loss of PsbA3 seems to have a severe impact. This can also be shown by oxygen evolution activity measurements, which show no impact on the activity in both mutants compared to the WT (see supplemental Fig. S1).
FIGURE 2.
Growth behavior of the ΔpsbA1/psbA2 mutant and the ΔpsbA3 mutant when compared with WT under normal and high light conditions. A, under normal light conditions, both the ΔpsbA1/psbA2 mutant and the ΔpsbA3 mutant show the same growth behavior as WT. B, in contrast, the ΔpsbA3 mutant is severely impaired under HL conditions leading to a growth stop, whereas the ΔpsbA1/psbA2 mutant exhibits similar growth to WT. Data are presented as mean ± S.D. of three independent biological repetitions. In some instances, the error bars are smaller than the symbols.
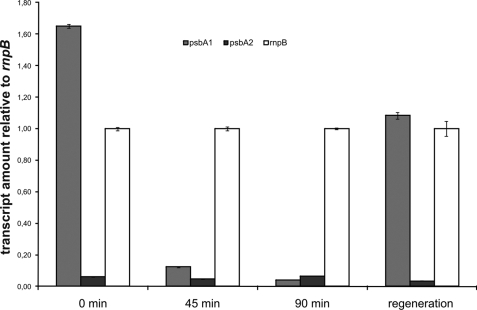
In contrast, growth of the ΔpsbA3 mutant under high light conditions is drastically impaired in comparison with WT and the ΔpsbA1/psbA2 mutant (Fig. 2B). Although the ΔpsbA3 mutant almost stops growing, the WT and ΔpsbA1/psbA2 mutant continue to grow. Analysis of these growth curves alone does not explain whether PsbA1 is unable to functionally replace PsbA3 under high light conditions due to a functional disadvantage or due to decreasing PsbA protein. However, transcript analysis of the ΔpsbA3 mutant under high light conditions showed a down-regulation of psbA1 despite psbA3 being absent (Fig. 3). Most probably, this will result in a decreased PsbA content in the cell, which might explain the inability of the mutant to grow under high light conditions.
FIGURE 3.
Transcript analysis of ΔpsbA3 mutant under HL condition. The amount of psbA1 and psbA2 in the ΔpsbA3 mutant was determined relative to the housekeeping gene rnpB. Upon HL treatment, psbA1 is down-regulated, whereas psbA2 regulation is not affected, resulting in a minor D1 content in the ΔpsbA3 mutant under HL conditions. Data are presented as mean ± S.D. of three independent measurements. In some instances, the error bars are smaller than the symbols.
Ability to Recover from Photoinhibition
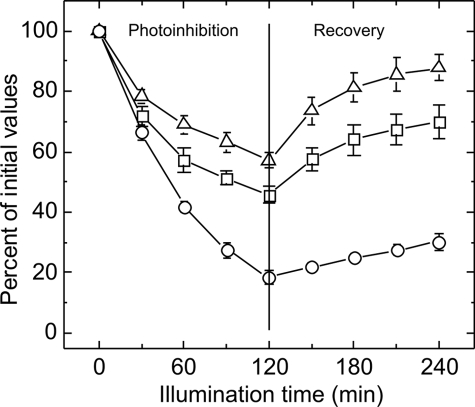
After high light (HL) illumination, initial amplitudes of flash-induced fluorescence decay curves have been plotted relative to the values under normal growth conditions (Fig. 4). ΔpsbA3 proved to be the most sensitive strain to HL (500 μmol m−2 s−1) with the number of active PSII centers decreasing to 15–20% under a 2-h HL illumination and a minimal recovery under normal growth light (i.e. 50 μE). In comparison, ΔpsbA1/psbA2 and wild type cells both showed more resistance to HL with 40 and 55% active PSII complexes, respectively, and an ability to recover under 50 μmol m−2 s−1 growth light intensity. Interestingly, not ΔpsbA1/psbA2, the strain containing only the HL copy, but the wild type cells were most vital with the highest activity despite a 2-h HL illumination, whereas the ΔpsbA1/psbA2 cells instead showed the highest recovery rate. This shows that T. elongatus obviously needs the high light-induced PsbA3 copy for both an optimal protection against photoinhibition and recovery from it.
FIGURE 4.
Effect of high/low light illumination on the initial amplitudes of flash-induced fluorescence decay in WT (triangles), ΔpsbA3 (circles), and ΔpsbA1A2 (squares) mutants. Cells grown at 50 μmol m−2 s−1 were exposed to 500 μmol m−2 s−1 light for 2 h followed by a 2-h recovery period under normal growth light (50 μmol m−2 s−1). Data are presented as mean ± S.D. of three independent biological repetitions. In some instances, the error bars are smaller than the symbols.
Electron Transport Characteristics of PsbA1-PSII and PsbA3-PSII
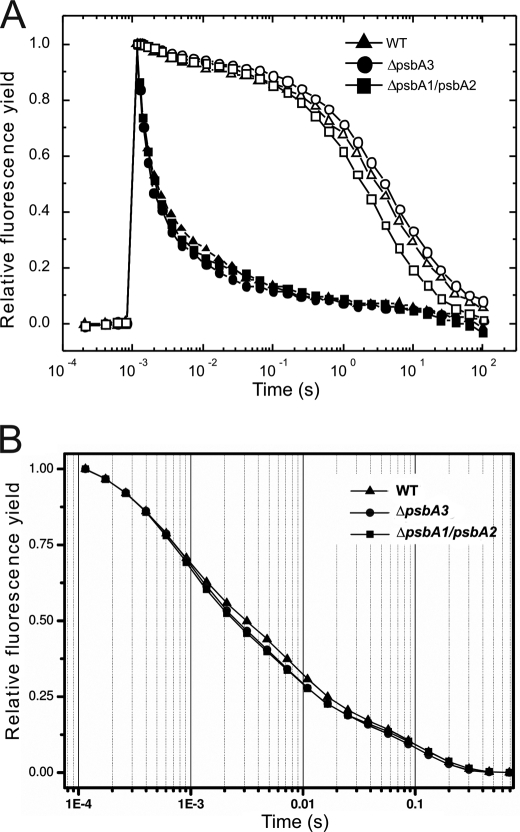
Electron transport characteristics of both mutants were compared with WT. Flash-induced fluorescence decay measurements in the absence of the inhibitor DCMU showed no significant difference on the whole cell level nor on the level of isolated PSII complexes (Fig. 5, A and B).
FIGURE 5.
Flash-induced fluorescence decay measurements in the absence (closed symbols) and in the presence of 10 μm DCMU (open symbols) in whole cells (A) and isolated PSII complexes (B) of the WT (triangles), ΔpsbA3 (circles), and ΔpsbA1/A2 (squares) mutants. The curves are normalized to the same initial amplitudes.
In contrast, the presence of DCMU induced differences (Fig. 5A), which indicates that the electron transfer from QA− to QB is not affected by the PsbA1/PsbA3 exchange but rather by earlier electron transfer and charge recombination processes. An in-depth characterization of these processes was performed by thermoluminescence and delayed fluorescence (DF) measurements.
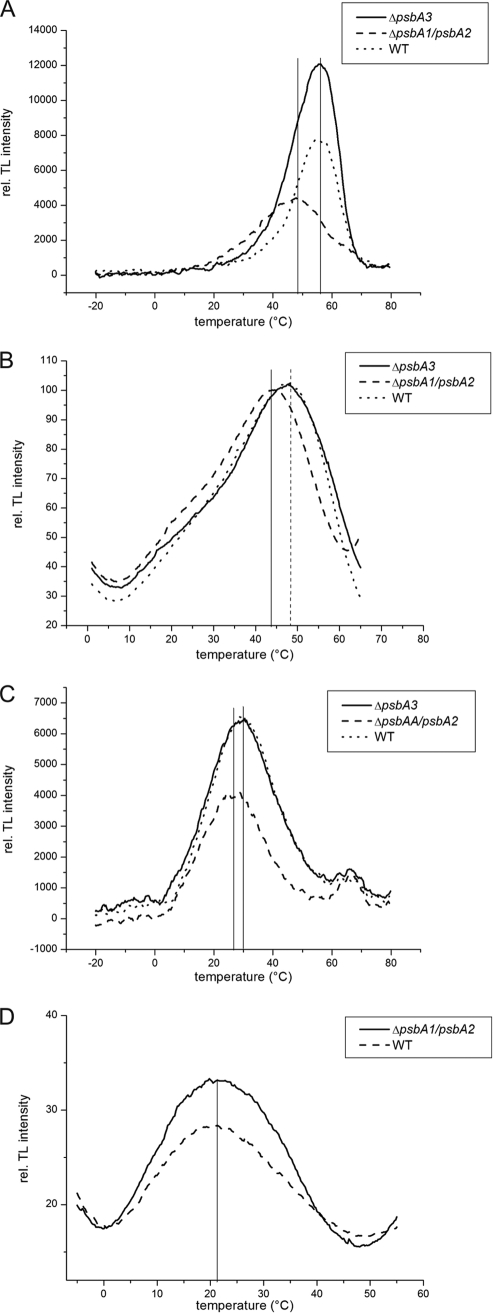
After one single turnover flash in the absence of DCMU, the B-band can be observed by thermoluminescence measurements representing the S2QB recombination. Both whole cells (Fig. 6A) and isolated PSII complexes (Fig. 6B) show a clear shift of this band toward lower temperatures in PsbA3-PSII (Table 1). A less pronounced effect can be seen in the presence of DCMU, where the Q-band representing the S2QA recombination in PsbA3-PSII is also slightly shifted toward lower temperatures (Fig. 6, C and D). This effect has been extensively studied on point mutants of Synechocystis PCC 6803, where Gln-130 has been exchanged for Glu (8, 9). The shift toward lower temperatures of both the Q-band and the B-band can therefore be assigned to the Q130E exchange in PsbA3. As this amino acid is thought to be hydrogen-bonded to the pheophytin molecule, its exchange might induce a modified charge separation or recombination rate as suggested by the thermoluminescence measurements.
FIGURE 6.
Thermoluminescence measurements of whole cells and isolated complexes. In the absence of the inhibitor DCMU, the B-band of whole cells (A) and isolated PSII complexes (B) was detected. Additionally, in the presence of DCMU, the Q-band of whole cells (C) and isolated PSII complexes (D) was recorded. rel. TL, relative thermoluminescence.
TABLE 1.
Peak temperatures of Q-band and B-band as determined by thermoluminescence
| Whole cells |
Isolated complexes |
|||
|---|---|---|---|---|
| B-band | Q-band | B-band | Q-band | |
| °C | °C | |||
| WT | 56 | 30 | 47.5 | 21 |
| ΔpsbA3 | 56 | 29 | 47.3 | 20 |
| ΔpsbA1/psbA2 | 48 | 26 | 43.5 | 21.3 |
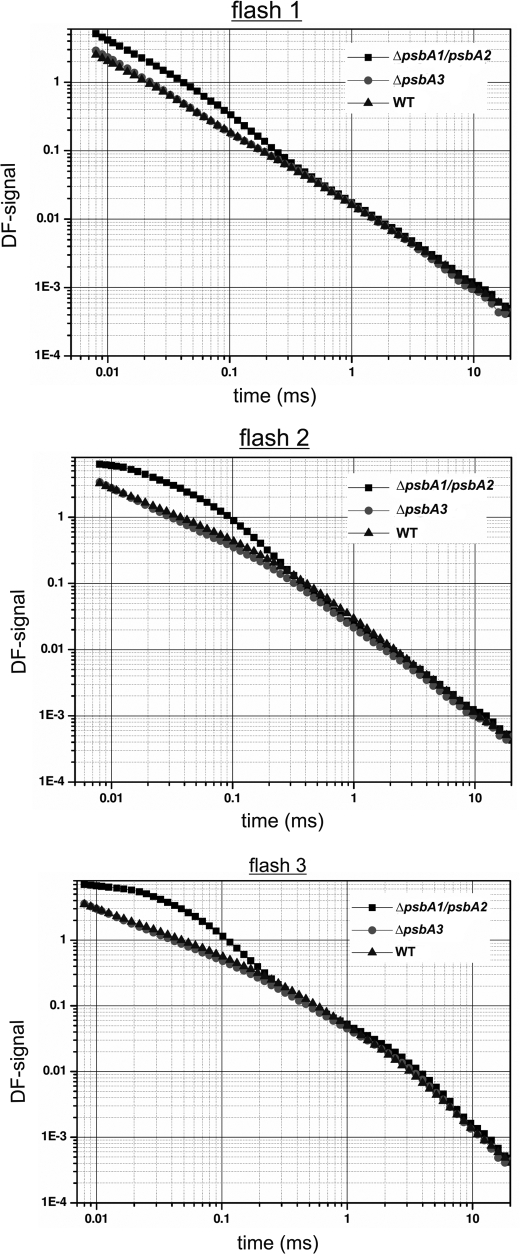
Furthermore, the DF measurements on isolated PSII complexes show distinct characteristics of PsbA1-PSII and PsbA3-PSII. Although the oxygen-evolving pattern of all tested PSII complexes showed typical period four oscillations with similar miss parameters (data not shown), DF signals after the first, second, and third flash revealed an increased initial amplitude of PsbA3-PSII (Fig. 7). This indicates a rise of the Gibbs free energy level of the QA−TyrZ+ radical pair of about 20 meV in PsbA3-PSII, which closely corresponds to the observed higher recombination rates in PsbA3-PSII complexes.
FIGURE 7.
DF of isolated PSII complexes. Typical single measurements of DF analysis of isolated PSII complexes after the first, second, and third flash.
Conclusions
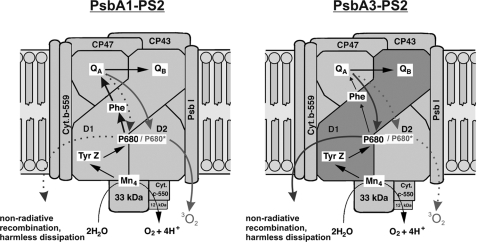
We were able to demonstrate distinct functional properties of PsbA3 implying its photoprotective function for PSII complexes, which is shown as a diagram in Fig. 8. The altered redox potential of pheophytin leads to a decreased probability of repopulation of the excited P680, which could be involved in the production of harmful reactive oxygen species. Furthermore, charge recombination, probably via alternative routes, seems to be increased at the expense of a reduced forward electron transfer in PsbA3-PSII. Nevertheless, PsbA3 copy alone does not yield optimum photoprotection as the ΔpsbA1/psbA2 mutant containing only PsbA3 shows a weaker protection against photoinhibition than WT. These findings may also explain why, in contrast to the transcript level, even prolonged high light exposition of WT does not result in a complete PsbA1/PsbA3 exchange but stops at 70% PsbA3.
FIGURE 8.
Possible photoprotective mechanism of the PsbA1/PsbA3 exchange. Charge recombination in PsbA1-PSII leads to an increased repopulation of the excited P680 and thus to a higher production of harmful singlet oxygen production. This is avoided in the PsbA3-PSII by a higher non-radiative recombination and the harmless dissipation of excess energy. Cyt b-559, cytochrome b 559; Cyt c-550, cytochrome c 550.
For an evolutionary classification of the D1:1 (PsbA1) and D1:2 (PsbA3) forms, we should take into consideration that most cyanobacteria live in habitats with limited rather than excess light. For this reason, we propose that D1:2, the so-called stress form, is rather the standard PsbA form, which is also present in all higher plants and in the L subunit of the bacterial reaction center, which is a homologue of PsbA. Accordingly, D1:1 evolved as a strategy against low light stress as it shows lower losses due to recombination events at the expense of a worse protection against excess light.
Supplementary Material
Acknowledgment
We thank Claudia König (Bochum) for excellent technical assistance.
This work was supported by grants from the German Research Council, Deutsche Forschungsgemeinschaft (SFB 480, Project C1), and the European Union (SOLAR-H).

The on-line version of this article (available at http://www.jbc.org) contains supplemental Figs. S1 and S2.
- PSII
- photosystem II
- DCMU
- 3-(3,4-dichlorophenyl)-1,1-dimethylurea
- HL
- high light
- DF
- delayed fluorescence
- μE
- microeinsteins.
REFERENCES
- 1.Kós P. B., Deák Z., Cheregi O., Vass I. (2008) Biochim. Biophys. Acta 1777, 74–83 [DOI] [PubMed] [Google Scholar]
- 2.Guskov A., Kern J., Gabdulkhakov A., Broser M., Zouni A., Saenger W. (2009) Nat. Struct Mol. Biol. 16, 334–342 [DOI] [PubMed] [Google Scholar]
- 3.Mulo P., Sicora C., Aro E. M. (2009) Cell. Mol. Life Sci. 66, 3697–3710 [DOI] [PMC free article] [PubMed] [Google Scholar]
- 4.Kulkarni R. D., Golden S. S. (1994) J. Bacteriol. 176, 959–965 [DOI] [PMC free article] [PubMed] [Google Scholar]
- 5.Campbell D., Eriksson M. J., Oquist G., Gustafsson P., Clarke A. K. (1998) Proc. Natl. Acad. Sci. U.S.A. 95, 364–369 [DOI] [PMC free article] [PubMed] [Google Scholar]
- 6.Sane P. V., Ivanov A. G., Sveshnikov D., Huner N. P., Oquist G. (2002) J. Biol. Chem. 277, 32739–32745 [DOI] [PubMed] [Google Scholar]
- 7.Loll B., Kern J., Saenger W., Zouni A., Biesiadka J. (2005) Nature 438, 1040–1044 [DOI] [PubMed] [Google Scholar]
- 8.Rappaport F., Guergova-Kuras M., Nixon P. J., Diner B. A., Lavergne J. (2002) Biochemistry 41, 8518–8527 [DOI] [PubMed] [Google Scholar]
- 9.Cser K., Vass I. (2007) Biochim. Biophys. Acta 1767, 233–243 [DOI] [PubMed] [Google Scholar]
- 10.Summerfield T. C., Toepel J., Sherman L. A. (2008) Biochemistry 47, 12939–12941 [DOI] [PubMed] [Google Scholar]
- 11.Sicora C. I., Ho F. M., Salminen T., Styring S., Aro E. M. (2009) Biochim. Biophys. Acta 1787, 105–112 [DOI] [PubMed] [Google Scholar]
- 12.Mühlenhoff U., Chauvat F. (1996) Mol. Gen. Genet. 252, 93–100 [DOI] [PubMed] [Google Scholar]
- 13.Kuhl H., Kruip J., Seidler A., Krieger-Liszkay A., Bunker M., Bald D., Scheidig A. J., Rögner M. (2000) J. Biol. Chem. 275, 20652–20659 [DOI] [PubMed] [Google Scholar]
- 14.Nowaczyk M. M., Hebeler R., Schlodder E., Meyer H. E., Warscheid B., Rögner M. (2006) Plant Cell 18, 3121–3131 [DOI] [PMC free article] [PubMed] [Google Scholar]
- 15.Haussmann U., Qi S. W., Wolters D., Rögner M., Liu S. J., Poetsch A. (2009) Proteomics 9, 3635–3651 [DOI] [PubMed] [Google Scholar]
- 16.Buchta J., Grabolle M., Dau H. (2007) Biochim. Biophys. Acta 1767, 565–574 [DOI] [PubMed] [Google Scholar]
- 17.Sicora C. I., Appleton S. E., Brown C. M., Chung J., Chandler J., Cockshutt A. M., Vass I., Campbell D. A. (2006) Biochim. Biophys. Acta 1757, 47–56 [DOI] [PubMed] [Google Scholar]
Associated Data
This section collects any data citations, data availability statements, or supplementary materials included in this article.


