Abstract
Background and aim: The nutritive status has significant role in improving the quality of life of dialysis' patients. The aim of this study was to find out if there is any correlation of the anthropometric parameters and markers of nutrition with the adequacy of HD.
Methods: The investigation was organized as a clinical, cross sectional study. Demographic characteristics, co-morbid conditions, smoking, dialysis duration and blood pressure were recorded. Serum total protein, albumin, ferritin and blood-lipids were measured as biochemical markers of nutritional status.
One hundred and forty patients, 82 (58.6%) male, and 58 (41.4%) female, 55±12.59 years, were dividied into two groups. Group A consisted of 44 patients (14 women and 30 men) received the recommended hemodialysis dose (Kt/V ≥ 1.2), while the Group B consisted of 96 patients (69 males and 27 females) received non-adequate hemodialysis dose (Kt/V < 1.2).
Results: Patients with adequate hemodialysis had been longer on dialysis in correlation with the group of patients with non-adequate hemodialysis (73 ± 56.4 vs. 44 ± 50.1 months; p: 0.004). Group A and group B presented significant differences in the number of leukocytes (p: 0.027), and hemoglobin (p: 0.047), potassium (p: 0.038) and C-reactive protein level (p: 0.048) as well as in serum total protein (69 ± 4.63 vs. 65 ± 5.74 g/L; p < 0.0001) and albumin (38 ± 2.99 vs. 29 ± 4.4 g/L; p: 0.047). Pearsons correlation of factors that may have impact on hemodialysis adequacy indicated a significant relation between serum total protein and the index of hemodialysis adequacy (r: 0.21; p: 0.0446).
Conclusions: All investigated anthropometric parameters and protein status showed significantly higher values in patients with adequate hemodialysis quality (Group A). The Group B showed higher levels of CRP and lower values of hemoglobin.
Keywords: nutrition status, adequacy, hemodialysis
Regardless of the obvious technological progress in the development of dialysis procedures, the adequacy of hemodialysis (HD) and nourishment are important determinants of the quality of life and have a direct impact on morbidity and mortality of patients who are being treated with chronic HD1,2. It is estimated that improvement of nutrition might postpone the progression and lessen expected complications in patients who suffer from severe renal insufficiency2. The concept of quality, adequacy or appropriateness of HD, which were introduced in the 1970s, implies dialysis which enables patients to have a normal quality of life, as well as solid clinical tolerance with minimal problems during the dialysis and inter-dialysis periods. The most widely accepted model for objective quantification of HD efficiency is the kinetic model of urea (Kt/V). This defines all necessary parameters of dialysis, keeping in mind the high levels of protein catabolism and elimination of urea3,4.
The aim of this study was to assess the impact of anthropometric and biochemical parameters of nutrition on the adequacy of hemodialysis.
Methods
Study design and patients
The research was conducted in the Center for Nephrology and Dialysis, at the "Kragujevac" Clinical Center as a clinical study involving patients who had been treated for at least 3 months with chronic HD. There were 140 patients, 82 males (58.6%) and 58 (41.4%) females, of average age 55 ± 12.59 years. They were dividied into two groups. Group A consisted of 44 patients (14 women and 30 men) received the recommended hemodialysis dose (Kt/V ≥ 1.2), while the Group B consisted of 96 patients (69 males and 27 females) received non-adequate hemodialysis dose (Kt/V < 1.2).
Laboratory and clinical analyses
The basic patient characteristics were determined on the basis of the adequacy of hemodialysis, by calculating the kinetic model of urea using the Daurgirdas formula (Kt/V). Adequate HD, according to the National Kidney Foundation-Kidney Disease Outcomes Quality Initiative (NKF-K/DOQI) recommendations, is dialysis that ensures a Kt/V index ≥ 1.2 for time average concentration of urea (TAC) less than 18 mmol/L and a protein catabolic rate (PCR) index of 1.1 – 1.3 g/kg body weight/day, with a daily protein intake of 1.0 g/kg body weight/day3,4. Patients who had Kt/V values more than 1.2 were considered to have adequate HD. Patients who had Kt/V values lower than 1.2 were below the recommended level of adequacy. Regarding clinical characteristics, the demographic structure was determined, cardiovascular diseases, diabetes mellitus and thrombosis of deep veins were registered and the time spent on hemodialysis, the cigarette smoking and the arterial blood pressure were recorded. Regarding biochemical markers of nutrition, we measured the concentrations of serum total protein, albumin, ferritin, and blood lipids2–4, as well as a set of routine laboratory analyses. Blood samples for biochemical tests were taken mid-week before the HD session. A COULTER apparatus, using the flow cytometric method was used for hematological analysis, while the biochemical analyses were made spectrophotometrically on a Llab-600 apparatus. Most of our patients were dialyzed three times a week, with standard bicarbonate solution for 3.5 – 4 hours, using commercially available dialyzers, with a blood pump flow ranging from 200 to 280 ml/min and a 500 ml/min fluid flow of dialysis liquid. The examined patients were divided into two groups: group 1 who had the recommended index of HD adequacy (Kt/V ≥ 1.2) and group 2 who had a Kt/V index lower than 1.2.
Statistical analysis
The values of all parameters are given as mean ± SD. The χ2 test and t-test were used for testing hypotheses. Relations between the adequacy of HD and clinical-laboratory parameters that might have had an impact on the quality of dialysis were evaluated by Pearson's correlation method. A p value <0.05 was considered statistically significant. The software program used for statistical analysis was Instat (GraphPad Prism V4.0, Software Inc. San Diego, USA).
Results
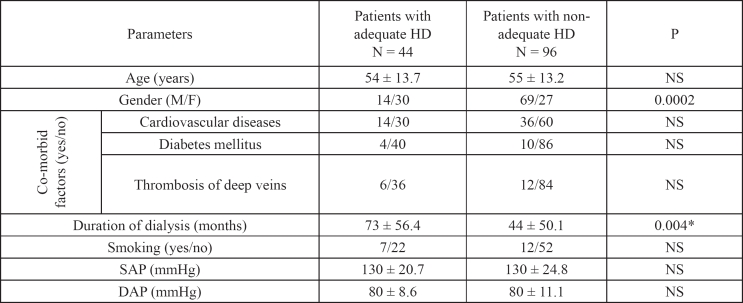
The group of patients with the recommended HD dose (Kt/V ≥1.2) included a total of 44 individuals, 14 (31.8%) females and 30 (68.2%) males, of average age 54 ± 13.7 years. The number of examinees with non-adequate HD (Kt/V <1.2) was 96 (68.2%), including 69 (71.8%) males and 27 (28.2%) females, of average age 55 ± 13.2 years. There were significant differences (p = 0.0002) in gender structure, between the two groups. Patients with adequate hemodialysis had been longer on dialysis in correlation with the group of patients with non-adequate hemodialysis (73 ± 56.4 vs. 44 ± 50.1 months; p = 0.004). Comorbid conditions, smoking and arterial pressure did not show any statistically significant differences or correlation in the examined groups (Table 1).
Table 1: Demographic, anthropometric and clinical characteristics of the examined patients.
SAP: Systolic arterial pressure; DAP: Diastolic arterial pressure.
Continuous variables are presented as means ± SD. Comparisons between the patients with adequate hemodialysis and the group of patients with non-adequate hemodialysis were analyzed using the Student t test and χ2 test. Differences were considered statistically significant for p< 0.05.
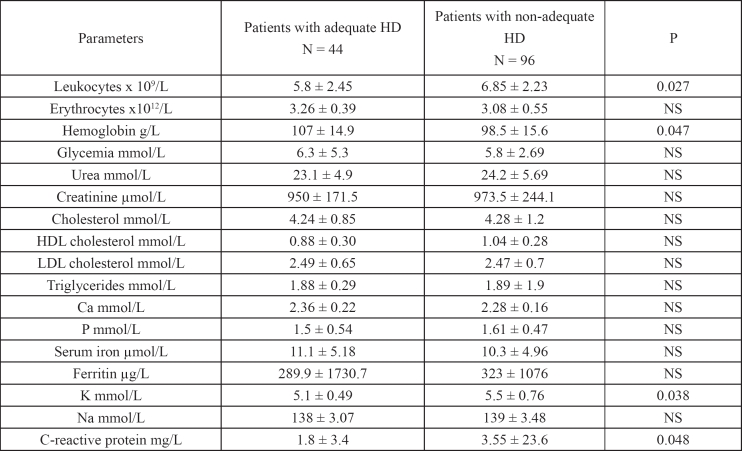
The number of leukocytes (6.85 ± 2.23 vs. 5.8 ± 2.45 x 10⁹/L) in patients with a Kt/V index <1.2 was significantly higher (p = 0.027), in comparison with the group who had adequate HD. Those with non-adequate HD also had lower concentrations of hemoglobin than the group with Kt/V ≥ 1.2 (98.5 ± 15.6 vs. 107 ± 14.9 g/L; p = 0.047). The mean concentrations of potassium (5.1 ± 0.49 vs. 5.5 ± 0.76 mmol/L; p = 0.038) and Creactive protein (1.8 ± 3.4 vs. 3.55 ± 23.6 mg/L; p = 0.048) were lower in the group of patients with adequate HD (Table 2).
Table 2: Laboratory parameters of the examined patients.
Continuous variables are presented as means ± SD. Univariate comparisons between the groups were made using the Student t test for continuous variables. Differences were considered statistically significant for p < 0.05
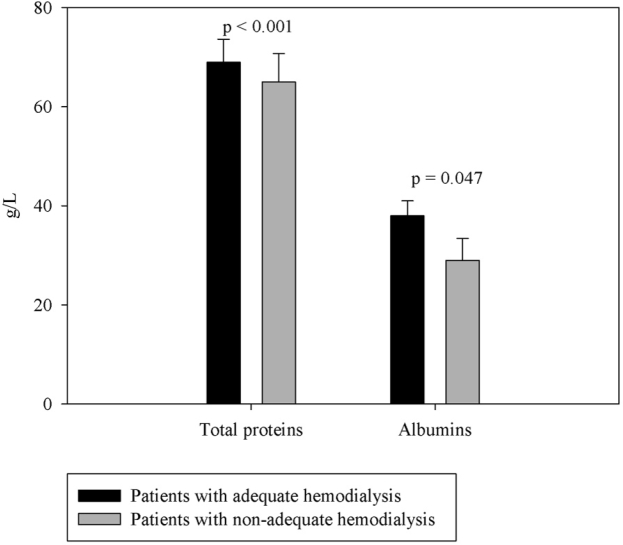
Regarding total serum protein (69 ± 4.63 vs. 65 ± 5.74 g/L; p = 0.02) and albumin (38 ± 2.99 vs. 29 ± 4.4 g/L; p = 0.047), there were also significant differences between the groups of patients favoring those with an adequate index of HD (Figure 1).
Figure 1: Between the groups of examinees with and without adequate HD index there was a highly significant difference for serum protein concentration (p<0.0001) and a significant difference (p=0.047) for serum albumin concentration.
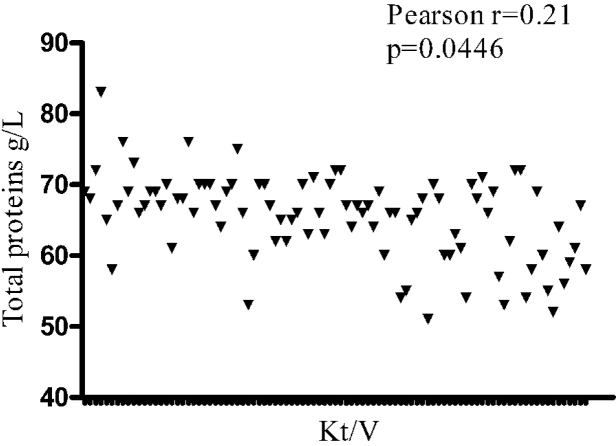
Pearson's correlation for variables that might have had an impact on adequacy of HD (age, duration of dialysis, blood lipids, albumin, ferritin, C-reactive protein) did not indicate any associations (Table 3). However, the correlation of serum protein concentration, as a biochemical marker of nutritive status with the adequacy of HD was positive (r = 0.21; p = 0.0446) (Figure 2).
Table 3: Correlation adequacy of hemodialysis and factors which might have an impact on the quality of dialysis.
Pearson's correlation for parameters of the variables did not indicate statistically significant differences
Figure 2: The correlation between serum protein concentration and adequacy of HD (Kt/V index ranging from 0.5 to 3) was positive (r=0.21; p=0.0446).
Discussion
Since the time when Quinan (1826) and Christison (1829) substantiated that an increased concentration of urea characterizes patients who suffer from kidney insufficiency, and up to the time when HD was introduced as a method of treatment, there have been attempts to quantify the implemented therapeutic procedure. Dialysis is an adequate medical treatment if it enables patients to achieve full rehabilitation. That includes satisfactory nutritional intake, normalization of hypertension and correction of anemia, as well as lack of symptoms of uremic neuropathy. In the early seventies of the last century, Gotch and Sargent and later on Daurgirdas and Schneditz quantified the dialysis dose through a formula, based on a mathematical model and taking into account objective labolaboratory parameters. The K-DOQI recommends that the Kt/V value should not be lower than 1.25. In our study, one third of the patients had the recommended HD level. Causes of malnutrition might be sought in the very nature of the kidney disease, in some adjunct co-morbid disease, lack of appetite, inappropriate diet, low dose of dialysis, deficits of glucose and amino acids during HD, acidosis and the occurrence of chronic infections6. By improving the effects of dialysis, removing uremic toxins and increasing the HD adequacy index, we may stimulate appetite and thus contribute to enhancing the intake of nutritious elements5. Nutritive status is estimated on the basis of biochemical parameters, but the reference values are arguable, because all available evidence indicates that there is no consensus about the normal state7,8.
Yang et al. confirmed that an increase of protein level improves the Kt/V index as these two parameters were significantly correlated and are important for the quality of life of HD patients9. Increased synthesis of ferritin and C-reactive protein occurs as a response of the body to acute inflammation1,8,10,11. Increased risk of cardiovascular mortality characterizes dialysis patients, particularly those with a low level of dialysis depuration12,13. Our results showed that the number of leukocytes and level of C-reactive protein were significantly increased in patients who received inadequate hemodialysis. This might be a consequence of an unfavorable nutritive balance and also be a cause of increased mortality risk.
The serum protein concentration, which is used routinely as a marker of nutritive status, is the result of synthesis, catabolism and volume re-distribution, as well as transcapillary exchange loss9. Our patients with the recommended index of HD adequacy had significantly higher serum concentrations of total protein and albumin and we established that there was a positive association between these parameters. The nutritional status of HD patients, independently from the dialysis prescription, has a great impact on morbidity and mortality14. The recommendations for protein intake of dialysis patients are not clear, although the NKF-DOQI recommends a minimum of 1.2 g/kg/day, because a hyperprotein diet might have negative repercussions on their health, as a significant source of uremic toxins, phosphates and hydrogen ions. Therefore, it is necessary to increase the dose of dialysis in order to compensate for the possibility of uremic intoxication, hyperphosphatemia and metabolic acidosis. Our results do not verify other findings2 which, although not implicitly, indicate a negative correlation between duration of dialysis and index of dialysis adequacy. Namely, we observed that HD adequacy was significantly better in patients who had been receiving dialysis for a longer time.
Providing sufficient nutritional input micronutrients, protein and energy matter is the right measure of a good diet regime in patients on HD7,15,16. Improvement of the quality of life of HD patients with an adequate Kt/V index, as indicated by the hemoglobin concentration and homeostatic regulation of pre-dialysis potassium, was confirmed in our research. Namely, the anemic syndrome and electrolytic regulation were significantly better in patients whose Kt/V index indicated adequate dialysis.
Despite certain limitations, the biochemical parameters of nutrition and anthropometric characteristics of the patients in our study represent significant factors for evaluation of HD adequacy.
References
- 1.Nunes FT, de Campos G, Xavier de Paula SM, Leandro Merhi VA, Portero-Mclellan KC, da Motta DG, et al. Dialysis adequacy and nutritional status of hemodialysis patients. Haemodialysis Int. 2008;12:45–51. doi: 10.1111/j.1542-4758.2008.00239.x. [DOI] [PubMed] [Google Scholar]
- 2.Chazot C, Laurent G, Charra B, Blanc C, VoVan C, Jean G, et al. Malnutrition in long-term haemodialysis survivors. Nephrol Dial Transplant. 2001;16:61–69. doi: 10.1093/ndt/16.1.61. [DOI] [PubMed] [Google Scholar]
- 3.Kooman J, Basci A, Pizzarelli F, Canaud B, Haage P, Fouque D, et al. EBPG guideline on haemodynamic instability. Nephrol Dial Transplant. 2007;22:22–44. doi: 10.1093/ndt/gfm019. [DOI] [PubMed] [Google Scholar]
- 4.Fouque D, Vennegoor M, Ter Wee P, Wanner C, Basci A, Canaud B, et al. EBPG Guideline on Nutrition. Nephrol Dial Transplant. 2007;22:45–87. doi: 10.1093/ndt/gfm020. [DOI] [PubMed] [Google Scholar]
- 5.Locatelli F, Buoncristiani U, Canaud B, Köhler H, Petitclerc T, Zucchelli P. Dialysis dose and frequency. Nephrol Dial Transplant. 2005;2:285–296. doi: 10.1093/ndt/gfh550. [DOI] [PubMed] [Google Scholar]
- 6.Stolicì R, Trajkovicì G, Pericì V, Jovanovicì A, Stolicì D, Sovticì S, et al. Frequency and characteristics of metabolic disorders in patients on hemodialysis. Vojnosanit Pregl. 2008;3:205–209. doi: 10.2298/vsp0803205s. [DOI] [PubMed] [Google Scholar]
- 7.Yee-Moon Wang A, Woo J, Wang M, Man-Mei Sea M, Sanderson JE, Lui SF, et al. Independent effects of residual renal function and dialysis adequacy on actual dietary protein, calorie, and other nutrient intake in patients on continuous ambulatory peritoneal dialysis. J Am Soc Nephrol. 2001;12:2450–2457. doi: 10.1681/ASN.V12112450. [DOI] [PubMed] [Google Scholar]
- 8.Kamimura MA, Majchrzak KM, Cuppari L, Pupim LB. Protein and energy depletion in chronic hemodialysis patients: Clinical applicability of diagnostic tools. Nutr Clin Pract. 2005;2:162–175. doi: 10.1177/0115426505020002162. [DOI] [PubMed] [Google Scholar]
- 9.Young DO, Lund RJ, Haynatzki G, Dunlay RW. Prevalence of the metabolic syndrome in an incident dialysis population. Hemodialysis Int. 2007;11:86–95. doi: 10.1111/j.1542-4758.2007.00158.x. [DOI] [PubMed] [Google Scholar]
- 10.Yee-Moon Wang A, Woo J, Wang M, Man-Mei Sea M, Sanderson JE, Lui SF, et al. Important differentiation of factors that predict outcome in peritoneal dialysis patients with different degrees of residual renal function. Nephrol Dial Transplant. 2005;2:396–403. doi: 10.1093/ndt/gfh331. [DOI] [PubMed] [Google Scholar]
- 11.Kopple JD. Pathophysiology of protein-energy wasting in chronic renal failure. J Nut. 1999;1:247–251. doi: 10.1093/jn/129.1.247S. [DOI] [PubMed] [Google Scholar]
- 12.Olof PS, Bengt HL. Wasting, but not malnutrition, predicts cardiovascular mortality in end-stage renal disease. Nephrol Dial Transplant. 2004;19:2181–2183. doi: 10.1093/ndt/gfh296. [DOI] [PubMed] [Google Scholar]
- 13.Johnson DW, Craven AM, Isbel NM. Modification of cardiovassscular risk in hemodialysis patients: An evidence-based review. Hemodialysis Int. 2007;11:1–14. doi: 10.1111/j.1542-4758.2007.00146.x. [DOI] [PubMed] [Google Scholar]
- 14.Eckel HR. Nonsurgical management of obesity in adults. New Engl J Med. 2008;358:1941–1950. doi: 10.1056/NEJMcp0801652. [DOI] [PubMed] [Google Scholar]
- 15.Termorshuizen F, Dekker FW, van Manen JG, Korevaar JC, Boeschoten EW, Krediet RT, NECOSAD Study Group Relative contribution of residual renal function and different measures of adequacy to survival in hemodialysis patients: An analysis of the Netherlands Cooperative Study on the adequacy of dialysis (NECOSAD)-2. J Am Soc Nephrol. 2004;15:1061–1070. doi: 10.1097/01.asn.0000117976.29592.93. [DOI] [PubMed] [Google Scholar]
- 16.Kloppenburg WD, Stegeman CA, Hooyschuur M, Van Der Ven J, De Jong PE, Huisman RM. Assessing dialysis adequacy and dietary intake in the individual hemodialysis patient. Kidney Int. 1999;55:1961–1969. doi: 10.1046/j.1523-1755.1999.00412.x. [DOI] [PubMed] [Google Scholar]


