

Abstract
Evidence indicates that visual stimuli influence cells in primary auditory cortex. To evaluate potential sources of this visual input and how they enter into circuitry of the auditory cortex, we examined axonal terminations in primary auditory cortex from non-primary extrastriate visual cortex (V2M, V2L) and from the multimodal thalamic suprageniculate nucleus (SG). Gross biocytin/BDA injections into SG or extrastriate cortex labeled inputs terminating primarily in superficial and deep layers. SG projects primarily to layers I, V and VI, V2M and V2L project primarily to layers I and VI with V2L also targeting layers II/III. Layer I inputs differ in that SG terminals are concentrated superficially, V2L deeper and V2M are equally distributed throughout. Individual axonal reconstructions document that single axons can 1) innervate multiple layers, 2) run considerable distances in layer I, and 3) run preferentially in the dorsoventral direction similar to isofrequency axes. At the electron microscopic level SG and V2M terminals are 1) the same size regardless of layer, 2) non-GABAergic, 3) smaller than ventral medial geniculate terminals synapsing in layer IV and 4) make asymmetric synapses onto dendrites/spines which 5) are non-GABAergic and 6) are slightly larger in layer I. Thus, both areas provide a substantial feedback-like input with differences that may indicate potentially different roles.
Keywords: feedback projection, electron microscopy, multisensory
INTRODUCTION
Multisensory integration is essential for normal sensory processing (Driver and Spence, 2000; Calvert and Thesen, 2004). Such integration of multimodal clues can provide a more complete and clearer perception of the world by enhancing detection or aiding resolution of stimuli that otherwise can be ambiguous in a single modality. Deficits in this multisensory integration result in loss of these perceptual enhancements and have been reported in disorders such as autism (Iarocci & McDonald, 2006), schizophrenia, (Ross et al., 2007), and dyslexia (Hairston et al., 2005).
Visual stimulation robustly affects auditory perception. Visual cues are well known to alter spatial localization of sounds (Howard and Templeton, 1966), perception of speech sounds (McGurk and MacDonald, 1976), and auditory sensitivity (Lovelace et al., 2003). Efforts toward understanding neural bases of multisensory interactions in cortex have focused on specialized higher-order multisensory “association” areas (e.g., Hyvärinen, 1982; Wallace et al., 1992, Stein, 1998). However, recent evidence indicates that multisensory interactions can also occur early in the cortical hierarchy – even in primary sensory areas typically thought to be “unimodal” in nature; this includes primary auditory cortex (for reviews, see Schroeder and Foxe, 2005; Ghazanfar and Schroeder, 2006; Kayser and Logothetis, 2007). While most effort has focused on somatosensory-auditory interactions (Murray et al., 2005; Lakatos et al., 2007), recent work shows visual responses or visual-auditory interactions in primary auditory cortex (e.g., Molholm et al., 2002; Brosch et al., 2005; Bizley et al., 2007; Martuzzi et al., 2007; Harris et al., 2007, Kayser et al., 2007, 2008). These findings indicate clearly that visual information enters auditory cortex and affects responses to auditory stimuli. However, the anatomical pathways through which visual information reaches auditory cortex are poorly understood.
There are several possible routes through which visual information may reach primary auditory cortex (Driver and Spence, 2000; Schroeder and Foxe, 2005), which can be grouped broadly into projections from multisensory cortical areas (e.g., Barnes and Pandya, 1992; Hackett et al., 1998; Romanski et al., 1999; Smiley et al., 2007), from patently visual cortical areas (Bizley et al., 2007; Budinger et al., 2006), and from visual-dominant or multisensory subcortical nuclei (Barnes and Pandya, 1992; Hackett et al., 1998; Romanski et al., 1999; Budinger et al., 2006; Smiley et al., 2007). Primary auditory cortex may also inherit multisensory information from predominantly auditory subcortical structures (e.g. Porter et al., 2007, Yu et al., 2009).
A major source of visual input to auditory cortex may arise from visual cortex. Evidence from retrograde tracing studies (Bizley et al., 2007; Budinger et al., 2006), reveal an abundant scattering of cells in extrastriate visual cortical areas following auditory cortex gross injections. These cells appear restricted to areal regions that represent the peripheral visual field. The only anterograde tracing study using autoradiographic methods (Miller and Vogt, 1984) revealed silver grains over layers I–III and V in rat primary auditory cortex following gross injections into extrastriate visual areas both medial and lateral to area 17 (V1).
A second potential source of visual information to auditory cortex is the suprageniculate (SG) nucleus of the thalamus. While the SG nucleus is closely associated with the auditory thalamus and has neurons that respond to auditory stimuli, it receives information from other modalities as well (Bordi and LeDoux, 1994a,b; Linke, 1999; Zhang and Giesler, 2005) Evidence in cat suggests that SG neurons convey visual information to auditory cortex. Vision is the dominant modal response of the majority of cat SG neurons (Benedek et al., 1997; Paroczy et al., 2006), and this prevalence appears to reflect robust innervation from the visual layers of the superior colliculus (Katoh and Benedek, 1995). A similar robust SC innervation occurs in the rat (Linke, 1999) but it is not yet established if SG neurons that project to primary auditory cortex carry visual information.
Limited light microscopic information is available on the SG to auditory cortical projection. Anterograde tracing indicates SG axons project strongly to auditory cortex and, in primary cortex, target primarily layer I and deep layers (Linke and Schwegler, 2000; Kimura et al., 2003), a laminar pattern that is often deemed “feed-back“ or “modulatory” in nature (cf. Schroeder and Foxe, 2002).
Identification of cortical layers targeted by a particular input at the light microscopic level is problematic because of the nature of cortical cells. Many cortical cells, in particular pyramidal cells, have dendrites that extend over multiple layers. As a result terminals ending in, for example, layer I could be synapsing on the cell bodies of GABAergic interneurons, the only cell type located in this layer, or on the dendrites of pyramidal cells whose cell bodies are located in other layers as far away as layer V. Thus, in order to fully understand the impact of these SG and visual cortical inputs on primary auditory cortical function, we need to know not only the laminar targets, but how the axons enter into auditory neural circuitry – what cellular loci (e.g., somata, dendrites) and cell types (e.g., GABA-negative, GABA-positive) are targeted. To accomplish this we have combined electron microscopic analysis with post-embedding immunohistochemistry for the inhibitory neurotransmitter, GABA, to reveal the nature of post-synaptic targets of SG and visual cortical axons. In addition, at the light microscopic level, we have also made a more quantitative evaluation of the distribution of terminals in cortical layers and of the innervation patterns of individual thalamocortical and corticocortical axons.
MATERIALS AND METHODS
All methods were approved by the University of Wisconsin School of Medicine and Public Health Animal Care and Use Committee. Animals were maintained in an Association for Assessment and Accreditation of Laboratory Animal Care-approved facility. Experiments were carried out in accordance with the guidelines published in the National Institute of Health Guide for the Care and Use of Laboratory Animals. Adult male Long Evans rats (>300 g, Harlan) were maintained on a 12 hour light/dark cycle in standard University of Wisconsin animal housing with food and water ad libitum. All necessary steps were used to minimize suffering and the number of animals used.
Extracellular injection experiments
Animals were anesthetized with sodium pentobarbital (35 mg/kg, I.P.) or with ketamine (70–90 mg/kg I.P.) plus xylazine (8–10 mg/kg I.P.), with supplemental doses of 1/3 the initial doses and xylazine supplements administered only one third as often as ketamine supplements, as needed to maintain surgical level anesthesia. The deeply anesthetized rat was prepared for aseptic surgery and placed in the stereotaxic apparatus. Body temperature was maintained at 36OC using a heating blanket with feedback control via a rectal thermometer.
Suprageniculate injections
To study thalamocortical terminals in primary auditory cortex, gross Neurobiotin (Vector Labs) or Biotinylated dextran amine (BDA, Sigma) injections were made unilaterally into the suprageniculate nucleus (SG). Animals were anesthetized with sodium pentobarbital (35 mg/kg, I.P.). Body temperature was maintained at 36OC using a heating blanket with feedback control via a rectal thermometer. Following anesthesia, an incision was made in the scalp exposing the dorsal surface of the skull. A hole was drilled from 4.8 to 6.3 mm caudal to bregma and 3 mm lateral to the midline (the stereotaxic coordinates of SG). A glass electrode (outer tip diameter of 20–30 μm, filled with 6% Neurobiotin in 0.9%NaCl or 8% biotinylated dextran amine (BDA) was visually guided to the exposed dorsal surface of the cortex and manually advanced 4 mm into the brain. According to the Paxino and Watson (2007) brain atlas this positioned the electrode a few hundred microns above the SG. The electrode was then advanced in 5–10 μm steps with a hydraulic manipulator while wide band noise bursts from a free field speaker positioned 15 cm from the contralateral ear were presented (1 stimulus/second). The electrode was advanced until an evoked auditory response was seen or before a depth of 5.3 mm was reached (the ventral edge of SG). Neurobiotin or BDA was injected iontophoretically (Neurobiotin, 25–30 μA anodal current −7 seconds on, 7 seconds off; BDA 5–10 μA anodal current –7 seconds on, 7 seconds off) for either 20 (BDA) or 25 (Neurobiotin) minutes. The electrode was left in place for an additional 20 minutes and withdrawn.
Visual cortex injections
To study corticocortical terminals in primary auditory cortex, gross Neurobiotin/BDA injections were made into the cortex located just medial to primary visual cortex designated V2M by Paxino and Watson (2007). Studies have indicated that this region is part of the rat visual cortex (e.g. Espinoza and Thomas, 1983) but its position in the visual cortical hierarchy is still in question (e,g. Coogan and Burkhalter 1993, Rosa and Krubitzer, 1999, Rumberger et al. 2001) There is also a secondary visual cortical area (V2L) situated more laterally, between primary visual and auditory cortices, but because some of this region in rat has been shown to respond to multimodal cues (Barth et al., 1995) we restricted our analysis primarily to V2M. After anesthesia, a midline incision was made exposing the dorsal surface of the skull. Rat extrastriate visual cortical areas extend rostrocaudally from 4.2 to 9.3 mm caudal to Bregma. A craniotomy 1.5 mm in diameter was drilled and injections into V2M were targeted between 5.0 to 7.5 mm caudal to Bregma and 2–3 mm lateral to the midline. Injections into V2L were made 6.3 mm caudal to bregma and 5.5 to 6 mm lateral to the midline. For large injections a 1 μl Hamilton syringe was advanced 600 μm. From 0.4–0.5 μl of a 6% solution Neurobiotin was injected into the cortex over a 15–20 minute period. The syringe was left in place for an additional 20 minutes and withdrawn. For smaller injections of 6% Neurobiotin or 8% BDA the iontophoretic method described above was employed.
Post-injection Processing
Section preparation
After the gross injections the electrode/syringe was removed and the wound margins were closed by suture or surgical staples and treated with a broad spectrum antibiotic and lidocaine. 24 hours (Neurobiotin injections) or 7 days (BDA injections) later the rat was given an overdose of sodium pentobarbital and perfused through the heart with 100–200 ml of 0.9% phosphate buffered saline followed by 1000 ml of a 3% paraformaldehyde/1% gluteraldehyde solution in 0.1M sodium phosphate buffer (pH 7.4).
The tissue was refrigerated for 1 hour and the brain removed and placed in the same fixative overnight. 70–80 μm thick coronal or horizontal sections were cut with a vibratome and the tracer visualized using the DAB-nickel/cobalt intensification method (Adams, 1981). Sections were rinsed in phosphate buffer and these free floating sections inspected with a light microscope to determine whether the gross injection had successfully labeled axons and axon terminals in primary auditory cortex. Some of the sections containing the axon terminals in the cortex were selected to be processed for electron microscopy. Sections not selected for electron microscopy were mounted on slides and dehydrated. Half of these sections were stained with cresyl violet and coverslipped while the other half was coverslipped unstained.
Those sections selected for electron microscopic analysis were fixed in 0.5% osmium tetroxide for 30 minutes, rinsed in buffer, and dehydrated through a series of graded alcohols and propylene oxide. Sections were then placed in unaccelerated Epon-Araldite resin for 1 hour at room temperature and then transferred into a fresh batch of unaccelerated resin overnight. The sections were then embedded and flat mounted in accelerated resin between weighted, coated slides an allowed to cure at 65O C. for 48 hours. The portion of the embedded section containing the auditory cortex was isolated from the rest of the section and mounted on a beam capsule. A camera lucida drawing of the flat mounted tissue was made at 200X noting the location(s) of the labeled axons/terminals and nearby fiduciary structures such as blood vessels. Seventy to eighty nanometer thin sections were then cut and mounted on coated nickel grids.
GABA post-embedding immunogold labeling
An affinity isolated anti-GABA antibody (Sigma-Aldrich, Catalog No. A2052, St. Louis, MO) was used to evaluate the GABAergic nature of the terminals. The antibody was raised in rabbit against γ-aminobutyric acid conjugated to bovine serum albumin (BSA). The antibody was isolated from antiserum by immunospecific purification methods that remove proteins, including immunoglobulins, that do not bind specifically to GABA. Anti-GABA shows positive binding in a dot blot assay with GABA and with GABA- keyhole limpet hemocyaninin and negative binding with BSA (Sigma product information). Binding of the antibody to the tissue is not blocked by BSA.
The thin section, mounted on a nickel grid, was carefully immersed in solution A (0.745g Tris buffer, 0.9g NaCl, 0.1ml Triton X in 100 ml dH2O, pH 7.6) and 5% BSA for 30 minutes then in solution A and 1% BSA for 5 minutes then in solution A and 1% BSA containing the GABA antibody at 1:250 dilution at room temperature overnight. The following day the section was rinsed in solution A and 1% BSA twice for 5 minutes and once for 30 minutes then rinsed in solution B (0.688g Tris buffer, 0.9g NaCl, 0.1 ml Triton X in 100 ml dH2O, pH 8.2) for 5 more minutes. The section was then immersed in the secondary antibody (goat anti-rabbit IgG with attached 15 nm gold particles) diluted 1:25 in solution B (pH 8.2) for 1 hour and rinsed twice for 5 minutes each in solution A and twice for 5 minutes in distilled water. After that they were fixed in 8% EM grade gluteraldehyde, rinsed in distilled water and then counterstained with uranyl acetate and lead citrate and rinsed again. Sections were examined using a Philips CM120 electron microscope. Control sections were prepared by the same method described above but the primary antibody was omitted during the overnight immersion. When observed with the electron microscope control sections had a uniformly low background of around 0.6 gold partical/μm2.
In our rat auditory cortex tissue, somata in layer I immunostained for GABA as did a subset of smaller neurons in layers II-VI. In contrast, larger somata with pyramidal morphology were always GABA-negative. GABA-positive terminals typically contained flat or elliptical synaptic vesicles and, when viewed in appropriate plane of section, formed symmetrical contacts. These findings are consistent with those reported previously for GABA staining patterns in sensory cortex (e.g., Meinecke and Peters, 1987; Beaulieu et al, 1994). As an additional positive control, we looked at GABA antibody staining in the thalamic reticular nucleus (TRN) taken from the same tissue. Previous reports have indicated that virtually all cells in the rat TRN are GABAergic (Houser et al., 1980, de Biasi et al., 1986). The GABA antibody positively identified cells in rat TRN with antibody levels that exceeded 5X the background level.
Analysis of axon terminals and serial reconstruction, light microscopy
To evaluate the distribution of labeled terminals a high power (1000X) camera lucida drawing of a narrow strip of primary auditory cortex was made from the cortical surface to the white matter below layer VI. All en passant and en terminaux swellings on labeled axons in this cortical strip were represented on the drawing. Cortical layer I-VI boundaries were then added to the drawings based on the report of Zilles and Wree (1985, their Figure 14) and the number of terminals in each cortical layer counted (see Figures 2–4).
Figure 2.

V2M injection and axon labeling in primary auditory cortex. A. Distribution of swellings on BDA-labeled V2M axons in a strip of primary auditory cortex running from the cortical surface to the white matter taken approximately 4.4 mm caudal to bregma. Each dot represents a swelling. Dotted lines divide the strip into 50 μm parcels. Location of layer boundaries and percentage of the total swellings in each layer is indicated below. Plot of the number of terminals in each 50 μm parcel illustrated above. B. Photomicrograph of the injection site (asterisk) in V2M. C. Camera lucida drawings of labeled axons in five coronal sections through right auditory cortex from caudal (left) to rostral (right). Arrows demarcate boundaries between various cortical areas. Numbers above sections represent distances from bregma. The dashed line segments indicates the border between layer VI and the white matter. Dorsal is to the top. Abbreviations: AuD = secondary auditory cortex, dorsal, AuV = primary auditory cortex, ventral, Au1 = primary auditory cortex, Ect = ectorhinal cortex, MGB = medial geniculate nucleus, RS = retrosplenial cortex, SC = superior colliculus, TeA – temporal association cortex, V1 = primary visual cortex.
Figure 4.

SG injection and axon terminal distribution in primary auditory cortex. A. Photomicrograph of the injection site in SG approximately 5.3 mm posterior to bregma. Horizontal white arrows indicate the blood vessels that distinguish the boundary between MGV and MGD as well as SG and MGM at this rostrocaudal level. Curved arrow indicates injection site. Inset shows location of labeled cells in an adjacent section relative to the boundaries of SG (dotted line). Circle at lower left is the left blood vessel seen in the photomicrograph. B. Camera lucida drawing of a coronal section through auditory cortex approximately 4.3 mm posterior to bregma. Shaded area indicated by asterisk represents the strip of cortex illustrated in C. C. Distribution of swellings on BDA labeled SG axons in the strip of primary auditory cortex highlighted in B. Each dot represents a swelling. Dotted lines divides strip into 50 μm parcels. Location of layer boundaries and percentage of the total swellings in each layer are indicated at left. Plot of the number of terminals in each 50 μm parcel illustrated on right. Abbreviations as in Fig. 2 and CA1 = field CA1 of hippocampus, CA2 = field CA2 of hippocampus, CA3 = field CA3 of hippocampus, cp = cerebral peduncle, DLG = dorsal lateral geniculate nucleus, fi = fimbria, MGD = Dorsal medial geniculate nucleus, MGM Medial medial geniculate nucleus, MGV = Ventral medial geniculate nucleus, opt = optic tract, p = electrode penetration site, PRh = perirhinal cortex, VLG = ventral lateral geniculate nucleus, VPN = Ventoposterior nucleus, wm = white matter.
To evaluate the course of an individual axon the cortex was scanned for an axon that could be followed for some distance relatively independently of other labeled axons in the vicinity. Axons were reconstructed by means of a camera lucida attachment and brightfield optics on a Leitz Orthoplan (Germany) microscope. High power (100X oil objective) camera lucida drawings from serial tissue sections were incorporated into axon reconstructions, which were then digitally scanned and final figures prepared using Adobe Photoshop 5.5 and PowerPoint 2003 (See Figures 6 and 8). All reconstructed axon processes were completed to the fullest extent possible. Termination of an axonal branch occurred when the process ended in a terminal swelling. When a specific axon or branch could not be followed unambiguously within the same section or into an adjacent section, it was marked with an asterisk in the reconstruction. Primary auditory cortex was characterized by a relatively specific differentiation of its cortical layers, with a thick and dense granular layer (Zilles and Wree, 1985; Roger and Arnault, 1989, Paxino and Watson, 2007).
Figure 6.


Serial reconstruction in the coronal plane of labeled V2M axons in primary auditory cortex following injection into V2M. Axons in A and C are in left auditory cortex and resulted from an injection into left V2M. Axons in B, D and E are in right auditory cortex and resulted from Injection in right V2M. Asterisks designate branches that could not be followed to termination. Edge of the tissue is indicated by solid line. Laminar boundaries indicated by dotted lines. Dorsal is to the top.
Figure 8.

Serial reconstructions in the coronal plane of labeled axons in primary auditory cortex following injection into ipsilateral SG. Asterisks designate branch that could not be followed to termination. Edge of the tissue indicated by solid line. Laminar boundaries indicated by dotted line. Dorsal is to the left. Scale bar in G applies to all drawings.
To evaluate the distribution of terminal swellings generated by a single labeled axon in layer I the distribution and number of en passant and en terminaux swellings in each 70 μm tissue section were evaluated. This was done by counting the number of swellings in 70 μm lengths of layer I from the dorsal to ventral border of primary auditory cortex on the 1000X drawing of each tissue section. These counts/locations of swellings in each 70 μm tissue section were then merged in sequence to form a surface plot of auditory cortex where the concentration of terminals in each 70X70 μm square of tissue is represented by the size of the symbol at that location (see Figure 7).
Figure 7.

Surface plot summaries of reconstructed V2M axons A, B and E from Figure 6. Individual circles in each plot indicate the number of swellings within a 70X70 μm sector of tissue viewed laterally on the cortical surface. Only swellings in layers I and II are included. Positions of axons accurately reflect their locations relative to the dorsal and ventral boundaries (dotted lines) of primary auditory cortex and their relative size.. Their rostrocaudal position is offset to allow viewing of individual axons, which otherwise overlap. Background shading reflects the relative density of the en masse projection from the V2M injection site illustrated in Figure 1A.
Analysis of axon terminals and their postsynaptic targets, electron microscopy
For analyzing neurobiotin/BDA-labeled axon terminals in primary auditory cortex arising from SG or V2M the following procedure was established. A given thin section was manually scanned at 10,000X. After identifying a labeled synaptic terminal, based on the presence of vesicles pre-synaptically and a post-synaptic thickening of the membrane apposed to the terminal, a photo of the terminal was taken at 29,000X and its exact location noted on the 200X camera drawing that had been made of the block face prior to sectioning (see above). Using the 29,000X image measurements of the labeled terminal and its postsynaptic target were made for each synapse using The NIH Image/J 1.60 software. Other terminal features were also noted.
In GABA-immunogold labeled material, the “background” gold particle density was calculated for each thin section to account for possible processing differences between sections. Aggregates of 2 or more particles were counted as a single particle. Axon terminals or their postsynaptic targets were considered GABAergic if their particle density exceeded the mean gold particle density of the background by 5 times. Background density was measured at points in the embedding plastic (Epon-Araldite) where no tissue was found and at points in the embedded tissue where non-GABAergic structures such as blood vessel lumens, glial cells etc could be seen.
Statistical tests
Statistical comparisons of electron microscopic measurements were made on profiles quantified via Minitab software (Minitab). For all results, unpaired t-tests with Welch correction as needed were used to determine whether groups differed significantly with p<0.05 used as the minimum criterion for statistical significance. Results are reported as mean ± S.D.
Digital processing of images
Digitized light level photomicrographs were acquired in black and white with a Spot camera (Diagnostic Instruments) mounted on a Nikon Eclipse E600 microscope using a 40X oil objective, brightfield illumination, and Nomarski optics. The final figures were prepared using Adobe Photoshop 5.5, and tonal adjustments were applied across the entire image (levels and curves functions) with no further manipulations.
RESULTS
We made 5 injections in and around the SG nucleus of the thalamus. In the rat the boundaries of the SG may be distinguished using several anatomical features. First a blood vessel is commonly found in the rat which, in the rostral half of the MGB, marks the boundary between MGV and MGD (Clerici and Coleman, 1990) This same blood vessel also demarcates the boundary between MG and MGM (see Figure 4A). The lateral boundary of SG, between MGD and SG, may be distinguished by the transition from evenly spaced rounded cells of similar size (MGD) to more unevenly distributed cells with a more elongate appearance (Clerici and Coleman, 1990, 1998). Three of the injection sites appeared to also encroach upon MGD and/or MGM, nuclei adjacent to SG. Two of the injections were confined to SG and were used for analysis. We also made three injections that were confined to the extrastriate region medial to primary visual cortex designated V2M (Paxinos and Watson, 2007). Based on their locations these injections were confined to areas designated the anteromedial (AM) or the rostral aspect of posteromedial (PM) regions of extrastriate cortex as defined by the physiological receptive field maps of Espinoza and Thomas (1983). This area has also been designated the rostral aspect of MX by Coogan and Burkhalter (1993) based on anatomical connections. Two injections were also made that were confined to the V2L extrastiate region of visual cortex. Based on their locations these injections were confined to rostral areas of extrastriate cortex designated anterolateral (AL) or lateromedial (LM) as defined by the parcellation schemes of both Espinoza and Thomas (1983) and Coogan and Burkhalter (1993).
Our gross injection experiments in SG and V2 yielded consistent and robust labeling of axons in primary auditory cortex as well as some labeling in other auditory cortical areas surrounding primary auditory cortex. Primary auditory cortex is defined here as any portion of auditory cortex that has a thick dense granular layer and receives its primary layer 3–4 thalamocortical input from MGV. This would include areas designated Au1 and AuV by Paxinos and Watson (2007) also called Te1 by Romanski and LeDoux (1993) which probably includes physiologically defined areas designated AI and P by Doron et al. (2002). These anterogradely labeled axons displayed both en passant swellings along the length of the axon (Figure 1A,B, white arrowheads) and en terminaux swellings at the end of short side branches (Figure 1,B, black arrowheads). The latter were much more prevalent on the SG axons. Similar injections confined to primary visual cortex did not generate such a projection to primary auditory cortex (not shown).
Figure 1.

Labeled V2M and SG axons in Au1. A. Photomicrograph of labeled V2M axons in supragranular layers. Dotted line represents the cortical surface. One axon (arrow, lower left) trifurcates/branches after entering from adjacent cortical layers and another (arrow, top right) travels along the cortical surface. B. Photomicrograph of a labeled SG axon that branches close to the layer III/IV border. Several en passant (white arrowheads) and en terminaux (black arrowheads) terminal swellings are highlighted in A and B. Dorsal is to the left.
Terminal swelling distribution
The terminal swellings on anterogradely-labeled axons projecting from V2M were laminar-selective ending primarily in layers I and VI in primary auditory cortex (Figure 2) with minor projections to other layers. Although the relative density of this projection to primary auditory cortex varied depending on the rostrocaudal location (Figure 2C), layers I and VI were the consistent target. To determine the relative strength of the V2M to primary auditory cortical projection, we compared it in the same animal to that of the well-established V2M feedback projection to primary visual cortex. Counts indicated that the average swelling density per unit area of the V2M-to-primary auditory cortical layer I projection was 54% of the density of the V2M-to-V1 projection.
Injections confined to V2L labeled axons that also had significant projections to layers I and VI (Figure 3). The V2L projections to these layers differed in that 1) V2M terminals appeared equally distributed throughout the depth of layer I while V2L terminals in this layer were more concentrated in the lower half. 2) layer VI only contained about (23.9%) of the total number of V2L terminal swellings compared to almost (45.2%) in this layer arising from V2M. In addition, unlike the V2M projection the V2L injection provided a significant number of swellings in layers II/III equaling 43.9% of the total number of terminals. As with the V2M projection to primary auditory cortex the relative densities of the projection varied depending on the rostrocaudal location (Figure 3C) but the targeted layers were consistent. Further analysis of the V2L projection will be quantified in a subsequent paper and will not be discussed further.
Figure 3.

V2L injection and axon labeling in primary auditory cortex. A. Distribution of swellings on BDA-labeled V2L axons in a strip of primary auditory cortex running from the cortical surface to the white matter taken approximately 4.3 mm caudal to bregma. Each dot represents a swelling. Dotted lines divide the strip into 50 μm parcels. Location of layer boundaries and percentage of the total swellings in each layer is indicated below. Plot of the number of terminals in each 50 μm parcel illustrated above. B. Photomicrograph of the injection site in V2L (asterisk). C. Camera lucida drawings of labeled axons in five coronal sections through left auditory cortex from rostral (left) to caudal (right). Conventions as in Fig. 2.
Because SG is a relatively small nucleus we wanted to first assure ourselves that the thalamocortical axons we were evaluating did in fact arise from SG cells. To do this we made counts in four representative sections of cells labeled from the injection shown in Figure 4A. The location of cells in one of these sections is shown in the inset in Figure 4A. Of the 119 labeled cells, 106/119 were either in the SG (81/119) or on the SG/MGD border (25/119), 8/119 were in MGD, 5/119 in MGM, and 0 in MGV. Labeled thalamocortical axons arising from SG cells also displayed swellings primarily in superficial and deep layers (Figure 4C). The swellings in layer I were concentrated in the more superficial of that layer. Unlike the visual cortical projection where very little input was seen to layer V, over 1/4 of the SG terminals were found in this layer (Figure 4C).
Dorsoventral bias of axon trajectory
While evaluating the V2M projection to primary auditory cortex we noticed, in our coronal sections, that several of the labeled axon pieces in a single section of primary auditory cortex seemed to be running for long distances in the dorsoventral direction (Figure 1A, 5A). Isofrequency strips in rat primary cortex also run in the dorsoventral dimension (Sally and Kelly, 1988; Doron et al., 2002) which suggested that axons from V2M were running in parallel with the frequency axes. To objectively test for dorso-ventral bias we processed tissue from one injection in the horizontal plane. We then measured the length of 100 axon segments in a randomly selected part of layer I of this primary auditory cortical tissue and performed the same analysis for tissue from another injection processed in the coronal plane. A plot of the distribution of the measured length of these segments (Fig. 5B) clearly indicates that the axon segments on average are longer dorsoventrally (coronal plane, mean = 103.9 μm) than rostrocaudally (horizontal plane, mean = 68.4 μm: t-test, p<0.001), confirming the dorsoventral bias in the projection of V2M-primary auditory cortical axons.
Figure 5.

V2M axon segments in layer I. A. Camera lucida drawing of all the labeled V2M axons pieces in a small portion of layer I within a 70 μm coronal section of primary auditory cortex. B. Comparison of the lengths of 110 randomly selected axon pieces from layer I of 70 μm sections of primary auditory cortex cut in either the coronal (squares) or horizontal (circles) plane. Axon pieces are ordered from shortest to longest.
Single axon reconstructions
To eliminate the possibility of any methodological bias and to further verify the dorsoventral bias of the V2M axons in layer I of primary auditory cortex and to evaluate other features of the projection and arborization of V2M and SG axons we did serial reconstruction of individual axons. Following tracer injection into V2M, serial reconstruction revealed individual labeled axons that strongly innervated layer I as well as other layers of primary auditory cortex (Figure 6). Individual axons, many of which were followed back to the ipsilateral site of the V2M injection, exited from the white matter and headed perpendicular to cortical layers for much of their course to layer I (Figure 6A–C). Other axons exited the white matter and headed toward layer I at an angle to layer boundaries (Figure 6D). Upon reaching layer I in primary auditory cortex (Figure 6A–D), and in one case also in layers II/III (Figure 6A), axons commonly extended 2–4 axon collaterals that could branch secondarily resulting in extensive innervation of layer I dorsal and ventral to that branching point. Additional branching off the parent axon in layers V and/or VI terminated locally within those layers (Figure 6A–C). No infragranular branching was observed that led to a secondary axon that reached layer I. Some of the individual axons could extend across long distances dorso-ventrally within layer I of primary auditory cortex (Figure 6A, E). Axon E, which extends approximately 2 mm dorsoventrally, illustrates that layer I axons could also arise from an adjacent cortical area and could target a particular region of auditory cortex, in this case the dorsal portion of Au1. Axon E arose from the V2M injection site, ran in the white matter past the primary auditory cortex to just below perirhinal cortex. It then headed perpendicular through the perirhinal cortical layers to layer I and doubled back to layer I of primary auditory cortex (not shown).
Figure 7 shows a surface plot of primary auditory cortex with the distribution of terminal swellings in layers I and superficial II for the most completely reconstructed V2M axons (Axons A,B and E of Figure 6). The size of each circle is proportional to the number of swellings in a 70X70 μm square of tissue. This figure strengthens the argument made from the data seen in Figure 5 that the axons of V2M tend to arborize preferentially in a dorsoventral direction in superficial layers. The background fill in Figure 7 shows the breadth of the distribution of V2M labeled axons across primary auditory cortex as a result of a single injection illustrated in Figure 2B. Labeled axons were present and relatively dense throughout much of primary auditory cortex.
We also followed the individual thalamocortical axons of SG cells. For technical reasons these axons were more difficult to follow serially so the reconstructions were necessarily restricted to a range of 4 to 6 coronal sections (280–420 μm rostrocaudally). All serially reconstructed axons innervated layer I of primary auditory cortex (Figure 8). Many SG axons crossed the cortical layers nearly perpendicularly and multiple collateral branches arose shortly upon entering into layer I (Figure 8A–D, F). In one instance the axon entering layer I changed direction and headed for a considerable distance within the layer prior to branching (Figure 8H). Some axons ran for great distances dorso-ventrally in layer I (Figure 8G). This axon covered approximately 1.9 mm and entered primary auditory cortex from an adjoining cortical area. In two axons the parent axon crossed layer V more transversely (Figure 8E, F). Branching was sometimes observed in supragranular layers (those superficial to layer IV), which could lead to short terminal branches (Figure 8A, B), and in one axon, to more extensive secondary branching in layers I, II, III, and part of IV (Figure 8D). Branching was also observed in infragranular layers (those deep to layer IV), and includes shorter terminal branches (Figure 8B, E) and longer branches that extended through layer IV (Figure 8F) or as far as layer I (Figure 8E). The latter axon was unique in that it terminated abruptly with virtually no branching when it reached layer I.
Electron microscopy
Labeled SG and V2M terminals
We evaluated 152 SG and 80 V2M terminals in all layers of primary auditory cortex at the electron microscopic level. Figure 9 shows that we sampled terminals in all layers and that the percentages in each layer correlate well with the number of swellings seen in each layer at the light microscopic level (Figures 2 and 4). This would indicate that, in our preparation, the use of axonal swellings at the light microscopic level gives a reasonably accurate indication of the actual synaptic input to a given layer. Figures 10 and 11 illustrate some typical SG (Figure 10) and V2M (Figure 11) terminals and their post-synaptic targets. Because of the extensive reaction product in the pre-synaptic terminal it was usually not possible to distinguish features typically described for synaptic profiles. However we could distinguish asymmetric synaptic densities and round vesicles for both SG and V2M terminals. Figure 12 describes and compares the size of the presynaptic terminal profiles for SG and V2M terminals. The areas of both populations of SG and V2M terminals ranged from less than 0.1 μm2 to 1μm2, the distribution of terminal areas was similar (Figure 12A) and the overall means were not significantly different (SG = 0.29 ± 0.17μm2, V2M = 0.28 ± 0.19μm2, p = 0.66, n.s.). In addition when the size of SG terminals or V2M terminals was compared between layers (e.g. layer I versus layer II/III SG terminal size) there was no significant difference (this comparison could not be made between V2M terminals in layers IV and V and terminals in other V2M layers because of the small N in these two layers). Also, when the SG terminals in a given layer were compared with the V2M terminals in the same layer (Figure 12B) their size did not differ significantly (this comparison could not be done for layers IV and V because of the small number of V2M terminals found in these layers). The only previous electron microscopic analysis of inputs to rat primary auditory cortex was of thalamocortical cell axon terminals arising from rat primary auditory thalamus (MGV, Kharazia and Weinberg, 1994) that synapsed in layer IV. We were interested in comparing our data on terminal sizes with theirs. Figure 12C shows their replotted data of MGV terminals (N= 34) in layer IV and our SG and V2M data. Unfortunately we only found 3 V2M terminals in layer IV but our SG layer IV terminal population (N=15) had a mean area of 0.32 ± 0.17μm2 which was significantly smaller than their report of 0.43 ± 0.03μm2. for MGV terminals (P value = 0.026).
Figure 9.

Terminal/swelling distribution across layers in Au1. Light bars for each layer represent the percentage of SG synaptic terminals found in that layer during the EM analysis (upper bar) and the percentage of swellings in that layer seen on labeled SG axons during the LM analysis (lower bar). Dark bars in each layer represent the percentage of V2M synaptic terminals found in that layer during the EM analysis (upper bar) and the percentage of swellings in that layer seen on labeled V2M axons during the LM analysis (lower bar).
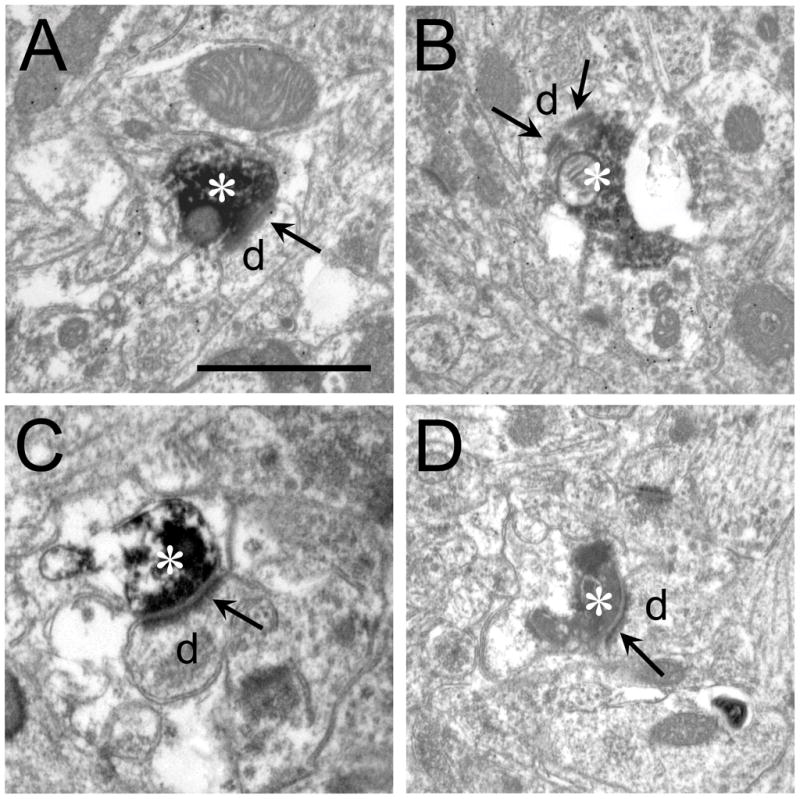
Figure 10.

SG terminals in primary auditory cortex. A-D. BDA-labeled SG terminals (asterisks) synapsing on small dendrites or spines (d). Arrows indicate post-synaptic density(s). In C there appears to be 2 densities on the same dendrite. A GABAergic terminal is seen in D (x), Scale bar = 1 μm and applies to all micrographs.
Figure 11.
V2M terminals in primary auditory cortex. A-D BDA-labeled SG terminals (asterisks) synapsing on small dendrites or spines (d). Arrows indicate post-synaptic density(s). In B there appears to be 2 densities on the same dendrite. Scale bar = 1 μm and applies to all micrographs.
Figure 12.

Axon terminals. A. Size distribution of terminals arising from SG (white bars) and V2M (shaded bars) axons in Au1 represented as a percentage of the total number of terminals. B. Mean area of SG and V2 terminals in different Au1 cortical layers. Numbers inside bars represent number of terminals evaluated in that layer. Number of V2M terminals in layers 4 and 5 too small to calculate a reliable mean area. C. Comparison of the size distribution of SG and V2M terminals in layer 4 with those arising from MGV axons and terminating in layer 4. MGV data re-plotted from Khazaria and Weinberg (1994).
Post – synaptic targets
The large majority of our SG (150/152) and V2L (80/80) terminals in all layers synapsed on spines or dendrites (Figures 10 and 11) with a least diameter <1 μm. We compared the least diameters of dendrites postsynaptic to V2M versus SG terminals (Figure 13A) in the same layers and found they did not differ significantly in size. When layers were grouped into supragranular versus infragranular layers (Figure 13B) or when all 6 layers were combined for SG or for V2 (Figure 13C) the dendrites/spines post-synaptic to labeled SG terminals versus V2L terminals were still not significantly different in size.
Figure 13.

Structures post-synaptic to labeled SG and V2M terminals. A. Least diameter of structures post-synaptic to SG (white bars) and V2M (dark bars) terminals in cortical layers. Number of structures post-synaptic to V2M terminals in layers 4 (N= 3) and 5 (N=2) were not large enough to give a reliable average and are not included. Asterisks indicate significant differences between layers. B. Least diameter of structures post-synaptic to SG (white bars) and V2M (shaded bars) terminals subdivided into supra-(layers I–III) and infragranular (layers V–VI) layers. C. Least diameter of structures post-synaptic to SG (white bar) and V2M shaded bar) terminals in all layers. D. Dendritic diameters of all structures post-synaptic to SG and V2M (combined) terminals in each cortical layer (striped bars) compared to the “typical” post-synaptic structure (white bars) in the same layer. Asterisks indicate layers with significant differences. E and F. Area (E) and least diameter (F) of all structures post-synaptic to SG (circles, N=152) and V2M (triangles, N=80) terminals from smallest to largest compared to “typical” post-synaptic structures (squares, N=390) in primary auditory cortex. Asterisks indicates that the structures post-synaptic to “typical” post-synaptic structures are significantly larger than structures post-synaptic to SG or V2M terminals. The dotted line in E represents the mean area of spines in auditory cortex reported by Kharazia and Weinberg (1994).
We next compared the dendrites/spines post-synaptic to labeled terminals across different layers separately for SG and V2M (figure 12A). Layer I dendrites/spines post-synaptic to SG terminals had significantly larger least diameters when compared to dendrites post-synaptic to SG terminals in layers II/III (p = 0.028) V (p = 0.015) and VI (p = 0.02). Likewise, the mean diameter of the dendrites post-synaptic to V2M terminals was the largest in layer I and significantly larger than those in layers II/III (p = 0.01). When we combined all the dendrites post-synaptic to SG or to V2M terminals in layers II-VI and compared them to dendrites postsynaptic to SG or V2M terminals in layer I, the layer I dendrites were significantly larger (SG p =.0001, V2M p = 0.017). Thus the dendrites/spines that SG and V2M terminals synapse on tend to be larger in layer I.
We also wanted to know how the size of the dendrites/spines that our labeled terminals were synapsing on compared to the “typical post-synaptic structure” in each layer. To do this we measured a population of 390 randomly selected postsynaptic dendrites/spines in all layers that did not have a labeled terminal synapsing on them. Several features were noted when comparing post-synaptic structures in a given layer that did or did not have a labeled terminal on them. First, the randomly selected dendrites/spines in a given layer were larger than those receiving a labeled synapse in that layer (Figure 13D) and the difference was significant in layers I (p = 0.019), II/III (p =0.035) and VI (p = 0.047) . Secondly, as a population, the randomly selected dendrites/spines were significantly larger in area (0.46 ± 0.55 μm2) and diameter (0.45 ± 0.22 μm) than dendrites/spines post-synaptic to labeled SG (area = 0.31 ± 0.32 μm2, p = 0.003; diameter = 0.39 ± 0.17 μm; p = 0.004) or V2M (area = 0.29 ± 0.51 μm2, p = 0.012; diameter = 0.35 ± 0.14, p = 0.0006) terminals (Figure 13E,F). Third, as we saw with dendrites/spines post-synaptic to labeled SG and V2M terminals, the randomly selected dendrites in layer I had significantly larger least diameters than randomly selected dendrites in other layers (I vs II/III, p = 0.004; I vs IV, p = 0.031; I vs V, p = 0.006; I vs VI, p = 0.026). Thus both SG and V2M terminals tend to synapse on smaller post-synaptic structures than the general population of post-synaptic structures and these post-synaptic structures tend to be larger in layer I.
Labeling for GABA
All of the BDA labeled SG and V2M terminals and their post-synaptic dendrites were evaluated for their GABAergic nature (e.g. Figure 10F). For both SG and V2M tissue the pre-synaptic and post-synaptic structures were almost always non-GABAergic. Only 4/152 (2.6%) SG terminals, 3/80 (3.7%) V2M terminals, and 5/152 (3.2%) and 2/80 (2.5%) of the structures post-synaptic to these SG and V2M terminals respectively met the criteria for being GABAergic (see Methods). We did on rare occasions (N=3) see a labeled SG (1) or V2M (2) terminal directly apposed to a GABAergic cell body or large (>0.1 mm) GABAergic dendrite but these profiles did not display a synaptic specialization and thus could not be included in the data analyzed here.
DISCUSSION
Summary of Results
We have evaluated the axonal projections and synaptic inputs from the rat suprageniculate nucleus and extrastriate visual cortex and thalamic suprageniculate nucleus. Inputs from both areas terminate primarily in superficial and deep layers of primary auditory cortex. SG axons project primarily to layers I,V and VI while V2M/V2L axons project primarily to layers I and VI, with V2L also targeting layers II/III. All of the inputs send sparse projections to layer IV and the deeper half of layer III where primary thalamocortical inputs abound. The layer I inputs differ in that SG terminals are concentrated in the superficial part of the layer, V2L terminals in the deeper part and V2M are distributed equally throughout the layer. Individual light microscopic axon reconstructions document that a single SG or V2M axon can 1) innervate multiple layers, 2) run for considerable distances in layer I, and 3) arborize preferentially in the dorsoventral direction similar to the orientation of isofrequency axes. At the electron microscopic level the terminals from both SG and V2M axons are 1) the same size regardless of cortical layer in primary auditory cortex, 2) non-GABAergic, 3) smaller than terminals from MGV synapsing in layer IV, and 4) make asymmetric synapses onto dendrites or spines which 5) are non-GABAergic and 6) are slightly but significantly larger in layer I.
Laminar termination pattern
Previous authors separate thalamocortical and corticocortical projections into three categories based on their cellular origins and laminar targets (Felleman and Van Essen, 1991; Budinger and Scheich, 2009). In brief, feedforward projections target layer IV, feedback projections target supra- and infra-granular layers, and lateral corticocortical projections target all layers of cortex. Our light microscopic data indicate that V2M and V2L project robustly to the superficial and deep layers of primary auditory cortex, with little or no layer IV innervation. These laminar patterns fit the feedback projection model. The cells giving rise to this V2-primary auditory cortex input arise primarily from infragranular layers consistent with predictions of the feedback model of corticocortical interactions (Budinger and Scheich, 2009). SG projections also terminate in superficial-and-deep layers of primary auditory cortex, similar to other extra-lemniscal thalamic projections from the MGM and posterior intralaminar nuclei (Linke and Schweigler, 2000). Our results thus suggest that all visual inputs to primary auditory cortex assume the “feedback” form and contrasts sharply with the feedforward thalamocortical projection pattern from rat MGV that targets deep layer III and layer IV (e.g. Ryugo and Killackey, 1974; Romanski and LeDoux, 1993; Kharazia and Weinberg, 1994; Kimura et al., 2003).
Thalamocortical input to auditory cortex
Previous data on the post-synaptic targets of thalamocortical terminals in auditory cortex are primarily from lemniscal MGV inputs. Labeled thalamocortical MGV terminals in layer IV of rat primary cortex made asymmetric synapses primarily on spines however it was not clear whether these spines were on dendrites of layer IV cells or pyramidal cells from deeper layers (Khazaria and Weinberg, 1994). Postembedding immunolabeling led to the conclusion that glutamate was the likely neurotransmitter for these terminals. Evidence from thalamocortical slice preparations (Cruikshank et al., 2002, Rose and Metherate, 2005, Lee and Sherman, 2008) confirmed the glutamatergic nature of this reliable, temporally precise synapse. A recent paper (Richardson et al., 2009) has shown that mouse thalamocortical terminals arising from MGV synapse on “stubby” spines on dendrites within 100 μm of pyramidal cells that populate layer IV while the locations and morphology of spines of layer IV pyramidal cells that receive corticocortical terminals are more scattered and not typically stubby.
Our paper provides the first quantitative evaluation of thalamocortical terminals arising from a non-lemniscal thalamic area and terminating in primary auditory cortex. Like the MGV inputs to layer IV (Khazaria and Weinberg, 1994), SG terminals synapsed on small dendrites and spines of pyramidal cells but their terminals were smaller and the layer distribution was drastically different being concentrated in layers I,V and VI and very sparse in layer IV and the deep half of III. It is interesting to note that, unlike the inputs from secondary visual cortex which were concentrated in layers I and VI, a fairly large number of SG terminals were in layer V. Layer V cells are a major source of projection to other auditory cortical areas and to subcortical structures including the thalamus, inferior colliculus, superior olivary complex and cochlear nucleus (e.g. Feliciano et al., 1995; Games and Winer, 1988; Doucet et al., 2003; Coomes and Scholfield, 2004; Winer, 2006).
Although some information is available on the physiological properties of synaptic inputs to auditory cortex from non-lemniscal thalamus (Cruikshank et al., 2002) none has been reported for the SG inputs. What might be the information conveyed by these SG terminals? In the cat, visual responses dominate SG cells (Benedek et al., 1997; Paroczy et al., 2006) presumably due to their inputs from visual layers of the SC as well as a cortical feedback projection from visual areas along anterior ectosylvian sulcus (AES, Norita et al., 1991: Katoh and Benedek, 1995). The visual receptive fields of these SG cells are very large but contain regions of maximum sensitivity leading some to categorize them as “panoramic localizers” (Eördegh et al., 2005). A smaller population of SG cells also responds to somatosensory or auditory stimuli with some showing multimodal response features. Very little physiological data is available regarding the responses of rat SG cells. Bordi and LeDoux (1994a,b) recorded from cells in rat SG to auditory and somatosensory inputs noting that some responded only to auditory, some only to somatosensory and some cells to both modalities. SG somatosensory responses may be to noxious stimuli because spinothalamic cells projecting to rat SG preferentially responded to such stimuli (Zhang and Giesler, 2005). No physiological evidence is available to indicate that cells in rat SG respond to visual stimuli but Linke (1999) showed an SG input from superficial layers of the superior colliculus. Brain slice and electron microscopic experiments (Smith et al., 2007) documented that there are synaptic inputs to SG cells activated by SC stimulation. Thus it is possible although not documented that some portion of the SG cell input to rat auditory cortex will be carrying visual information that may not be specialized for precise localization. If rat SG cells respond like cat SG cells which seem to prefer motion stimuli in a preferred direction (Benedek et al., 1997; Paroczy et al., 2006) it may be alerting auditory cortex to the presence of an object that has appeared or has moved in the visual environment.
Corticocortical input to auditory cortex
Very little data is available on the synaptic characteristics of corticocortical connections in auditory cortex. Rat corticocortical callosal connections are feedback-like with terminals primarily in superficial and deep layers (Cippoloni and Peters, 1979) and a similar laminar distribution is seen in the inputs from ipsilateral secondary auditory cortex (Shi and Cassell, 1997). Corticocortical terminals found in layer IV of primary auditory cortex arising from an unspecified area of auditory cortex (Khazaria and Weinburger, 1994) synapsed primarily on spines and dendrites and were smaller than MGV thalamocortical terminals. Terminals in other layers were not evaluated. Local activation of corticocortical inputs to mouse layer IV cells (Anderson et al., 2009) indicated that these inputs were similar to thalamocortical inputs in that they synapsed on spines but the spines were not as consistently close to the cell body and the synapses were on a different spine type.
Still less information is available on the corticocortical connections arising from visual cortical areas and terminating in auditory cortex. Several retrograde labeling studies verified that extrastriate cells project to primary auditory cortex (monkey -Falchier et al., 2002, Cappe and Berone, 2005; ferret - Bizley et al., 2007; cat - Clemo et al., 2008; gerbil - Budinger et al., 2008,2009). Using anterograde autoradiographic techniques Miller and Voight (1984) provide the only evidence of the terminal distribution of this input to superficial and deep layers. However, their results differed qualitatively from ours as they reported V2M projects only to layers I–III (versus layers I and VI in the present study) and V2L projects to layers I–III and V (versus I–III and VI in the present study). In autoradiographic studies, it can be difficult to distinguish signal-from background label. This is not an issue with the robust axonal staining of the present study. Thus our data provide the first quantitative evidence of how the visual cortical input is integrated into the auditory cortical circuitry.
What information might be provided by this visual cortical input. A considerable amount of physiological data is available in cats and primates (e.g. see Sincich and Horton, 2005) but very little from rats. Cortical responses from rat extrastriate cortex (Espinoza and Thomas, 1983) provided evidence for several retinotopically organized areas of the contralateral hemifield and cells with notably larger receptive fields than those of V1 cells. Also, retrograde studies (Bizley et al. 2007; Budinger et al. 2006) have revealed that secondary visual cortical cells projecting to primary auditory cortex are restricted to regions that represent the peripheral visual field. Thus any visual input to auditory cortex from this source will likely not provide precise spatial information.
What cortical cell types might be influenced by this feedback projection? Our data indicate that the V2 terminals synapse primarily on the small dendrites and spines of excitatory cells. In primary visual cortex Johnson and Burkhalter (1996, 1997) noted a similar feedback connection from V2 to V1 where the V2 inputs were excitatory and terminated on pyramidal cell spines and dendrites. Because there are no excitatory cells in layer I, dendrites located here receiving V2 (and SG) inputs must arise from cells in other layers, in particular layer II/III pyramidal cells and the large pyramidal cells in layer V known to project corticofugally. In a slice preparation of rat visual cortex, Shao and Burkhalter (1996) stimulated rat extrastriate cortex while recording from layer II/III cells in primary visual cortex and noted that V2 stimulation generated primarily epsps and much less inhibition than stimulation of the white matter/local neuropil. In a similar slice preparation of primary somatosensory cortex (Cauller and Connors, 1994) layer I stimulation was shown to activate excitatory inputs only to pyramidal cells with apical dendrites extending into layer I. These included layer II/III cells and large layer V cells but not pyramidal cells in layer V and VI whose dendrites did not reach into layer I. In addition, spiny stellate cells, the major spiny neuron in layer IV of visual and somatosensory cortex whose dendrites are confined to layer IV and are the major recipient of lemniscal thalamocortical inputs, were not directly affected by layer I inputs. Several recent studies (Smith and Populin, 2001, Barbour and Callaway, 2008, Richardson et al., 2009) showed that primary auditory cortical layer IV is void of spiny stellates and is instead inhabited by pyramidal cells. In the rat (Barbour and Callaway, 2008) half of these cells are pyramidal cells whose apical dendrite extends into layer I. The other half are star pyramidals whose dendrites do not. Thus, unlike visual and somatosensory systems there may be a major cell component of layer IV of the auditory cortex that is being directly affected by these feedback inputs.
It was also interesting to note that there was an even distribution of V2M terminals in layer I, a preference of V2L terminals for the deep half of the layer and a preference of the SG inputs for the superficial half. Several other neural components have been shown, primarily in the rat cingulate cortex, to have a preferential distribution in either the superficial or deep half of layer I. These include GABAergic axons, the input from the anterior thalamic nucleus, muscimol binding, the GABA synthetic enzyme glutamic acid decarboxylase (GAD), somatostatin-28, 5 HT binding and certain muscarinic acetycholine receptors (Houser, et al., 1983; Mugnaini and Oertel, 1985; Campbell et al., 1989, Vogt, 1985, 1991). Why might there be this unequal distribution of so many important components? It has been shown that the apical dendritic tufts of layer II/III pyramidal cells are found primarily in the superficial half of layer 1 while those of layer V pyramidal cells extend evenly throughout the depth of layer I (Vogt, 1991). Perhaps these components, including V2L, V2M and SG terminals, are distributed so they can preferentially influence layer V pyramidal cell dendritic tufts only (V2L inputs) or both layer II/III and V cell dendritic tufts (V2M and SG inputs).
What might the function of feedback-type cortical projections to auditory cortex be? In other sensory systems cortical feedback within a given sensory modality from secondary to primary cortical areas are likely to modulate feedforward responses (e.g. Sandell and Schiller, 1982) and in some cases can drive columnar activity prior to or in the absence of ascending input (e.g. Cauller and Kulics, 1991; Mignard and Malpeli, 1991). For cortical feedback from the secondary visual cortex to the primary auditory cortex it is feasible that these connections contribute to the psychophysical observations that visual cues can alter the spatial localization of sounds (Howard and Templeton, 1966) and can effect the perception of speech sounds (McGurk and MacDonald, 1976), and auditory sensitivity (Lovelace et al., 2003).
Topography of Projections
We were surprised to see that V2M and probably SG axons run preferentially along the same axis as the isofrequency strips that form the frequency map described for rat primary cortex (Sally and Kelly, 1988, Doron et al., 2002). Why would this be the case? As indicated above the visual receptive fields of V2 cells are large but as a population they still form a map of contralateral space (Espinoza and Thomas, 1983). It would be tempting to speculate that the V2M to auditory cortex projection is conveying this location information about the visual component of an environmental cue onto the area of auditory cortex that is encoding that same location. Some reports have indicated that visual cues that are in spatial register with an auditory cue provide more help in evaluating a sensory stimulus. However, although the removal of auditory cortex produces localization deficits in contralateral space (Thompson and Cortez, 1983, Jenkins and Merzenich, 1984, Heffner and Heffner, 1990) there has been no reports of a map of space along any dimension of the auditory cortex including the isofrequency strips. It is also plausible that precise spatial information is not what V2 is providing to auditory cortex but, given the large receptive fields, simply the presence of a stimulus. Experiments to determine what visual stimuli preferentially activate V2M cells that project to auditory cortex and what the auditory response features of cells receiving this input are would be helpful.
As indicated above very little is known about the visual response of rat SG cells and it is not even clear if they carry visual information to auditory cortex. In the cat (Benedek et al., 1997, Paroczy et al., 2006) SG cells are predominantly responsive to visual stimuli and have very large receptive fields. As a group they did not form any apparent map of visual space and the majority of cells were concerned with movement of stimuli in a preferred direction. Thus, if rat SG cells are found to send similar visual information to auditory cortex it would not involve location information rather that something is moving in the visual environment. Why this would be sent preferentially along particular isofrequency strips is hard to imagine. As an alternative it should be kept in mind that rat SG cells can respond to auditory stimuli and have Q10 values (a measure of the narrowness of frequency tuning) that overlap with those of MGV cells (Bordi and LeDoux, 1994a,b) so the projection may simply reflect the auditory frequency tuning of the SG cell. More refined experiments need to be devised where SG (and extrastriate) cells specifically projecting to primary auditory cortex can be isolated and their specific response features to sensory stimuli from multiple modalities characterized.
Acknowledgments
We wish to thank Anna Kowalkowski for her help with tissue preparation.
Grant support: NIH NIDCD R01 grant #DC006212 to P.H. Smith and R01 #DC006013 to P.H. Smith and M.I. Banks.
LITERATURE SITED
- Adams JC. Heavy metal intensification of DAB-based HRP reaction product. J Histochem Cytochem. 1981;29:775. doi: 10.1177/29.6.7252134. [DOI] [PubMed] [Google Scholar]
- Anderson JC, Martin KAC. The synaptic connections between cortical areas V1 and V2 in Macaque monkey. J Neurosci. 2009;29:11283–11293. doi: 10.1523/JNEUROSCI.5757-08.2009. [DOI] [PMC free article] [PubMed] [Google Scholar]
- Barbour DL, Callaway EM. Excitatory local connections of superficial neurons in rat auditory cortex. J Neurosci. 2008;28:11174–11185. doi: 10.1523/JNEUROSCI.2093-08.2008. [DOI] [PMC free article] [PubMed] [Google Scholar]
- Barnes CL, Pandya DN. Efferent cortical connections of multimodal cortex of the superior temporal sulcus in the rhesus monkey. J Comp Neurol. 1992;318:222–244. doi: 10.1002/cne.903180207. [DOI] [PubMed] [Google Scholar]
- Barth DS, Goldberg N, Brett B, Di S. The spatiotemporal organization of auditory, visual, and auditory-visual evoked potentials in rat cortex. Brain Res. 1995;678:177–190. doi: 10.1016/0006-8993(95)00182-p. [DOI] [PubMed] [Google Scholar]
- Beaulieu C, Campistron G, Crevier C. Quantitative aspects of the GABA circuitry in the primary visual cortex of the adult rat. J Comp Neurol. 1994;339:559–572. doi: 10.1002/cne.903390407. [DOI] [PubMed] [Google Scholar]
- Benedek G, Perény J, Kovács G, Fischer-Szátmári L, Katoh YY. Visual, somatosensory, auditory and nocioceptive modality properties in the feline suprageniculate nucleus. Neuroscience. 1997;78:179–189. doi: 10.1016/s0306-4522(96)00562-3. [DOI] [PubMed] [Google Scholar]
- de Biasi S, Frassoni C, Spearfico R. GABA immunoreactivity in the thalamic reticular nucleus of the rat. A light and electron microscopic study. Brain Res. 1986;399:143–147. doi: 10.1016/0006-8993(86)90608-6. [DOI] [PubMed] [Google Scholar]
- Bizley JK, Nodal FR, Bajo VM, Nelken I, King AJ. Physiological and anatomical evidence of multisensory interactions in auditory cortex. Cereb Cortex. 2007;17:2172–2189. doi: 10.1093/cercor/bhl128. [DOI] [PMC free article] [PubMed] [Google Scholar]
- Bordi F, LeDoux JE. Response properties of single units in areas of rat auditory thalamus that project to the amygdala. I. Acoustic discharge patterns and frequency receptive fields. Exp Brian Res. 1994a;98:362–274. doi: 10.1007/BF00228414. [DOI] [PubMed] [Google Scholar]
- Bordi F, LeDoux JE. Response properties of single units in areas of rat auditory thalamus that project to the amygdala. II Cells reveiving convergent auditory and somatosensory inputs and cells antidromically activated by amygdala stimulation. Exp Brian Res. 1994b;98:275–286. doi: 10.1007/BF00228415. [DOI] [PubMed] [Google Scholar]
- Brosch M, Selezneva E, Scheich H. Nonauditory events of a behavioral procedure activate auditory cortex of highly trained monkeys. J Neurosci. 2005;25:6797–6806. doi: 10.1523/JNEUROSCI.1571-05.2005. [DOI] [PMC free article] [PubMed] [Google Scholar]
- Budinger E, Heil P, Hess A, Scheich H. Multisensory processing via early cortical stages: Connections of the primary auditory cortical field with other sensory systems. Neurosci. 2006;143:1065–1083. doi: 10.1016/j.neuroscience.2006.08.035. [DOI] [PubMed] [Google Scholar]
- Budinger E, Laszcz A, Lison H, Scheich H, Ohl FW. Non-sensory cortical and subcortical connections of the primary auditory cortex in Mongolian gerbils: Bottom-up and top-down processing of neuronal information via field AI. Brain Res. 2008;1220:2–32. doi: 10.1016/j.brainres.2007.07.084. [DOI] [PubMed] [Google Scholar]
- Budinger E, Scheich H. Anatomical connections suitable for the direct processing of neuronal information of different modalities via the rodent primary auditory cortex. Hear Res. 2009;258:16–27. doi: 10.1016/j.heares.2009.04.021. [DOI] [PubMed] [Google Scholar]
- Calvert LJ, Conners BW. Synaptic physiology of horizontal afferents to layer I in slices of rat SI neocortex. J Neurosci. 1994;14:751–762. doi: 10.1523/JNEUROSCI.14-02-00751.1994. [DOI] [PMC free article] [PubMed] [Google Scholar]
- Calvert GA, Thesen T. Multisensory integration: methodological approaches and emerging principles in the human brain. J Physiol. 2004;98:191–205. doi: 10.1016/j.jphysparis.2004.03.018. [DOI] [PubMed] [Google Scholar]
- Campbell MJ, Lewis DA, Benoit R, Morrison JH. Regional heterogeneity in the distribution of somatostatin-28 and somatostatin 281-12-immunoreactive profiles in monkey neocortex. J Neurosci. 1987;7:1133–1144. doi: 10.1523/JNEUROSCI.07-04-01133.1987. [DOI] [PMC free article] [PubMed] [Google Scholar]
- Cappe C, Barone P. Heteromodal connections supporting multisensory integration at low levels of cortical processing in the monkey. Eur J Neurosci. 2005;22:2886–2902. doi: 10.1111/j.1460-9568.2005.04462.x. [DOI] [PubMed] [Google Scholar]
- Cauller LJ, Connors BW. Synaptic physiology of horizontal afferents to layer 1 in slices of rat SI neocortex. J Neurosci. 1994;14:751–762. doi: 10.1523/JNEUROSCI.14-02-00751.1994. [DOI] [PMC free article] [PubMed] [Google Scholar]
- Cauller LJ, Kulics AT. The neural basis of the behaviorally relevant N1 component of the somatosensory-evoked potential in SI cortex of awake monkeys: evidence that backward cortical projections signal conscious touch sensation. Exp Brain Res. 1991;84:607–619. doi: 10.1007/BF00230973. [DOI] [PubMed] [Google Scholar]
- Cipolloni PB, Peters A. The bilaminar and banded distribution of the callosal terminals in the posterior neocortex of the rat. Brain Res. 1979;176:33–47. doi: 10.1016/0006-8993(79)90868-0. [DOI] [PubMed] [Google Scholar]
- Clemo HR, Sharma GK, Allman BL, Meredith MA. Auditory projections to extrastriate visual cortex: connectional basis for multisensory processing in 'unimodal' visual neurons. Exp Brain Res. 2008;191:37–47. doi: 10.1007/s00221-008-1493-7. [DOI] [PMC free article] [PubMed] [Google Scholar]
- Clerici WJ, Coleman JR. Anatomy of the rat medial geniculate body: I. Cytoarchitecture, myeloarchitecture, and neocortical connectivity. J Comp Neurol. 1990;297:14–31. doi: 10.1002/cne.902970103. [DOI] [PubMed] [Google Scholar]
- Clerici WJ, Coleman JR. Postnatal cytoarchitecture of the rat medial geniculate body. J Comp Neurol. 1998;399:110–124. doi: 10.1002/(sici)1096-9861(19980914)399:1<110::aid-cne9>3.0.co;2-4. [DOI] [PubMed] [Google Scholar]
- Coogan TA, Burkhalter A. Heirarchical organization of areas in rat visual cortex. J Neurosci. 1993;13:3749–3772. doi: 10.1523/JNEUROSCI.13-09-03749.1993. [DOI] [PMC free article] [PubMed] [Google Scholar]
- Coomes DL, Schofield BR. Projections from the auditory cortex to the superior olivary complex in guinea pigs. Eur J Neurosci. 2004;19:2188–2200. doi: 10.1111/j.0953-816X.2004.03317.x. [DOI] [PubMed] [Google Scholar]
- Cruikshank SJ, Rose HJ, Metherate R. Auditory thalamocortical synaptic transmission in vitro. J Neurophysiol. 2002;87:361–84. doi: 10.1152/jn.00549.2001. [DOI] [PubMed] [Google Scholar]
- Doron NN, Ledoux JE, Semple MN. Redefining the tonotopic core of rat auditory cortex: physiological evidence for a posterior field. J Comp Neurol. 2002;453:345–360. doi: 10.1002/cne.10412. [DOI] [PubMed] [Google Scholar]
- Doucet JR, Molavi DL, Ryugo DK. The source of corticocollicular and corticobulbar projections in area Te1 of the rat. Exp Brain Res. 2003;153:461–466. doi: 10.1007/s00221-003-1604-4. [DOI] [PubMed] [Google Scholar]
- Driver J, Spence C. Multisensory perception: beyond modularity and convergence. Curr Biol. 2000;10:731–735. doi: 10.1016/s0960-9822(00)00740-5. [DOI] [PubMed] [Google Scholar]
- Eördegh G, Nagy A, Berényi A, Benedek G. Processing of spatial visual information along the pathway between the suprageniculate nucleus and the anterior extosylvian cortex. Brain Res Bull. 2005;67:281–289. doi: 10.1016/j.brainresbull.2005.06.036. [DOI] [PubMed] [Google Scholar]
- Espinoza SG, Thomas HC. Retinotopic organization of striate and extrastriate visual cortex in the hooded rat. Brain Res. 1983;272:137–144. doi: 10.1016/0006-8993(83)90370-0. [DOI] [PubMed] [Google Scholar]
- Falchier A, Clavagnier S, Barone P, Kennedy H. Anatomical evidence of multimodal integration in primate striate cortex. J Neurosci. 2002;22:5749–5759. doi: 10.1523/JNEUROSCI.22-13-05749.2002. [DOI] [PMC free article] [PubMed] [Google Scholar]
- Feliciano M, Potashner SJ. Evidence for a glutamatergic pathway from the guinea pig auditory cortex to the inferior colliculus. J Neurochem. 1995;65:1348–1357. doi: 10.1046/j.1471-4159.1995.65031348.x. [DOI] [PubMed] [Google Scholar]
- Felleman DJ, Van Essen DC. Distributed hierarchical processing in the primate cerebral cortex. Cereb Cortex. 1991;1:1–47. doi: 10.1093/cercor/1.1.1-a. [DOI] [PubMed] [Google Scholar]
- Games KD, Winer JA. Layer V in rat auditory cortex: projections to the inferior colliculus and contralateral cortex. Hear Res. 1988;34:1–25. doi: 10.1016/0378-5955(88)90047-0. [DOI] [PubMed] [Google Scholar]
- Ghanzanfar AA, Schroeder CE. Is neocortex essentially multisensory? Trends Cogn Sci. 2006;10:278–285. doi: 10.1016/j.tics.2006.04.008. [DOI] [PubMed] [Google Scholar]
- Hackett TA, Stepniewska I, Kaas JH. Subdivisions of auditory cortex and ipsilateral cortical connections of the parabelt auditory cortex in macaque monkeys. J Comp Neurol. 1998;394:475–495. doi: 10.1002/(sici)1096-9861(19980518)394:4<475::aid-cne6>3.0.co;2-z. [DOI] [PubMed] [Google Scholar]
- Hairston WD, Burdette JH, Flowers DL, Wood FB, Wallace MT. Altered temporal profile of visual-auditory multisensory interactions in dyslexia. Exp Brain Res. 2005;66:474–480. doi: 10.1007/s00221-005-2387-6. [DOI] [PubMed] [Google Scholar]
- Harris MG, Manning KA, Uhlrich DJ, Smith PH. Visually evoked responses from the primary auditory cortex of awake freely moving rats. Soc Neurosci Abstr. 2007;614:17. [Google Scholar]
- Heffner HE, Heffner RS. Effects of bilateral auditory cortex lesions on sound localization in Japanese macaques. J Neurophysiol. 1990;64:915–931. doi: 10.1152/jn.1990.64.3.915. [DOI] [PubMed] [Google Scholar]
- Hicks TP, Watanabe S, Miyake A, Shoumura K. Organization and properties of visually responsive neurones in the suprageniculate nucleus of the cat. Exp Brain Res. 1984;55:359–367. doi: 10.1007/BF00237286. [DOI] [PubMed] [Google Scholar]
- Howard IP, Templeton WB. Human Spatial Orientation. New York: Wiley; 1966. [Google Scholar]
- Houser CR, Hendry SHC, Jones EG, Vaughn JE. Morphological diversity of immunocytochemically identified GABA neurons in the monkey sensory-motor cortex. J Neurocytol. 1983;12:617–638. doi: 10.1007/BF01181527. [DOI] [PubMed] [Google Scholar]
- Houser DR, Vaughn JE, Barber RP, Roberts E. GABA neurons are the major cell type of the nucleus reticular thalami. Brain Res. 1980;200:341–354. doi: 10.1016/0006-8993(80)90925-7. [DOI] [PubMed] [Google Scholar]
- Hyvärinen J. Posterior parietal lobe of the primate brain. Physiol Rev. 1982;62:1060–1129. doi: 10.1152/physrev.1982.62.3.1060. [DOI] [PubMed] [Google Scholar]
- Iarocci G, McDonald J. Sensory integration and the perceptual experience of persons with autism. J Autism Dev Disord. 2006;36:77–90. doi: 10.1007/s10803-005-0044-3. [DOI] [PubMed] [Google Scholar]
- Jenkins WM, Merzenich MM. Role of cat primary auditory cortex for sound localization behavior. J Neurophysiol. 1984;52:819–847. doi: 10.1152/jn.1984.52.5.819. [DOI] [PubMed] [Google Scholar]
- Johnson RR, Burkhalter A. Microcircuitry of forward and feedback connections within rat visual cortex. J Comp Neurol. 1996;368:383–398. doi: 10.1002/(SICI)1096-9861(19960506)368:3<383::AID-CNE5>3.0.CO;2-1. [DOI] [PubMed] [Google Scholar]
- Johnson RR, Burkhalter A. A polysynaptic feedback circuit in rat visual cortex. J Neurosci. 1997;17:7129–7140. doi: 10.1523/JNEUROSCI.17-18-07129.1997. [DOI] [PMC free article] [PubMed] [Google Scholar]
- Katoh YY, Benedek G. Organization of the colliculo-surpageniculate pathway In the cat: a wheat germ agglutin-horseradish peroxidase study. J Comp Neurol. 1995;352:381–397. doi: 10.1002/cne.903520306. [DOI] [PubMed] [Google Scholar]
- Kayser C, Logothetis NK. Do early sensory cortices integrate cross-modal information? Brain Struct Funct. 2007;212:121–132. doi: 10.1007/s00429-007-0154-0. [DOI] [PubMed] [Google Scholar]
- Kayser C, Petkov CI, Augath M, Logothetis NK. Functional imaging reveals visual modulation of specific fields in auditory cortex. J Neurosci. 2007;27:1824–1835. doi: 10.1523/JNEUROSCI.4737-06.2007. [DOI] [PMC free article] [PubMed] [Google Scholar]
- Kayser C, Petkov CI, Logothetis NK. Visual modulation of neurons in auditory cortex. Cereb Cortex. 2008;18:1560–1574. doi: 10.1093/cercor/bhm187. [DOI] [PubMed] [Google Scholar]
- Kharazia VN, Weinberg RJ. Glutamate in thalamic fibers terminating in layer IV of primary sensory cortex. J Neurosci. 1994;14:6021–6032. doi: 10.1523/JNEUROSCI.14-10-06021.1994. [DOI] [PMC free article] [PubMed] [Google Scholar]
- Kimura A, Donishi T, Sakado T, Hazama M, Tamai Y. Auditory thalamic nuclei projections to the temporal cortex in the rat. Neurosci. 2003;117:1003–1016. doi: 10.1016/s0306-4522(02)00949-1. [DOI] [PubMed] [Google Scholar]
- Lakatos P, Chen CM, O’Connell MN, Mills A, Schroeder CE. Neuronal oscillations and multisensory interactions in primary auditory cortex. Neuron. 2007;53:279–292. doi: 10.1016/j.neuron.2006.12.011. [DOI] [PMC free article] [PubMed] [Google Scholar]
- Lee CC, Sherman SM. Synaptic properties of thalamic and intracortical inputs to layer 4 of the first- and higher-order cortical areas in the auditory and somatosensory systems. J Neurophysiol. 2008;100:317–326. doi: 10.1152/jn.90391.2008. [DOI] [PMC free article] [PubMed] [Google Scholar]
- Linke R. Differential projection patterns of superior and inferior collicular neurons onto posterior paralaminar nuclei of the thalamus surrounding the medial geniculate body in the rat. Eur J Neurosci. 1999;11:187–203. doi: 10.1046/j.1460-9568.1999.00422.x. [DOI] [PubMed] [Google Scholar]
- Linke R, Schwegler H. Convergent and complimentary projections of the caudal paralaminar thalamic nuclei to the rat temporal and insular cortex. Cereb Cortex. 2000;10:753–771. doi: 10.1093/cercor/10.8.753. [DOI] [PubMed] [Google Scholar]
- Lovelace CT, Stein BE, Wallace M. An irrelevant light enhances auditory detection in humans: a psychophysical analysis of multisensory integration in stimulus detection. Brain Res Cogn Brain Res. 2003;17:447–453. doi: 10.1016/s0926-6410(03)00160-5. [DOI] [PubMed] [Google Scholar]
- Martuzzi R, Murray MM, Michel CM, Thiran JP, Maeder PP, Clarke S, Meuli RA. Multisensory interactions within human primary cortices revealed by BOLD dynamics. Cereb Cortex. 2007;17:1672–1679. doi: 10.1093/cercor/bhl077. [DOI] [PubMed] [Google Scholar]
- McGurk H, McDonald J. Hearing lips and seeing voices. Nature. 1976;264:746–748. doi: 10.1038/264746a0. [DOI] [PubMed] [Google Scholar]
- Meinecke DL, Peters A. GABA immunoreactive neurons in rat visual cortex. J Comp Neurol. 1987;261:388–404. doi: 10.1002/cne.902610305. [DOI] [PubMed] [Google Scholar]
- Mignard M, Malpeli JG. Paths of information flow through visual cortex. Science. 1991;251:1249–1251. doi: 10.1126/science.1848727. [DOI] [PubMed] [Google Scholar]
- Miller MW, Vogt BA. Direct connections of rat visual cortex with sensory, motor and association cortices. J Comp Neurol. 1984;226:184–202. doi: 10.1002/cne.902260204. [DOI] [PubMed] [Google Scholar]
- Molholm S, Ritter W, Murray MM, Javitt DC, Schroeder CE, Foxe JJ. Multisensory auditory-visual interactions during early sensory processing in humans: a high-density electrical mapping study. Brain Res Cogn Brain Res. 2002;14:115–128. doi: 10.1016/s0926-6410(02)00066-6. [DOI] [PubMed] [Google Scholar]
- Mugnaini E, Oertel WH. An atlas of the distribution of GABAergic neurons and terminals in the rat CNS as revealed by GAD immunohistochemistry. In: Bjorklund A, Hokfelt T, editors. Handbook of Chemical Neuroanatomy. Vol. 4. Elsevier; Amsterdam: 1985. pp. 436–608. [Google Scholar]
- Murray MM, Molholm S, Michel CM, Heslenfeld DJ, Ritter W, Javitt DC, Schroeder CE, Foxe JJ. Grabbing your ear: rapid auditory-somatosensory multisensory interactions in low-level sensory cortices are not constrained by stimulus alignment. Cereb Cortex. 2005;15:963–974. doi: 10.1093/cercor/bhh197. [DOI] [PubMed] [Google Scholar]
- Norita M, Hicks TP, Benedek G, Katoh Y. Organization of cortical and subcortical projections to the feline insular visual area, IVA. J Hirnforsch. 1991;32:119–134. [PubMed] [Google Scholar]
- Norita M, Katoh Y. Cortical and tectal afferent terminals in the suprageniculate nucleus of the cat. Neurosci Lett. 1986:65104–108. doi: 10.1016/0304-3940(86)90128-x. [DOI] [PubMed] [Google Scholar]
- Paroczy Z, Nagy A, Markus Z, Waleszczyk WJ, Wypych M, Benedek G. Spatial and temporal visual properties of single neurons in the suprageniculate nucleus of the thalamus. Neurosci. 2006;137:1397–1404. doi: 10.1016/j.neuroscience.2005.10.068. [DOI] [PubMed] [Google Scholar]
- Paxino G, Watson C. The Rat Brain in Stereotaxic Coordinates. 6. New York: Academic Press; 2007. [Google Scholar]
- Porter KK, Metzger RR, Groh JM. Visual- and saccade-related signals in the primate inferior colliculus. Proc Natl Acad Sci U S A. 2007;104:17855–17860. doi: 10.1073/pnas.0706249104. [DOI] [PMC free article] [PubMed] [Google Scholar]
- Richardson RJ, Blundon JA, Bayazitov IT, Zakharenko SS. Connectivity patterns revealed by mapping of active inputs on dendrites of thalamorecipient neurons in the auditory cortex. J Neurosci. 2009;29:6406–6417. doi: 10.1523/JNEUROSCI.0258-09.2009. [DOI] [PMC free article] [PubMed] [Google Scholar]
- Roger M, Arnault P. Anatomical study of the connections of the primary auditory area in the rat. J Comp Neurol. 1989;287:339–356. doi: 10.1002/cne.902870306. [DOI] [PubMed] [Google Scholar]
- Romanski LM, Bates JF, Goldman-Rakic PS. Auditory belt and parabelt projections to the prefrontal cortex in the rhesus monkey. J Comp Neurol. 1999;403:141–157. doi: 10.1002/(sici)1096-9861(19990111)403:2<141::aid-cne1>3.0.co;2-v. [DOI] [PubMed] [Google Scholar]
- Romanski LM, LeDoux JE. Organization of rodent auditory cortex: anterograde transport of PHA-L from MGV to temporal neocortex. Cereb Cortex. 1993;3:499–514. doi: 10.1093/cercor/3.6.499. [DOI] [PubMed] [Google Scholar]
- Rosa GP, Krubitzer LA. The evolution of visual cortex. Where is V2? TINS. 1999;22:242–248. doi: 10.1016/s0166-2236(99)01398-3. [DOI] [PubMed] [Google Scholar]
- Rose HJ, Metherate R. Auditory thalamocortical transmission is reliable and temporally precise. J Neurophysiol. 2005;94:2019–2030. doi: 10.1152/jn.00860.2004. [DOI] [PubMed] [Google Scholar]
- Ross LA, Saint-Amour D, Leavitt VM, Molholm S, Javitt DC, Foxe JJ. Impaired multisensory processing in schizophrenia: deficits in the visual enhancement of speech comprehension under noisy environmental conditions. Schizophr Res. 2007;97:173–183. doi: 10.1016/j.schres.2007.08.008. [DOI] [PubMed] [Google Scholar]
- Rumberger A, Tyler CJ, Lund JS. Intra-and inter-areal connections between the primary visual cortex V1 and the areas immediately surrounding V1 in the rat. Neurosci. 2001;102:35–52. doi: 10.1016/s0306-4522(00)00475-9. [DOI] [PubMed] [Google Scholar]
- Ryugo DK, Killackey HP. Differential telencephalic projections of the medial and ventral divisions of the medial geniculate body of the rat. Brain Res. 1974;82:173–177. doi: 10.1016/0006-8993(74)90903-2. [DOI] [PubMed] [Google Scholar]
- Sally SL, Kelly JB. Organization of auditory cortex in the albino rat: sound frequency. J Neurophysiol. 1988;59:1627–1638. doi: 10.1152/jn.1988.59.5.1627. [DOI] [PubMed] [Google Scholar]
- Sandell JH, Schiller PH. Effect of cooling area 18 on striate cortex cells in the squirrel monkey. J Neurophysiol. 1982;48:38–48. doi: 10.1152/jn.1982.48.1.38. [DOI] [PubMed] [Google Scholar]
- Schroeder CE, Foxe JJ. The timing and laminar profile of converging inputs to multisensory areas of the macaque neocortex. Brain Res Cogn Brain Res. 2002;14:187–198. doi: 10.1016/s0926-6410(02)00073-3. [DOI] [PubMed] [Google Scholar]
- Schroeder CE, Foxe J. Multisensory contributions to low level, ‘unisensory’ processing. Curr Opin Neurobiol. 2005;15:454–458. doi: 10.1016/j.conb.2005.06.008. [DOI] [PubMed] [Google Scholar]
- Shao Z, Burkhalter A. Different balance of excitation and inhibition in forward and feedback circuits of rat visual cortex. J Neurosci. 1996;16:7353–7365. doi: 10.1523/JNEUROSCI.16-22-07353.1996. [DOI] [PMC free article] [PubMed] [Google Scholar]
- Shi CJ, Cassell MD. Cortical, thalamic, and amygdaloid projections of rat temporal cortex. J Comp Neurol. 1997;382:153–175. [PubMed] [Google Scholar]
- Sincich LC, Horton JC. The circuitry of V1 and V2: integration of color, form, and motion. Annu Rev Neurosci. 2005;28:303–326. doi: 10.1146/annurev.neuro.28.061604.135731. [DOI] [PubMed] [Google Scholar]
- Smiley JF, Hackett TA, Ulbert I, Karmas G, Lakotas P, Javitt DC, Schroeder CE. Multisensory convergence in auditory cortex. I. Cortical connections of the caudal superior temporal plane in macaque monkeys. J Comp Neurol. 2007;502:894–923. doi: 10.1002/cne.21325. [DOI] [PubMed] [Google Scholar]
- Smith PH, Bartlett EL, Kowalkowski A. Cortical and collicular inputs to cells in the rat paralaminar thalamic nuclei adjacent to the medial geniculate body. J Neurophysiol. 2007;98:681–695. doi: 10.1152/jn.00235.2007. [DOI] [PubMed] [Google Scholar]
- Smith PH, Populin LC. Fundamental differences between the thalamocortical recipient layers of the cat auditory and visual cortices. J Comp Neurol. 2001;436:508–519. doi: 10.1002/cne.1084. [DOI] [PubMed] [Google Scholar]
- Stein BE. Neural mechanisms for synthesizing sensory information and producing adaptive behaviors. Exp Brain Res. 1998;123:124–135. doi: 10.1007/s002210050553. [DOI] [PubMed] [Google Scholar]
- Thompson GC, Cortez AM. The inability of squirrel monkeys to localize sound after unilateral ablation of auditory cortex. Behav Brain Res. 1983;8:211–216. doi: 10.1016/0166-4328(83)90055-4. [DOI] [PubMed] [Google Scholar]
- Vogt BA. Cingulate Cortex. In: Peters A, Jones EG, editors. Cerebral Cortex. Vol. 4. Plenum Press; New York: 1985. pp. 89–149. [Google Scholar]
- Vogt BA. The Role of Layer I in Cortical Function. In: Peters A, Jones EG, editors. Cerebral Cortex. Vol. 5. Plenum Press; New York: 1991. pp. 49–80. [Google Scholar]
- Wallace MT, Meredith MA, Stein BE. Integration of multiple sensory modalities in cat cortex. Exp Brain Res. 1992;91:484–488. doi: 10.1007/BF00227844. [DOI] [PubMed] [Google Scholar]
- Winer JA. Decoding the auditory corticofugal systems. Hear Res. 2006;212:1–8. doi: 10.1016/j.heares.2005.06.014. [DOI] [PubMed] [Google Scholar]
- Yu XJ, Xu XX, Shigang H, Jufang H. Change detection by thalamic reticular neurons. Nature Neurosci. 2009;12:1165–1171. doi: 10.1038/nn.2373. [DOI] [PubMed] [Google Scholar]
- Zhang X, Giesler GJ., Jr Response characterstics of spinothalamic tract neurons that project to the posterior thalamus in rats. J Neurophysiol. 2005;93:2552–2564. doi: 10.1152/jn.01237.2004. [DOI] [PubMed] [Google Scholar]
- Zilles K, Wree A. Cortex: Areal and laminar structure. In: Paxino G, editor. The Rat Nervous System. Vol. 1. Sydney: Academic Press; 1985. pp. 375–415. [Google Scholar]