Abstract
Introduction
Recirculation (R), the shunting of arterial blood back into to the venous lumen commonly occurs during veno-venous extracorporeal membrane oxygenation (VV-ECMO) and renders the monitoring of the venous line oxygen saturation no longer reflective of patient mixed venous oxygen saturation (SVO2). Previously, we failed to prove the hypothesis that once R is known it is possible to calculate the SVO2 of a patient on VV-ECMO. We hypothesize we can calculate SVO2 while using VV-ECMO if we account for and add an additional correction factor to our model for dissolved oxygen content. Therefore, the purpose of this study is to derive a more accurate model that will allow clinicians to determine SVO2 during VV-ECMO when ultrasound dilution is being used to quantify R.
Methods
Using an extracorporeal circuit primed with fresh porcine blood, two stocks of blood were produced; (1) arterial blood (AB), and (2) venous blood (VB). To mimic recirculation, the AB and VB were mixed together in precise ratios using syringes and a stopcock manifold. Six paired stock AB/VB sets were prepared. Two sets were mixed at 20% R increments and 4 sets were mixed at 10% R increments. The partial pressure of oxygen (PO2) and oxygen (O2) saturation of the stock blood and resultant mixed blood was determined. The original model was modified by modeling the residual errors with linear regression.
Results
When using the original model, as the partial pressure of arterial oxygen (PaO2) of the stock AB increased the calculated SVO2was higher than actual, especially at higher R levels. An iteration of the original model incorporating the PaO2 level (low, medium, high) and R was derived to fit the data.
Conclusions
The original model using R and circuit saturations for the calculation of SVO2 in VV ECMO patients is an oversimplification that fails to consider the influence of the high PO2 of arterial blood during therapy. In the future, further improvements in this model will allow clinicians to accurately calculate SVO2 in conjunction with recirculation measurements.
Keywords: Recirculation, Dilutional Ultrasound, VV ECMO, Shunt Fraction, SvO2, Partial Pressure of Oxygen
Introduction
Veno-Venous Extracorporeal Membrane Oxygenation (VV ECMO) is used for patients with respiratory failure, but without cardiac failure. Veno-Arterial (VA) ECMO is used for patients with respiratory failure that may be associated with cardiac failure, or if it is thought that the patient will require cardiac support. Since the implementation of the Dual Lumen VV (DLVV) Cannula in 1988 the use of VV ECMO in the neonatal population has increased and encompasses about 32% of most non-cardiac neonatal cases(1,2).
Roberts et. al. expanded VV ECMO use to include patients whose cardiovascular system is mild to moderately dependent on inotropes for support (3). These patients would have previously been placed on VA ECMO. Recently it has also been suggested that patients suffering from lung allograft failure may have better outcomes and fewer associated complications when using VV ECMO as compared to traditional VA ECMO (3–6). VV ECMO alleviates certain risks that are associated with VA ECMO such as; systemic embolization, ligation of the carotid artery, and cardiac stun syndrome (7–9).
One of the main technical problems that exist with VV ECMO is recirculation. Recirculation in VV ECMO can be defined as the fraction of oxygenated blood that is infused into the right atrium and is then aspirated back into the venous line of the ECMO circuit (10,11). It has been suggested that recirculation ranges from 20% to 50% when using the DLVV cannula (11,12). If the recirculated fraction is excessive, it can cause a decrease in the delivery of oxygen to the patient. In turn, this can cause an increase in pulmonary vascular resistance, an increase in myocardial demand, a decrease in myocardial oxygen supply, and a decrease in oxygen delivery to the body tissues; thus initiating a vicious cycle (13).
A good indicator of the global perfusion status is the mixed venous oxygen saturation (SVO2) of the blood returning to the right atrium which is in turn measured in the pulmonary artery by use of a catheter that allows either direct oximetry or blood sample aspiration for blood gas analysis. In cardiopulmonary bypass (CPB) and VA ECMO the saturation of the venous line (SVLO2) is a true representation of SVO2 and is used to direct the clinical care of patients (14). With recirculation present in VV ECMO the value expressed as the SVLO2 will always be an inaccurate measurement of SVO2 (10,11). Currently, there is no way for clinicians to know, with any level of certainty, the SVO2 of patients receiving VV ECMO unless they turn off the sweep gas and allow the ECMO circuit to recirculate the native venous return. While this technique is useful when weaning a patient from VV ECMO, some patients receiving this therapy are not stable enough to simply discontinue the sweep gas flow for evaluating SVO2. You can estimate the SVO2 by sampling other major veins such as the inferior vena cava or internal jugular vein (10), but these samples are regional values and do not accurately reflect global saturations. A change in venous line saturation can lead to certain assumptions, which if not correct, could lead to risky decisions; possibly having deleterious effects to an unstable patient. Currently, real time venous line saturation on VV ECMO provides trends in; recirculation, disease progression/improvement, and cannula position.
Current ECMO literature has provided a mathematical model (figure 1) as a way to calculate recirculation. However, this model requires the use of a true venous saturation which does not exist in the VV ECMO patient population (10). Thus, it is more of a mathematical concept rather than an actual calculation of recirculation. The recirculation model was reconstructed by us in a previous study to solve for SVO2 (see figure 2) (11). However, this model requires the definition of recirculation. Recently, a method using dilutional ultrasound has been found to be accurate and beneficial for rapid bedside monitoring of recirculation in several swine models (15,16). In fact, the use of dilutional ultrasound has been used recently to quantify recirculation on a 5.8 kg neonate diagnosed with congenital diaphragmatic hernia (17). With the development of dilutional ultrasound we not only have a way to isolate recirculation, but also the possibility to solve for SVO2 according to our model.
Figure 1.
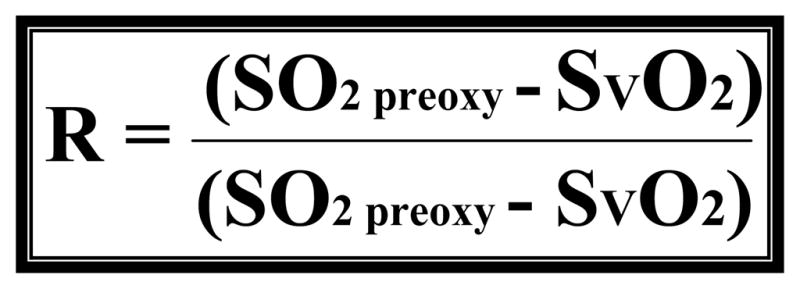
This is a published formula that is thought to be a way to calculate R. Where R is recirculation (%), SO2preox is the O2 saturation of the blood entering the oxygenator, SO2postox is the O2 saturation of the blood exiting the oxygenator and SVO2 is the mixed venous O2 saturation in the patient.
* (See reference 10 for source)
Figure 2.
Model 1 is a published formula. Where R is recirculation (%), SO2preox is the O2 saturation of the blood entering the oxygenator, SO2postox is the O2 saturation of the blood exiting the oxygenator and SVO2 is the mixed venous O2 saturation in the patient.
* (See reference 11 for source)
We had previously hypothesized that once recirculation was defined we could accurately calculate SVO2 using the derived original model. However, we found that the derived model did not adequately account for several factors affecting saturation and therefore was not accurate in calculating SVO2 during VV ECMO (11). The factors that we believe need to be evaluated for their possible influences are pH, temperature, hemoglobin, and dissolved oxygen content. Therefore, the purpose of this bench top validation study is to evaluate our model further and improve upon it if possible.
Methods
Blood
1000 ml of fresh pig blood collected in Anticoagulant Citrate Dextrose (ACD) was used for this experiment. We used a small system consisting of 1/4” tubing, a hardshell reservoir, a Lilliput 1 oxygenator, and an HC 1400 hemoconcentrator. The gas supplied to the oxygenator was a mixture of carbogen, nitrogen, carbon dioxide, and oxygen. This system allowed manipulation of blood partial pressures and saturations while maintaining a normal carbon dioxide pressure and an adequate acid-base balance. The system was used to create six simulated “patients.” Each patient consisted of a venous and arterial blood source and had similar values of SVO2 (64.7% ± 1.38%) and partial pressure of venous oxygen tension(36.3 mmHg ± 2.0 mmHg), but had varying values for partial pressure of oxygen (PaO2), arterial blood saturation (SaO2), and hemoglobin (Table 1). We had two groups with differing hemoglobin levels but were unable to come to any conclusion due to the low number of patients in these two groups. We collected one 60 cc syringe of venous blood and one 60 cc syringe of arterial blood for each patient.
Table 1.
Collected data and mixing ratios per patient
| Subject | Ratio Mixed % | SVO2 % | PVO2 mmHg | SaO2 % | PaO2 mmHg | Hb g/dl |
|---|---|---|---|---|---|---|
| 1 | 20, 40, 60, 80, 90 | 65.1 ± 1.1 | 38 | 97 | 101 | 9.37 ± 0.24 |
| 2 | 10–90 | 66.7 ± 0.64 | 35 | 97.7 ± 0.7 | 90 | 14.83 ± 0.21 |
| 3 | 20, 40, 60, 80, 90 | 63.3 ± 0.28 | 37 | 98.8 ± 0.14 | 239.5 ± 0.7 | 9.44 ± 0.16 |
| 4 | 10–90 | 64.1 ± 0.42 | 34 | 98.7 ± 0.57 | 142 | 14.8 ± 0.18 |
| 5 | 10–90 | 65.7 | 38.7 ± 0.58 | 99.5 ± 0.15 | 527.8 ± 62.3 | 9.53 ± 0.18 |
| 6 | 10–90 | 63.2 ± 0.35 | 34 | 98.9 ± 0.12 | 328.33 ± 67.9 | 14.7 ± 0.62 |
Recirculation Apparatus
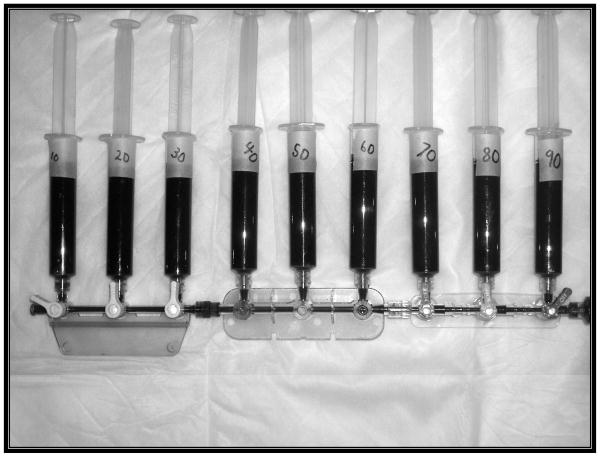
We used a nine bay stopcock strip (figure 3) to facilitate the precise mixing of the blood samples. We attached a 10 cc waste syringe to the distal port, and nine 10 cc measurement syringes to the nine side ports. The 60 cc syringe containing the venous blood was placed on the proximal end of the apparatus and was then advanced into each of the nine syringes in amounts ranging from 1 cc to 9 cc. The venous syringe was then removed and the 60 cc arterial blood syringe was attached. The main lumen of the system was flushed with the arterial blood into the waste syringe connected to the distal port. Each of the nine syringes was then filled to a total of 10 cc. Each of these syringes contained samples with fractions ranging from 10–90%, or in our case percentage of recirculation. The first two of the six patients had recirculation measurements of 20%, 40%, 60%, 80%, and 90%. Upon further evaluation we decided to decrease the recirculation increments to 10% to increase the number of data points per patient for evaluation. These methods were then followed for each of the subsequent patients.
Figure 3.
This is a picture of the mixture apparatus. This allowed precise mixing of the arterial and venous sources.
Measurement Analysis
Standard blood gas analysis and cooximetry for oxygen saturation and hemoglobin concentration was then performed on the arterial, venous, and resultant blood samples. The blood gas analyzer used was the Radiometer ABL 5 (Copenhagen, Denmark) and co-oximetry was done via a Radiometer OSM 3 (Copenhagen, Denmark). Standard blood gas values were recorded for this analysis.
Mathematical Analysis and Improvement
The data that was collected was then presented to the Department of Biostatistics and Epidemiology for evaluation. The software used for all analysis was SAS Version 9.1.3 and R Version 2.5.1. For the first step we used linear regression models, inspection of residuals, and linear regression modeling of residuals to evaluate the accuracy of Model 1(figure 2). We then used the same steps to modify the original model to fit the known values from the samples.
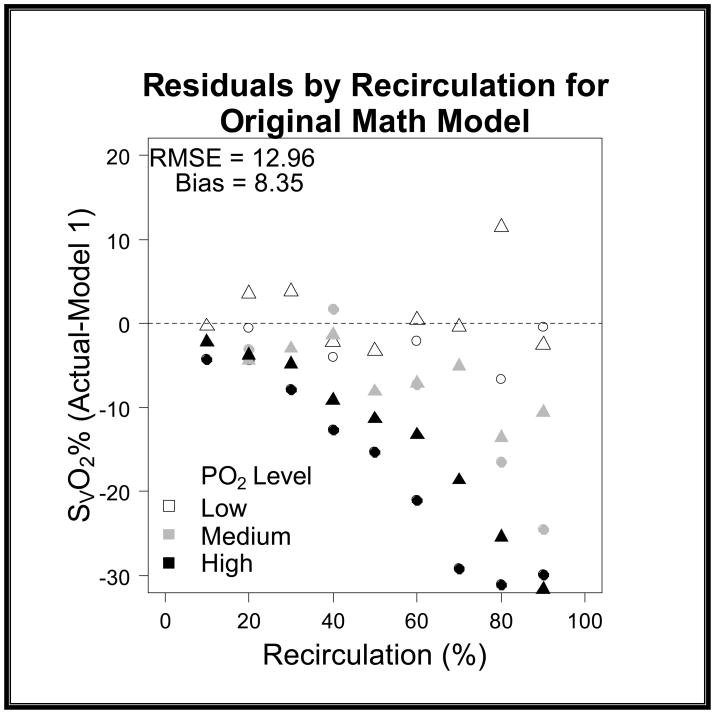
When comparing the differences between models we quantified the variance by using root mean squared error (RMSE) and bias to characterize the precision and accuracy of estimation. We found that the original model had a RMSE of 12.96 and a bias of 8.37 (graph 1). We obtained Model 2 by correcting the residual error of Model 1 with a linear term [−(0.168*R)] for recirculation. For the second model we found that we had a RMSE of 8.63 and a bias of −1.47 (graph 2). Upon further discussion and evaluation, it was evident that an additional factor was required to account for the interaction of R and PaO2. Model 3 (figure 5) was the final model created. In this final model, there is a correction for PaO2 in relation to R [−(0.163*R*PaO2)] as well as a correction for recirculation [−(0.005*R)]. The PaO2 is not the exact number obtained from the blood gas analysis; but rather refers to ranges of PaO2. In the following table you will see the levels of PaO2 that are present in our data set, and the associated number that is assigned and then input as the PaO2 value (see table 2). The final step involved reapplying the data set to the new model and comparing these values with the values produced by the original model.
Graph 1. Model 1 SvO2 Residuals versus Recirculation.
The residuals on this graph show the lack of precision that is present when the data is applied to the original math model (Model 1). The RMSE is 12.96 and the bias is 8.35 showing that the previous model overestimated the predicted values.
Graph 2. Model 2 SvO2 Residuals versus Recirculation.
The residuals on this graph show the improvement in precision when Model 2 is compared to Model 1. The RMSE is 8.63 and the bias is -1.47 showing that this model is an improvement over the previous model and has some degree of under estimation.
Figure 5.
Model 3 is the final modification of Model 1. Where R is recirculation (%), SO2preox is the O2 saturation of the blood entering the oxygenator, SO2postox is the O2 saturation of the blood exiting the oxygenator and SVO2 is the mixed venous O2 saturation in the patient. Notice the modification to correct for the error introduced by recirculation (0.005*R) as well as the addition of a variable to account for the relationship of R and PaO2 (0.163*R*PaO2).
Table 2.
Values assigned as PaO2 variable in Model 3
| Value | PaO2 mmHg |
|---|---|
| 0 | 95.5 ± 6.4 |
| 1 | 190.8 ± 56.3 |
| 2 | 482 ± 93.3 |
Results
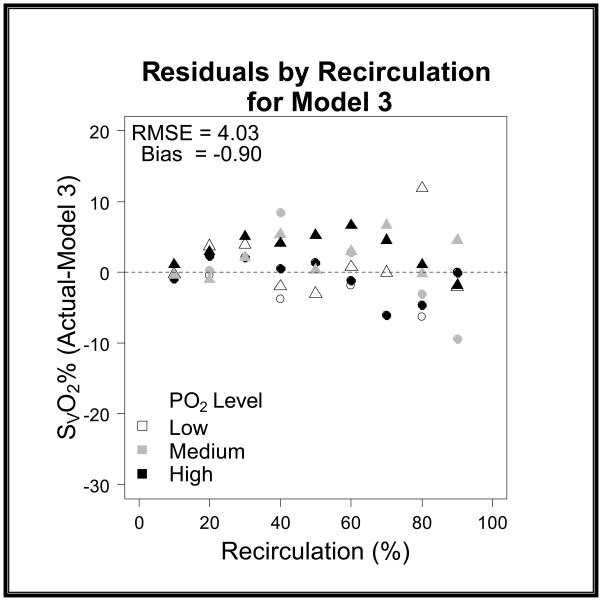
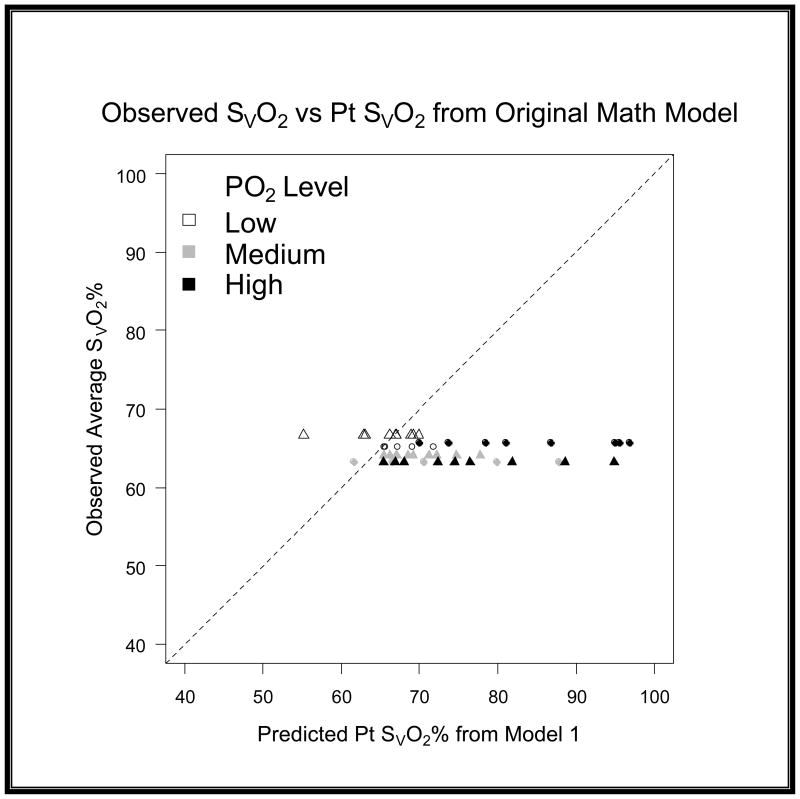
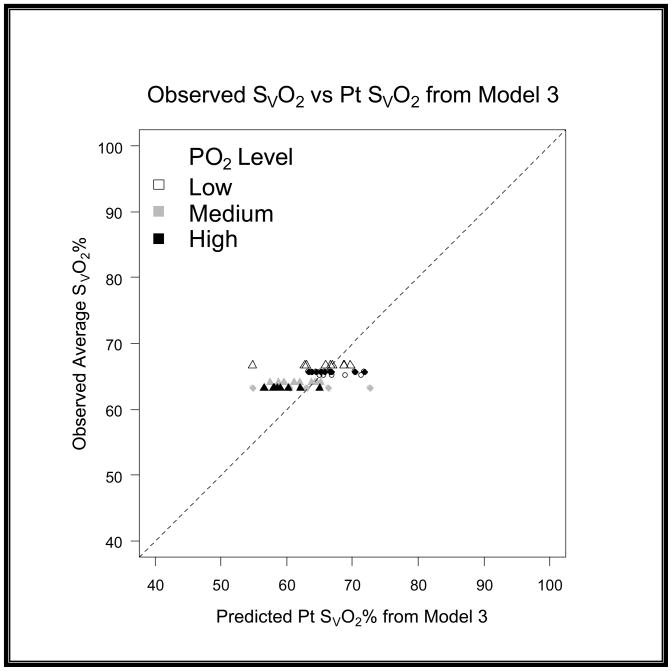
After subsequent evaluation and the addition of the correction terms to the model the RMSE further improved from 8.63 to 4.03 and the bias from −1.47 to −0.9 (graph 3). When evaluating the models in a scatter plot on a 45 degree line we can see the improvement from Model 2 to Model 3 (graph 4–6).
Graph 3. Model 3 SvO2 Residuals versus Recirculation.
The residuals on this graph show the dramatic improvement of Model 3 when compared to Model 1. The RMSE is 4.03 and the bias is -0.90 showing that the final model has an improved accuracy and precision when compared to the original model.
Graph 4. Evaluation of residuals on a 45 degree scatter plot for Model 1.
This scatter plot shows that Model 1 had a larger variance in the predicted SvO2 and the gross degree of overestimation.
Graph 6. Evaluation of residuals on a 45 degree scatter plot for Model 3.
This scatter plot shows that the variance and accuracy of Model 3 is dramatically improved when compared to Model 1.
Discussion
It is unknown to us if previous work not done by us on the behavior of blood gas values after mixing venous blood and arterial blood with varying oxygen pressures and the relationship of varying hemoglobin contents. The dissolved oxygen content (0.003*PO2) can be seen as a negligible amount, and under normal physiologic conditions accounts for less than 2% of the oxygen carried in the blood. In blood with a PO2 of 100 mmHg the dissolved oxygen content consists of 0.3 ml/dl but when the PO2 is 500 mmHg the dissolved oxygen content is 1.5 ml/dl, which can account for about 9% of the total blood oxygen content. There is a significant difference between these two contents, which we have found to be as significant a factor as the recirculation fraction in being able to accurately calculate SVO2 in VV ECMO. It is this idea, that the dissolved oxygen content plays such an insignificant role and therefore does not require close evaluation that causes problems. Under normal physiologic conditions where mixing of venous and arterial blood does not occur then it is true that the dissolved oxygen content plays an insignificant role. However, we have shown in this in vitro model that the dissolved oxygen content plays a significant role when attempting to estimate the resultant saturation of a sample comprised of two samples with vastly different oxygen saturations.
The original recirculation model (figure 1) is quite simple and works with a PaO2 <100 mmHg; however it is oversimplified when the PaO2 of the arterial line is elevated. In our experiment we found that a PaO2 of 482 mmHg greatly affects the SVO2 calculated with the original model and that the result is quite inaccurate. We would infer the same conclusion for any PaO2 value which is located on the plateau of the oxyhemoglobin dissociation curve.
This bench top study has resulted in a model that in the future could improve the outcome of patients being treated with VV ECMO. As this concept is expounded upon and technology adapts, we can see the value of SVO2 being obtained frequently for patients receiving VV ECMO. Clinical decisions could be rightly made based on a sound, scientifically measured patient parameter. It would then be used in conjunction with current indicators to determine the efficacy of VV ECMO. Some of these indicators are systemic lactate levels, near infrared spectroscopy tissue oxygenation monitoring, and patient arterial/venous blood gas values. Fortunately, when a patient is on CPB or VA ECMO we do have a continuous in-line venous saturation monitor. If this monitor shows a decrease in venous saturation the clinician has information that could change their practice to benefit the patient. It seems that with VV ECMO the providers have conceded to the fact that the value of SVO2 holds very little clinical relevance. It is viewed as more of a trending device that should be closely scrutinized before any decisions can be made.
Being able to accurately measure SVO2 in VV ECMO patients could help identify when a patient requires conversion to VA ECMO, or perhaps it could be as simple as optimizing the patient position to minimize recirculation, giving inotrope support, or any other number of treatments to benefit the patient. At this time any decisions made for these patients based on SVO2 is strictly based on conjecture.
The limitations of this study are; a complex mathematical model and theory, a lack of variability in the SVO2 and a small number of “patients.” Future studies should include a larger number of patients and a larger range of SVO2 and hemoglobin. The equation published in this literature is still under development and has not yet been tested or validated in an animal or human model.
Figure 4.
Model 2 is the first attempt to modify Model 1. Where R is recirculation (%), SO2preox is the O2 saturation of the blood entering the oxygenator, SO2postox is the O2 saturation of the blood exiting the oxygenator and SVO2 is the mixed venous O2 saturation in the patient. Notice the modification to correct for the error introduced by recirculation (0.168*R).
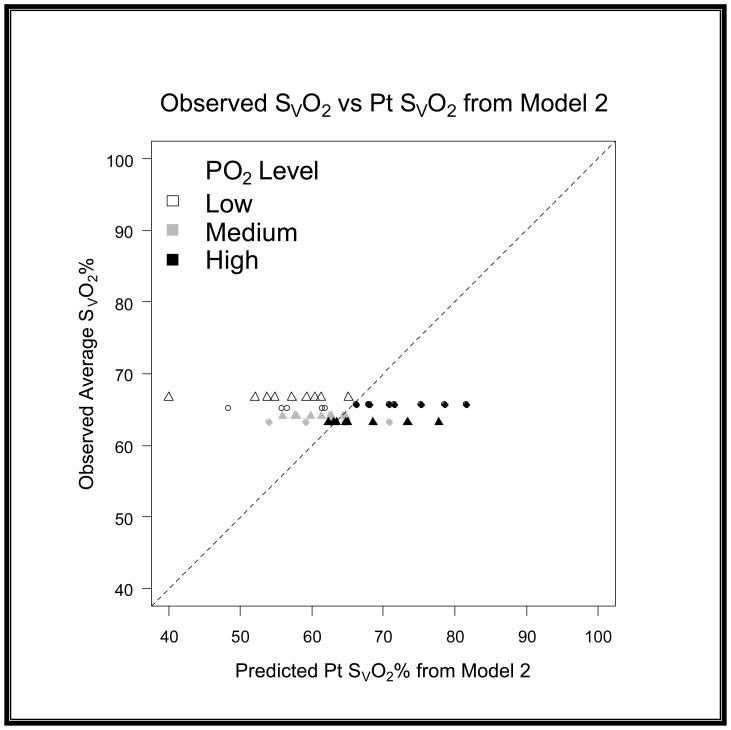
Graph 5. Evaluation of residuals on a 45 degree scatter plot for Model 2.
This scatter plot shows that the variance and accuracy of Model 2 was an improvement when compared to Model 1.
Acknowledgments
The authors would like to thank Johanna Primmer of Transonic Systems Inc. for her editing and statistical input for this publication. This study was funded in part by a NIH SBIR Grant # 2 R44 HL082022-02 from Transonic Systems Inc.
References
- 1.ELSO. ECMO registry report of the Extracorporeal Life Support Organization (ELSO) Ann Arbor, MI: 2008. [Google Scholar]
- 2.Bartlett RH, Roloff DW, Custer JR, et al. Extracorporeal life support, The University of Michigan Experience. JAMA. 2000;283:904–908. [PubMed] [Google Scholar]
- 3.Roberts N, Westrope C, Pooboni SK, et al. Venovenous extracorporeal membrane oxygenation for respiratory failure in inotrope dependent neonates. ASAIO J. 2003;49(5):568–571. doi: 10.1097/01.mat.0000084102.22059.91. [DOI] [PubMed] [Google Scholar]
- 4.Hartwig MG, Appel JZ, 3rd, Cantu E, 3rd, et al. Improved results treating lung allograft failure with venovenous extracorporeal membrane oxygenation. Ann Thorac Surg. 2005;80(5):1872–1879. doi: 10.1016/j.athoracsur.2005.04.063. discussion 1879–1880. [DOI] [PubMed] [Google Scholar]
- 5.Delius R, Anderson HL, Schumacher E, et al. Venovenous compares favorably with venoarterial access for extracorporeal membrane oxygenation in neonatal respiratory failure. J Thorac Cardiovasc Surg. 1993;106:329–338. [PubMed] [Google Scholar]
- 6.Cornish DJ, Heiss KF, Clark RH, et al. Efficacy of venovenous extracorporeal membrane oxygenation for neonates with respiratory and circulatory compromise. J Pediatr. 1993;122:105–109. doi: 10.1016/s0022-3476(05)83501-2. [DOI] [PubMed] [Google Scholar]
- 7.Dalton HJ. Venovenous extracorporeal membrane oxygenation: an underutilized technique? Pediatr Crit Care Med. 2003;4(3):385–386. doi: 10.1097/01.PCC.0000075321.45152.B8. [DOI] [PubMed] [Google Scholar]
- 8.Dimmitt RA, Moss RL, Rhine WD, Benitz WE, Henry MC, Vanmeurs KP. Venoarterial versus venovenous extracorporeal membrane oxygenation in congenital diaphragmatic hernia: the Extracorporeal Life Support Organization Registry, 1990–1999. J Pediatr Surg. 2001 Aug;36(8):1199–1204. doi: 10.1053/jpsu.2001.25762. [DOI] [PubMed] [Google Scholar]
- 9.Hirschl RB, Heiss KF, Bartlett RH. Severe myocardial dysfunction during extracorporeal membrane oxygenation. J Pediatr Surg. 1992 Jan;27(1):48–53. doi: 10.1016/0022-3468(92)90103-e. [DOI] [PubMed] [Google Scholar]
- 10.Fortenberry JD, Pettignano R, Dykes F. Principles and Practice of Venovenous ECMO. In: Van Meurs K, Lally DP, Peek G, Zwischenberger JB, editors. ECMO Extracorporeal Cardiopulmonary Support in Critical Care. 3. Ann Arbor, MI: Extracorporeal Life Support Organization; 2005. p. 94. [Google Scholar]
- 11.Walker J, Primmer J, Searles BE, Darling EM. The potential of accurate SvO2 monitoring during venovenous extracorporeal membrane oxygenation: an in vitro model using ultrasound dilution. Perfusion. 2007 Jul;22(4):239–244. doi: 10.1177/0267659107083656. [DOI] [PubMed] [Google Scholar]
- 12.Keszler M, Kolobow T. Venovenous ECMO. In: Arensman RM, Cornish JD, editors. Extracorporeal Life Support. Cambridge, MA: Blackwell Scientific Publications; 1993. p. 269. [Google Scholar]
- 13.Rais-Bahrami K, Walton DM, Sell JE, Rivera O, Mikesell GT, Short BL. Improved oxygenation with reduced recirculation during venovenous ECMO: comparison of two catheters. Perfusion. 2002 Nov;17(6):415–419. doi: 10.1191/0267659102pf608oa. [DOI] [PubMed] [Google Scholar]
- 14.Mejak BL, Stammers A, Rauch E, Vang S, Viessman T. A retrospective study on perfusion incidents and safety devices. Perfusion. 2000;15:51–61. doi: 10.1177/026765910001500108. [DOI] [PubMed] [Google Scholar]
- 15.van Heijst AF, van der Staak FH, de Haan AF, et al. Recirculation in DL catheter VV ECMO measured by an ultrasound dilution technique. ASAIO J. 2001;47(4):372–376. doi: 10.1097/00002480-200107000-00015. [DOI] [PubMed] [Google Scholar]
- 16.Darling EM, Crowell T, Searles BE. Use of Dilutional Ultrasound Monitoring to Detect Changes in Recirculation During Venovenous Extracorporeal Membrane Oxygenation in Swine. ASAIO J. 2006;52(5):522–524. doi: 10.1097/01.mat.0000237589.20935.a4. [DOI] [PubMed] [Google Scholar]
- 17.Clements D, Primmer J, Ryman P, Marr B, Searles B, Darling E. Measurements of recirculation during neonatal veno-venous extracorporeal membrane oxygenation: clinical application of the ultrasound dilution technique. J Extra Corporeal Technol. 2008 Sep;40(3):184–187. [PMC free article] [PubMed] [Google Scholar]


