

Abstract
We investigated the axonal transport of neurofilaments in cultured neurons from two different strains of dilute lethal mice, which lack myosin Va. To analyze the motile behavior, we tracked the movement of green fluorescent protein (GFP)-tagged neurofilaments through naturally occurring gaps in the axonal neurofilament array of cultured superior cervical ganglion neurons from DLS/LeJ dilute lethal mice. Compared with wild-type controls, we observed no statistically significant difference in velocity or frequency of movement. To analyze the pausing behavior, we used a fluorescence photoactivation pulse–escape technique to measure the rate of departure of PAGFP (photoactivatable GFP)-tagged neurofilaments from photoactivated axonal segments in cultured dorsal root ganglion neurons from DLS/LeJ and dl20J dilute lethal mice. Compared with wild-type controls, we observed a 48% increase in the mean time for neurofilaments to depart the activated regions in neurons from DLS/LeJ mice (p < 0.001) and a 169% increase in neurons from dl20J mice (p < 0.0001). These data indicate that neurofilaments pause for more prolonged periods in the absence of myosin Va. We hypothesize that myosin Va is a short-range motor for neurofilaments and that it can function to enhance the efficiency of neurofilament transport in axons by delivering neurofilaments to their microtubule tracks, thereby reducing the duration of prolonged off-track pauses.
Introduction
Cytoskeletal polymers, membranous organelles, and other macromolecular complexes are transported along axons at a broad range of rates, dictated principally by the proportion of the time that they spend moving (Brown, 2003b). Neurofilaments are among the slowest of these cargoes, typically moving at average rates of 0.1–3 mm/d (Nixon and Logvinenko, 1986; Lasek et al., 1992), but live-cell imaging studies of neurofilament transport in cultured neurons and computational modeling studies of neurofilament transport in vivo have demonstrated that this slow rate of movement is attributable to bouts of rapid intermittent movement interrupted by prolonged pauses (Roy et al., 2000; Wang et al., 2000; Wang and Brown, 2001; Uchida and Brown, 2004; Brown et al., 2005; Craciun et al., 2005; Yan and Brown, 2005; Trivedi et al., 2007).
Most of the available evidence suggests that microtubules are the tracks along which axonal neurofilaments move, propelled by the action of dynein and kinesin-1 motors (Yabe et al., 1999; Shah et al., 2000; Helfand et al., 2003; Xia et al., 2003; Wagner et al., 2004; Francis et al., 2005; He et al., 2005). However, it is also possible that neurofilaments may be cargo for myosin motors, which move along microfilaments. In one study, Shea and colleagues reported that neurofilament transport is impaired by inhibitors of nonmuscle myosin II in cultured NB2a/d1 cells (Jung et al., 2004). In another study, Nixon and colleagues reported that myosin Va colocalizes with neurofilaments in axons of the optic nerve and that myosin Va interacts with neurofilament protein L in vitro (Rao et al., 2002a). In addition, these authors observed an approximately twofold increase in neurofilament number in sciatic nerve axons of dilute lethal mice, which lack myosin Va.
In theory, there are three possible explanations for the increase in axonal neurofilament content observed in dilute lethal mice: (1) an increase in the rate of neurofilament export from the cell body; (2) a decrease in the rate of neurofilament movement in the axon; and (3) a decrease in the rate of neurofilament degradation in the axon. Since myosin Va is a motor protein, it is more likely to be involved in moving or tethering neurofilaments than in their degradation. Moreover, recent experimental evidence has confirmed that axonal neurofilaments are remarkably long-lived in vivo, persisting for many months without any noticeable loss (Millecamps et al., 2007). Thus, it is possible that myosin Va has a role in the axonal transport of neurofilaments. To test this hypothesis, we investigated the axonal transport of neurofilaments directly in cultured neurons from superior cervical and dorsal root ganglia of dilute lethal and wild-type mice. Our data indicate that neurofilaments spend significantly more time pausing in the absence of myosin Va. We speculate that myosin Va is a short-range motor for neurofilaments and that it can function to enhance the efficiency of neurofilament transport by delivering neurofilaments to their microtubule tracks, thereby reducing the duration of prolonged off-track pauses.
Materials and Methods
Mice.
DLS/LeJmice (JAX GEMM stock no. 000253) were purchased from The Jackson Laboratory, and dl20J mice were obtained from N. Jenkins (Institute of Molecular and Cell Biology, Singapore) (Strobel et al., 1990). The dilute lethal myosin Va mutations in these two inbred strains are recessive alleles and are maintained in repulsion with closely linked recessive mutations in the short ear gene, which codes for bone morphogenic protein 5. Mice homozygous for the DLS/LeJ dilute lethal mutation were obtained by interbreeding heterozygous DLS/LeJ mice. Homozygous DLS/LeJ pups were identified based on their pale coat color, which was apparent at 4 d of age. Wild-type pups were identified based on their black coat color and short ears, which were apparent at ∼10 d of age. Heterozygous DLS/LeJ pups were identified by their normal ear length and black coat color. dl20J mice were crossed with wild-type C57BL/6J mice (purchased from The Jackson Laboratory) to eliminate the short ear allele, and then a colony was established and maintained by interbreeding the heterozygous dl20J progeny. The pups from these litters were genotyped with four PCR primers (dl20J-1: 5′-CAC CAT CAT CTC ATT TCC ATC CTG TGT CC-3′; dl20J-2: 5′-CTC AGG AGG ATA ATA AAT GCA CGA GAC GC-3′; dl20J-3: 5′-CTC ATC TAT ACA TGG TAA TAG CAG GTG GC-3′; and dl20J-4: 5′-CAG TTA GAG AAG GCT AGA AGT AGC AGA GG-3′) using a protocol provided by W. Wagner (Laboratory of Cell Biology, National Institutes of Health/National Heart, Lung, and Blood Institute). All experiments were performed on mice homozygous for the dilute lethal allele. For experiments using the DLS/LeJ strain, we used wild-type C57BL/6 mice purchased from Harlan Sprague Dawley as controls. For experiments using the dl20J strain, we used wild-type littermates as controls.
Cell culture.
Superior cervical and dorsal root ganglia were dissected from postnatal mice (P4 for the DLS/LeJ experiments and P3–P5 for the dl20J experiments) and then dissociated and cultured on glass coverslips coated with poly-d-lysine (molecular weight, 70,000–150,000; Sigma) and Matrigel (BD Biosciences). The cultures were maintained at 37°C in Leibovitz's L-15 medium (phenol red free; Invitrogen) supplemented with 0.6% glucose, 2 mm l-glutamine, 50 ng/ml nerve growth factor (BD Biosciences), 10% adult rat serum (Harlan Sprague Dawley), and 0.5% hydroxypropylmethylcellulose (methocel; Dow, Corning, and Midland).
Cloning and transfection.
The pEGFP-NFM expression vector coded for the codon-optimized F64L/S65T variant of green fluorescent protein (GFP) fused to the N terminus of mouse neurofilament protein M (NFM) by a 25 aa linker (Yan et al., 2007). The photoactivatable construct was created by subcloning the mouse NFM cDNA into the pPAGFP-C1 vector of Patterson and Lippincott-Schwartz (2002). The resulting pPAGFP-NFM expression vector was identical to the pEGFP-NFM vector in all respects, except for the PAGFP (photoactivatable GFP) coding sequence. The pDsRed2 construct was purchased from Clontech. pmCherry was obtained by subcloning mCherry(Shaner et al., 2004) into pEGFP-C1 (Clontech) in place of the EGFP sequence. The plasmids were purified using EndoFree Maxi plasmid purification kits (Qiagen). The DNA was diluted to 20 μg/ml in 50 mm potassium glutamate, pH 7, and transfection was performed by nuclear injection as described previously (Brown, 2003a).
Imaging.
For live-cell imaging, neurons on coverslips were mounted in a Bioptechs FCS2 closed-bath heated imaging chamber (Bioptechs) and maintained on the microscope stage for up to 6 h at 37°C in Hibernate A low-fluorescence medium (BrainBits) supplemented with 0.3% glucose, 1 mm l-glutamine, 2% (v/v) B27 supplement (Invitrogen), 62.5 mm NaCl, 2 μg/ml gentamicin ( Invitrogen ), and 50 ng/ml 2.5S nerve growth factor. The observation medium was changed every 2 h using the perfusion ports on the chamber. Cells were observed by epifluorescence and either differential interference contrast (DIC) or phase contrast microscopy on a Nikon TE2000 or TE300 inverted microscope (Nikon) using a Nikon 100×/1.40 NA Plan Apo DIC or Nikon 100×/1.4 NA Plan Apo Ph oil-immersion objective and FITC/EGFP, TRITC/DsRed, or Texas Red/mCherry filter sets (Chroma Technology). The objective was maintained at 37°C using a Bioptechs objective heater. Immunostained cells were observed using a Nikon 20×/0.75 NA Plan Fluor multi-immersion or Nikon 100×/1.40 NA Plan Apo DIC objective. Images of fixed and living cells were acquired using a CoolSnap HQ or Micromax 512BFT-cooled CCD camera (Roper Scientific) and MetaMorph software (Molecular Devices).
Neurofilament movement in naturally occurring gaps.
For time-lapse imaging of neurofilament movement in naturally occurring gaps, neurons were transfected with pEGFP-NFM by nuclear injection 2 d after plating and then observed 3 d later. The epifluorescent illumination was attenuated eightfold using neutral density filters, and images were acquired with 1 s exposures at 4 s intervals. Neurofilament movement was analyzed by tracking the position of the leading end of the filament using the TrackPoints function in the Motion Analysis module of the MetaMorph software. We tracked the movement of all objects that exceeded 1.3 μm in length and that moved >2.6 μm along the axon in either direction. Neurofilament length was determined using the Region Measurements function in MetaMorph. Frequency of movement was calculated by dividing the number of moving objects by the total time in minutes. Filaments were classified as either anterograde or retrograde based on their net direction of movement during the tracking period. A filament was considered to reverse direction if it moved for at least 8 μm in the opposite direction. For each time interval, we calculated an interval velocity which is the distance moved in one time interval divided by the duration of that time interval. The average velocity, including pauses for each filament, was calculated by averaging all the interval velocities for that filament. The average velocity excluding pauses was calculated by averaging all the interval velocities, except those <1 pixel/s (0.13 μm/s), which we estimate to be the precision limit of our measurements (Wang and Brown, 2001). Displacements of <0.13 μm/s were considered to be pauses.
Fluorescence photoactivation pulse–escape experiments.
For pulse–escape experiments, neurons were cotransfected with pPAGFP-NFM and either pDsRed2 or pmCherry 2 d after plating and then observed and analyzed as described previously (Trivedi et al., 2007). For the DLS/LeJ experiments, we used DsRed2, and we acquired movies 5–7 d after plating. For the dl20J experiments, we used mCherry and acquired movies 5–8 d after plating. Transfected cells were identified based on the presence of DsRed2 or mCherry fluorescence, and a 20 μm segment of axon was photoactivated using violet light. The region of axon to be photoactivated was defined using a field-limiting diaphragm in a conjugate focal plane of the epifluorescent illumination light path. Time-lapse images of the photoactivated green fluorescence were acquired at 5 min intervals using 1 s exposures for 115 min. To avoid measurable photobleaching, all focusing was performed on the DsRed2/mCherry channel, and the exciting light on the GFP channel was attenuated 32-fold using neutral density filters. Measurements of the fluorescence intensity in the activated region were performed using MetaMorph software, and the resulting values were corrected for background and expressed as arbitrary analog-to-digital units per micrometer of axon (ADU/μm). When using DsRed2, we also corrected for cross-excitation on the GFP channel as described previously (Trivedi et al., 2007). If the first frame of the time-lapse series was out of focus, the movie was not analyzed. If any subsequent frames were out of focus, we estimated the fluorescence intensity for those time intervals by linear interpolation between the adjacent time intervals in the series. If more than two consecutive frames were out of focus, the movie was not analyzed.
Calculation of mean time to depart.
In the pulse–escape experiments, the fluorescence intensity as a function of time, F(t), is proportional to the number of neurofilaments in the activated region. Since it takes only seconds for a neurofilament to move out of the activated region, the velocity of movement has negligible influence on the pulse–escape kinetics, at least on a time course of minutes or hours. Thus, F(t) is determined by the pause durations. If the fluorescence intensity is normalized such that F(0) = 1, then F(t) can be considered to represent the probability that a neurofilament is still in the activated region at time t. Thus, the probability that a neurofilament leaves the activated region within time interval [t: t + Δt] is given by ƒ(t) − ƒ(t + Δt) = (−dƒ/dt)Δt for small time intervals Δt, and the probability density of escape times ρ(t) is given by −dƒ/dt. It follows that the probability of a neurofilament departing from the activated region in time interval [t: t + Δt] is given by ρ(t)Δt.
We have shown previously that the kinetics of departure in the pulse–escape experiments obey a double exponential relationship (Trivedi et al., 2007). Thus the non-normalized fluorescence intensity in the activated region is given by F(t) = a1 exp(−λ1t) + a2 exp(−λ2t), in which a1 and a2 are the fluorescence intensities at t = 0 attributable to neurofilaments in the mobile (“on track”) and stationary (“off track”) states, respectively, and λ1 and λ2 are the corresponding exponential decay constants. To normalize to the starting fluorescence intensity, we have to divide by a1 + a2, arriving at the following:
 |
Thus, the probability density of escape times is given as follows:
 |
The mean time to depart 〈T〉 is the first moment of the probability density of escape times, i.e., as follows:
 |
The parameters a1, a2, λ1, and λ2 were obtained from double exponential curve–fits of the pulse–escape data using Kaleidagraph software (Synergy Software).
Statistical analysis.
Statistical analyses of the velocities and frequencies of neurofilament movement in gaps were performed with SPSS software using the Kolmogorov–Smirnov and Mann–Whitney tests for two independent samples (SPSS). Statistical analyses of the pulse–escape data were performed by Drs. X. Li and Dr. L. Wei in the Center for Biostatistics at The Ohio State University (Columbus, OH). The data (not normalized) were subjected to log transformation to make them more normally distributed, and then the slopes were compared using a linear mixed effects model for repeated measures (Verbeke and Molenberghs, 2000; Diggle et al., 2002). We tested the hypothesis that the decay kinetics over time were group-independent (considering the groups to be wild type and dilute lethal), assuming a first-order autoregressive covariance structure within single pulse–escape traces and random effects for the slopes and intercepts to account for variability between axons.
Immunostaining.
Coverslips were washed twice with PBS and fixed for 30 min with 4% paraformaldehyde in PBS containing 1% sucrose, after which the cells were demembranated by treatment with 1% Triton X-100 in PBS for 15 min and processed for immunostaining using standard procedures. Neurofilaments were detected using rabbit polyclonal antibody (pAb) AB1987 (Millipore Bioscience Research Reagents), which is specific for NFM. The secondary Ab was Alexa 488-conjugated goat anti-rabbit IgG (Molecular Probes). Coverslips were mounted on microscope slides using ProLong Gold Antifade reagent (Molecular Probes).
Western blotting.
Brain and spinal cord tissue were homogenized in SDS-PAGE loading buffer containing 2% SDS using a Teflon glass homogenizer. The homogenates were then sonicated for 5 min in a bath sonicator and stored at −20°C. Protein concentration was determined with the Bradford Protein Assay kit (Bio-Rad) using BSA as a standard. For electrophoresis, the samples were diluted in loading buffer, heated for 5 min at 95°C, centrifuged at 15,000 × g for 10 min at room temperature, and then resolved by SDS-PAGE on 7.5% polyacrylamide gels. Proteins were transferred to PVDF membranes (Millipore Immobilon-P Transfer Membrane, pore size 0.45 μm) by tank blotting. Myosin Va was detected using rabbit pAb LOOP2 (gift from J. Hammer, Laboratory of Cell Biology, National Institutes of Health/National Heart, Lung, and Blood Institute, Bethesda, MD). NFM was detected using rabbit pAb AB1987 (Millipore Bioscience Research Reagents) or mouse monoclonal Ab (mAb) RMO270 (Invitrogen) (Lee et al., 1987), both of which bind in a phospho-independent manner (Yan et al., 2007). Phosphorylated NFM was detected using mouse mAb RMO55 (gift from Dr. V. Lee, University of Pennsylvania, Philadelphia, PA) (Lee et al., 1987). Neurofilament protein H (NFH) was detected using rabbit pAb AB1989 (Millipore Bioscience Research Reagents), which binds in a phospho-independent manner (Yan et al., 2007). Phosphorylated NFH was detected using mouse mAbs SMI34 (Covance) or RT97 (BioDesign). α-Tubulin was detected with mouse mAb B-5-1-2 (Sigma). The secondary Abs were either goat anti-rabbit IgG or goat anti-mouse IgG, each conjugated to HRP (Jackson ImmunoResearch). Blots were processed using ECL Plus Western blotting detection reagents (GE Healthcare) and Blue x-ray films (Phenix Research Products). The films were digitized on a Microtek Scanmaker i900 flatbed scanner (Microtek). For quantification of neurofilament phosphorylation, the intensities of the corresponding bands from wild-type and dilute lethal samples were measured using MetaMorph software and corrected for background by background subtraction. To avoid concerns about saturation and nonlinearity on the films, we measured the intensity of each band at a range of exposures (5–120 s) and used only those exposures that were in the linear range.
Results
The dilute lethal mutation in DLS/LeJ mice has not been sequenced so PCR genotyping is not possible. However, DLS/LeJ mice homozygous for the dilute lethal mutation can be distinguished from their wild-type and heterozygous littermates by 4 d after birth based on their pale coat color (Fig. 1A). Western blot analysis of brain tissue from these mice confirmed the absence of myosin Va protein (Fig. 1B). The dilute lethal mutation in dl20J mice has been sequenced, so we were able to genotype these mice by PCR (Fig. 1C).
Figure 1.
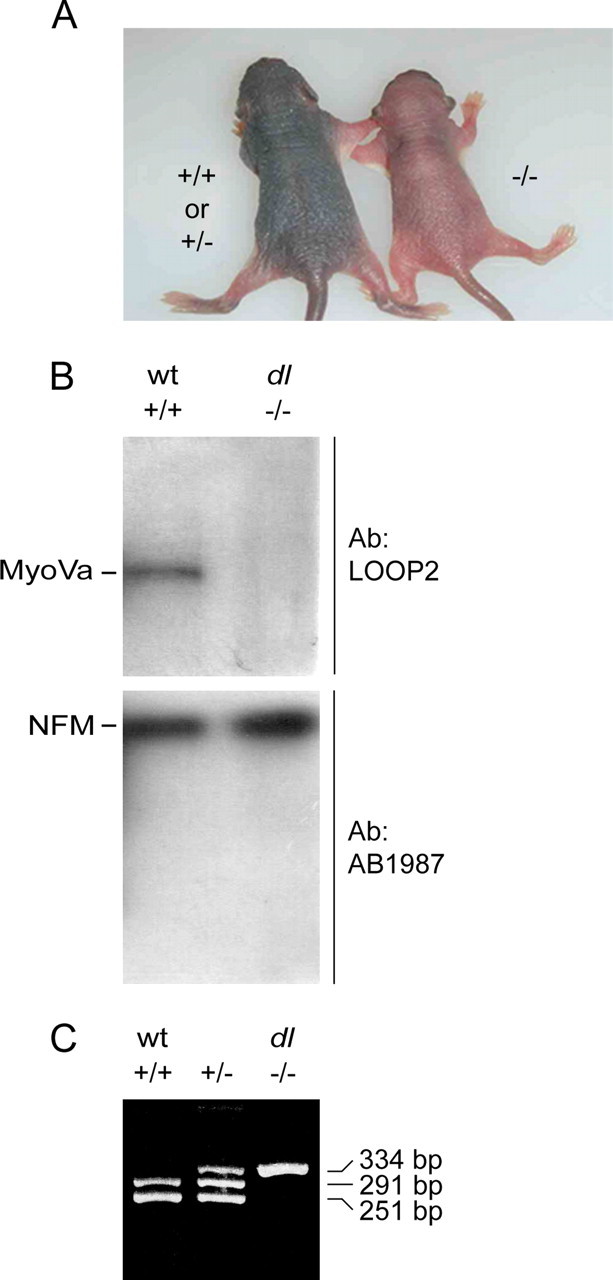
Phenotyping and genotyping dilute lethal mice. A, Two P4 DLS/LeJ mouse pups from the same litter. The dilute lethal (myoVa−/−) mice can be distinguished from their wild-type (myoVa+/+) and heterozygous (myoVa+/−) siblings based on their color. B, Western blot analysis of brain tissue from wild-type and DLS/LeJ dilute lethal mouse pups. The membrane was cut in half, and the upper part was probed with a myosin Va Ab (LOOP2), whereas the lower part was probed with an NFM Ab (AB1987) as a loading control. C, PCR genotyping of dl20J mice. Wild-type mice (myoVa+/+) were identified by the appearance of two bands at 251 and 291 bp. Mice homozygous for the dl20J allele (myoVa−/−) were identified by the appearance of one band at 334 bp. Heterozygotes (myoVa+/−) were identified by the appearance of three bands at 251, 291, and 334 bp.
To investigate the role of myosin Va in neurofilament transport, we cultured neurons from the superior cervical ganglia (SCG) and dorsal root ganglia (DRG) of DLS/LeJ and dl20J mice homozygous for the dilute lethal mutation. The neurons were morphologically indistinguishable from wild-type and extended axons that were comparable in length, which is consistent with previous reports that myosin Va is not involved in axonal outgrowth (Evans et al., 1997). To investigate the distribution of neurofilaments in dilute lethal axons, we performed immunostaining on fixed cultures of SCG neurons from DLS/LeJ mice. Both wild-type and dilute lethal axons contained neurofilaments, and both exhibited discontinuities in the neurofilament array, which we have termed naturally occurring gaps (Wang et al., 2000) (Fig. 2). There was no apparent difference in the number or distribution of these gaps between wild-type and dilute lethal axons.
Figure 2.

Dilute lethal neurons extend axons that contain neurofilaments and gaps. A, B, Immunostaining of cultured SCG neurons from wild-type and DLS/LeJ dilute lethal mice, 24 h after plating. Neurofilaments were seen to extend throughout both wild-type and dilute lethal axons, with no observable difference in axon length or branching pattern. Scale bar, 20 μm. C, D, There was no apparent difference in the number or the distribution of gaps in the neurofilament array between wild-type and dilute lethal axons. Scale bar, 4 μm.
To analyze the short-term motile behavior of neurofilaments, we transfected cultured SCG neurons from wild-type and DLS/LeJ dilute lethal mice with GFP-NFM fusion protein by nuclear injection, and then we tracked the movement of GFP-tagged fluorescent neurofilaments through gaps in the axonal neurofilament array (Wang et al., 2000). Neurofilaments in both wild-type and dilute lethal neurons moved in a rapid, intermittent, and bidirectional manner (Fig. 3). The average frequency of movement was 0.22 filaments/min in the wild-type and 0.16 filaments/min in the dilute lethal, which represents a decrease of 27%, but this difference did not rise to the level of statistical significance (Fig. 4 and supplemental Table 1, available at www.jneurosci.org as supplemental material). Statistical analysis also revealed no significant difference in the average or peak velocities (Fig. 4 and supplemental Table 1, available at www.jneurosci.org as supplemental material).
Figure 3.

Examples of moving neurofilaments in wild-type and dilute lethal axons. A, B, Trajectories of two neurofilaments in wild-type axons. C, D, Trajectories of two neurofilaments in DLS/LeJ dilute lethal axons. Each point in these graphs represents the location of the neurofilament in one 4 s time interval. The x-axis represents the time elapsed since the start of the movie. The y-axis represents the distance of the neurofilament from the point in which it was first tracked, measured along the axis of the axon. Anterograde and retrograde movements are represented as positive and negative displacements, respectively. The neurofilaments in A and C moved in a net anterograde direction, whereas the neurofilaments in B and D moved in a net retrograde direction.
Figure 4.

Analysis of moving neurofilaments in wild-type and dilute lethal axons. Histograms of frequency of movement (A, B), average velocities (including and excluding pauses) (C–F), and peak velocities (G, H) of neurofilaments in wild-type (n = 58) and DLS/LeJ dilute lethal (n = 53) axons. In total, we imaged 27 gaps in axons from three different batches of wild-type cultures and 21 gaps in axons from three different batches of dilute lethal cultures. The average length of the time-lapse movies was 13.3 min. Anterograde and retrograde movements are represented on the y-axis as positive and negative values, respectively. The average velocity including pauses represents the overall average for all the time intervals in which the neurofilament was tracked. Average velocity excluding pauses represents the average for only those time intervals in which the neurofilament moved. Statistical comparison of these data revealed no significant difference between wild type and dilute lethal for either direction of movement (supplemental Table 1, available at www.jneurosci.org as supplemental material).
We have shown previously that axonal neurofilaments spend ∼97% of their time in a prolonged pausing state, with pause times that greatly exceed the duration of our time-lapse movies (Trivedi et al., 2007). Thus, tracking the movement of neurofilaments through naturally occurring gaps greatly underestimates their pausing behavior. To address this concern, we investigated neurofilament transport in dilute lethal neurons using the pulse–escape fluorescence photoactivation technique (Trivedi et al., 2007). We selected DRG neurons for these experiments because of their high neurofilament content and absence of gaps. The neurons were cotransfected with PAGFP-NFM and a diffusible red fluorescent protein (DsRed2 or mCherry), which served as a marker for transfection (Fig. 5). Three days later, we activated the fluorescence in 20 μm segment of axon and used time-lapse imaging at 5 min time intervals to track the rate of departure of neurofilaments from the activated regions over a 2 h period. We have shown previously that it takes only seconds for a filament to move out of these activated regions, so the kinetics over a period of 2 h are dictated solely by the pause durations of the activated filaments (Trivedi et al., 2007). Thus the pulse–escape kinetics reflect the long-term pausing behavior of the neurofilaments.
Figure 5.

A pulse–escape fluorescence photoactivation experiment. Example of a wild-type DRG neuron that was transfected with PAGFP-NFM and a diffusible red fluorescent protein (DsRed2) as a marker for transfection. A, The DsRed2 fluorescence, which fills the axon. B, A preactivation image of the same axon showing no GFP fluorescence. C, An image of the same axon immediately after activation using violet light. D, An image of the same axon 2 h later. The white arrowheads show the location of the activated region. The decrease in fluorescence between C and D is attributable to departure of fluorescent neurofilaments from the activated region, but note that many neurofilaments remain. Scale bar, 5 μm.
We first performed these experiments using DLS/LeJ dilute lethal mice. The decline in the fluorescence was gradual in both the wild-type and dilute lethal neurons, and many neurofilaments remained in the activated region after 2 h. To compare the data, we normalized the intensities to the starting fluorescence intensity for each axon. For wild-type DRG neurons, the average fluorescence intensity remaining in the activated region after 115 min was 65% of the starting intensity (Fig. 6A,C). As reported previously for rat SCG neurons, the kinetics matched a double exponential decay function (Trivedi et al., 2007). On the basis of the exponential decay constants, the mean time to depart from the activated region was 315 min. For DLS/LeJ dilute lethal DRG neurons, the average fluorescence intensity remaining in the activated region after 115 min was 73% of the starting intensity, which is 12% more than for the wild type (Fig. 6B,D). The mean time to depart was 466 min, which was 48% more than for the wild type. Thus, a small difference in the percentage of neurofilaments remaining after 2 h can translate into a large difference in the transport kinetics on longer time scales.
Figure 6.

Pulse-escape kinetics for wild type and DLS/LeJ mice. A, B, Box-and-whisker plots for 27 wild-type axons and 24 DLS/LeJ dilute lethal axons that were imaged for 115 min at 5 min intervals (data normalized to the starting fluorescence intensity for each axon). The axon-to-axon variability is due in part to the stochastic nature of the movement. C, D, Plots of the average fluorescence intensities. After 115 min, the average percentage of the initial fluorescence remaining in the activated regions was 65% for the wild type and 73% for the dilute lethal. The data matches a double exponential decay (curve fit). Considering the pulse–escape kinetics to represent a probability density function, the mean time for a neurofilament to depart the activated regions was equal to 5.3 h in wild-type neurons and 7.8 h in dilute lethal neurons. E–J, Plots of the log-transformed kinetics for three representative wild-type axons and three representative dilute lethal axons. K, L, Histograms of the slopes for 27 wild-type and 24 dilute lethal neurons. The average of the slopes for the dilute lethal axons (−0.013 ln[ADU·μm−1]·min−1) was less than for the wild-type axons (−0.019 ln[ADU·μm−1]·min−1), and this difference was statistically significant (p < 0.001).
To analyze the pulse–escape data statistically, we performed a log transformation of each pulse–escape profile (not normalized) and then compared the wild-type and dilute lethal profiles using a linear-mixed-effects model for repeated measures, assuming a first-order autoregressive covariance structure within each data set and random effects for the slopes and intercepts to account for variability between axons. The average slope was −0.019 ln[ADU·μm−1]·min−1 for the wild-type axons and −0.013 ln[ADU·μm−1]·min−1 for the dilute lethal axons, which represents a 32% decrease, and this was statistically significant (p < 0.001) (Fig. 6E–L).
One potential concern with the above data is that we used C57BL/6 mice as our wild-type controls. C57BL/6 mice were also used as controls for DLS/LeJ mice in the original report of neurofilament interaction with myosin Va (Rao et al., 2002a), but the DLS/LeJ strain, which arose in 1950, is actually derived from C57BL/Gr mice. Thus, we cannot rule out the possibility that the difference in the pulse–escape kinetics between the DLS/LeJ and wild-type neurons could be caused by differences in genetic background. To address this concern, we repeated the pulse–escape analysis with a second cohort of dilute lethal mice, but this time we used the dl20J strain with littermate controls. After 115 min, the average fluorescence intensity remaining in the activated region was 69% of the starting intensity for the wild type (Fig. 7A,C) and 88% for the dilute lethal (Fig. 7B,D), which represents an increase of 28%. As for the DLS/LeJ neurons, the kinetics could be fitted with a double exponential function, yielding a mean time for departure of 482 min for the wild type and 1294 min for the dilute lethal. This corresponds to a 169% increase compared with the wild type. Statistical comparison of the data using the linear-mixed-effects model described above yielded average slopes of −0.013 ln[ADU·μm−1]·min−1 for wild-type axons and −0.005 ln[ADU·μm−1]·min−1 for dilute lethal axons, which represents a 62% decrease, and this difference was statistically significant (p < 0.0001) (Fig. 7E–L). Thus, pulse–escape fluorescence photoactivation experiments in DRG neurons from two different strains of dilute lethal mice confirm that neurofilaments spend more time pausing in the absence of myosin Va.
Figure 7.

Pulse–escape kinetics for wild-type and dl20J mice. A, B, Box-and-whisker plots for 23 wild-type axons and 24 dl20J dilute lethal axons that were imaged for 115 min at 5 min intervals (data normalized to the starting fluorescence intensity for each axon). The axon-to-axon variability is due in part to the stochastic nature of the movement. C, D, Plots of the average fluorescence intensities. After 115 min, the average percentage of the initial fluorescence remaining in the activated regions was 69% for the wild type and 88% for the dilute lethal. The data match a double exponential decay (curve fit). Considering the pulse–escape kinetics to represent a probability density function, the mean time for a neurofilament to depart the activated regions was equal to 8.0 h in wild-type neurons and 21.6 h in dilute lethal neurons. E–J, Plots of the log-transformed kinetics for three representative wild-type axons and three representative dilute lethal axons. K, L, Histograms of the slopes for 23 wild-type and 24 dilute lethal neurons. The average of the slopes for the dilute lethal axons (−0.005 ln[ADU·μm−1]·min−1) was less than for the wild-type axons (−0.013 ln[ADU·μm−1]·min−1), and this difference was statistically significant (p < 0.0001).
Although controversial, there is evidence that phosphorylation of KSP motifs in the neurofilament tail domain may slow neurofilament transport and that this may be caused by an increase in the proportion of the time that the neurofilaments spend pausing (see Discussion). Thus, one possible explanation for the above data is that the absence of myosin Va somehow results in an increase in neurofilament phosphorylation. To test this hypothesis, we used quantitative Western blot analysis to investigate the phosphorylation states of NFH and NFM in spinal cord homogenates from wild-type and dl20J dilute lethal mice (Fig. 8). We used two phospho-independent Abs (AB1989, which is specific for NFH, and RMO270, which is specific for NFM) and three phospho-dependent mAbs (SMI34 and RT97, which are specific for NFH, and RMO55, which is specific for NFM). We found no significant difference in the total amount of NFM and NFH protein or in the extent of their phosphorylation at the SMI34, RT97, or RMO55 epitopes. This suggests that the prolonged pauses observed in dilute lethal neurons are not caused by an increase in neurofilament phosphorylation.
Figure 8.

Neurofilament phosphorylation state in wild-type and dl20J mice. A, Western blots of mouse spinal cord homogenates from wild-type (wt) and dl20J dilute lethal (dl) P4 mice. The blot membranes were cut in half, and the upper half was probed with neurofilament Ab, whereas the lower half was probed with tubulin Ab (α-tub). NFM was detected with mAb RMO270, which binds in a phospho-independent manner. Phosphorylated NFM was detected with mAb RMO55, which binds to phosphorylated epitopes on NFM in a phospho-dependent manner. NFH was detected with pAb AB1989, which binds in a phospho-independent manner. Phosphorylated NFH was detected with mouse mAbs SMI34 and RT97, which bind to phosphorylated epitopes on NFH in a phospho-dependent manner. Tubulin served as a loading control and was detected with mAb B-5-1-2. B, Quantification of blot staining intensities. Each blot was performed in triplicate. For each lane on each blot, the background-corrected intensity of the neurofilament band was divided by the background-corrected intensity of the corresponding tubulin band. For each neurofilament Ab, the resulting intensity ratios were then averaged and normalized to the average for the wild type. The error bars represent the SD about the mean. We observed no significant difference in the intensities of the bands in wild-type and dilute lethal tissue (p = 0.95 for RMO270; p = 0.67 for RMO55; p = 0.73 for AB1989; p = 0.96 for RT97; p = 0.57 for SMI34; Student's t test).
Discussion
Our data on the movement of neurofilaments through naturally occurring gaps in the axonal neurofilament array of cultured SCG neurons from wild-type and dilute lethal mice indicate that there is no significant difference in the velocity of neurofilament movement in the presence or absence of myosin Va, at least on the timescale of our time-lapse movies. Thus, myosin Va does not appear to be a motor for micrometer-scale movement of neurofilaments in these axons. This agrees with the prevailing view that microtubules are the tracks for long-range movement of axonal neurofilaments (see Introduction). However, our pulse–escape fluorescence photoactivation experiments in cultured DRG neurons revealed a statistically significant increase in the amount of time neurofilaments spend pausing in dilute lethal neurons compared with wild-type controls, and this was the case for two independent strains of dilute lethal mice.
Using kinetic and computational analyses, we have shown previously that axonal neurofilaments switch between distinct mobile and stationary states, which we term on-track and off-track (Brown et al., 2005; Craciun et al., 2005; Trivedi et al., 2007). Neurofilaments in the on-track state alternate between short bouts of rapid movement and short pauses, whereas those in the off-track state pause without interruption for long periods of time. The filaments spend only a very small proportion of their time in the mobile (on-track) state, so prolonged off-track pauses dominate the pulse–escape kinetics. Thus, the increased pausing of neurofilaments in the absence of myosin Va reflects an increase in the time spent engaged in prolonged off-track pauses.
Although the focus of this article is a comparison of wild-type and dilute lethal neurons, our data also provide a first look at the transport behavior of neurofilaments in cultured DRG neurons. Whereas neurofilaments in cultured rat SCG neurons exhibit a mean departure time of 96 min (calculated from Trivedi et al., 2007), neurofilaments in cultured mouse DRG neurons exhibited mean departure times of 315 min in the DLS/LeJ experiment and 482 min in the dl20J experiment. In other words, the average time for a neurofilament to leave the activated region in these neurons was 5–8 h, and extrapolation of these data based on the double-exponential curve fits indicate that it would take 12–18 h for 90% of the filaments to depart. Thus, axonal neurofilaments in cultured DRG neurons pause considerably more than in cultured SCG neurons. Since the pausing behavior of neurofilaments is a key determinant of their residence time in the axon, it is attractive to speculate that this could account, in part, for the high neurofilament content of DRG axons compared with SCG axons.
Both the DLS/LeJ and dl20J neurons exhibited greater neurofilament pausing in the pulse–escape experiments compared with the wild-type controls, but the magnitude of this difference was greater for the dl20J neurons. In addition, the inflection in the pulse–escape curves was more pronounced (i.e., they were more obviously biphasic) for both the wild-type and the mutant neurons in the dl20J experiment compared with the DLS/LeJ experiment, which suggests that the frequency of transitions between the on-track and off-track pausing states was lower. At present, the explanation for these differences is unclear. It could be due in part to differences in the genetic background of the DLS/LeJ and dl20J mice, but this cannot be the whole explanation because the genetic background of the wild-type controls was at least nominally the same in both experiments.
If neurofilaments spend more time pausing in the absence of myosin Va, we might expect that our observations on naturally occurring gaps should reveal a lower frequency of neurofilament movement in the absence of this motor. In fact, the average frequency was 27% less in dilute lethal neurons than in wild-type neurons, but this difference was not statistically significant. It is interesting to note that the Black lab also reported a decrease in the frequency of neurofilament movement (by 40%) in axons depleted of actin filaments (Francis et al., 2005), although in that case the data were not analyzed statistically. Thus, it is possible that there is a decrease in the frequency of neurofilament movement in dilute lethal neurons but that we did not analyze a sufficient number of movies to establish statistical significance, especially given the short duration of our time-lapse movies (15 min) and the low frequency of movement (only several filaments per movie). Alternatively, it is possible that the average duration of long-term pauses (revealed by our pulse–escape experiments) could increase without any change in the average frequency of short-term movements (revealed by our observations of naturally occurring gaps) if the increase in pausing were accompanied by a decrease in the duration of each bout of movement. Further studies will be required to discriminate between these possibilities.
Nixon and colleagues (2002a) reported that neurofilaments are approximately two times more abundant in sciatic nerve axons of DLS/LeJ dilute lethal mice in vivo compared with wild-type mice. Since neurofilaments pause more in the absence of myosin Va, it follows that their overall transport rate is slower. Thus, we propose that neurofilament transport is slower in dilute lethal mice and that the greater abundance of neurofilaments in dilute lethal axons is the result of an increase in the residence time of neurofilaments in these axons compared with the wild type. Proof of this hypothesis in vivo will require direct measurement of neurofilament transport rate in dilute lethal mice. At present, the only way to do this is using radioisotopic pulse-labeling, but unfortunately, the dilute lethal mice do not live long enough to make such studies possible.
One possible mechanism for the increase in neurofilament pausing in the absence of myosin Va is that there is an increase in neurofilament phosphorylation. The role of phosphorylation in neurofilament transport is controversial because recent reports suggest that neurofilaments lacking the highly phosphorylated tail domains of NFM and NFH move at normal rates in vivo (Rao et al., 2002b, 2003; Yuan et al., 2006). However, there is also considerable circumstantial evidence correlating neurofilament phosphorylation with a slowing in neurofilament transport in vivo (Archer et al., 1994; Nixon et al., 1994; Jung et al., 2000; Sanchez et al., 2000), and there is direct evidence that neurofilament phosphorylation slows neurofilament transport in cultured neurons (Ackerley et al., 2000, 2003). To examine whether neurofilament phosphorylation is altered in the absence of myosin Va, we performed quantitative Western blotting in wild-type and dilute lethal spinal cord using three phospho-specific Abs. It should be noted that one of these Abs, RT97, has been characterized extensively. The RT97 epitope is generated by phosphorylation at KSPXK and KSPXXXK sites in the tail domain of NFH (Veeranna et al., 2008), and phosphorylation at RT97 epitopes correlates directly with the slowing of neurofilament transport in mouse optic nerve (Sanchez et al., 2000). However, we found no difference in neurofilament phosphorylation using this Ab or either of the other phospho-dependent Abs. This suggests that altered phosphorylation is not the explanation for the increased pausing of neurofilaments in the absence of myosin Va.
Our data do not rule out the possibility that the effect of myosin Va on neurofilament pausing is an indirect one. However, since there is evidence that myosin Va can interact with neurofilaments (Rao et al., 2002a), it is attractive to speculate that the effect may be direct. Studies on the role of myosin Va in the axonal transport of membranous organelles have led to the hypothesis that this motor may be responsible for short-range movements in regions of axoplasm devoid of microtubules (Langford, 1995; Bridgman, 1999, 2004). Since neurofilaments pause for more prolonged periods in the absence of myosin Va, it is attractive to speculate that myosin Va may have a similar role in neurofilament transport. Although actin filaments are known to be concentrated in the subaxolemmal region of axons, they are also abundant in the interior of the axon, especially in the vicinity of axonal microtubules (Fath and Lasek, 1988; Bearer and Reese, 1999). Thus, myosin Va could act as a short-range motor to increase the efficiency of neurofilament transport by delivering neurofilaments to their microtubule tracks or by facilitating their association with microtubule tracks in some other way (Fig. 9). In this regard, it is interesting to note that in large axons neurofilaments generally outnumber microtubules, and thus, many neurofilaments may be some distance from the nearest microtubule track. By transporting neurofilaments along actin filaments in the radial dimension of the axon, myosin Va may increase the frequency with which these stranded neurofilaments encounter microtubule tracks, thereby curtailing the duration of the off-track pauses. Myosin Va could also facilitate the transition of neurofilaments from one microtubule to another, such as must occur when a neurofilament reaches the end of one microtubule track or dissociates from its microtubule track. According to this hypothesis, the transport and organization of neurofilaments may be orchestrated by the coordinated actions of at least three different motor proteins, kinesin-1, dynein, and myosin-Va, which act together to convey and distribute these polymers along axons.
Figure 9.

Hypothesis: myosin Va is a short-range motor for neurofilament transport. We speculate that myosin Va is capable of moving neurofilaments longitudinally or radially for short distances along actin filament tracks in axons. According to this hypothesis, myosin Va decreases the duration of the prolonged off-track pauses by delivering off-track neurofilaments to their microtubule tracks, thereby increasing the efficiency of neurofilament transport. In the absence of myosin Va, off-track neurofilaments may become stranded away from their microtubule tracks for longer periods of time, and on-track neurofilaments that disengage from their tracks may take longer to re-engage. This would lead to neurofilament accumulation along the axons, which could explain the increase in neurofilament number in axons of dilute lethal mice reported by Nixon and colleagues (Rao et al., 2002a).
Footnotes
This work was supported by a research project grant from the National Institutes of Health/National Institute of Neurological Disorders and Stroke (NIH/NINDS) (to A.B.) and a Center Core Grant from NIH/NINDS. We thank Kitty Jensen and Gulsen Colakoglu in the Brown laboratory for cloning the PAGFP-NFM and mCherry constructs, Nancy Jenkins (Institute of Molecular and Cell Biology, Singapore) for the dl20J mice, Wolfgang Wagner [NIH/National Heart, Lung, and Blood Institute (NHLBI)] for the dl20J PCR genotyping protocol, John Hammer (NIH/NHLBI) for myosin Va Ab, George Patterson (NIH/National Institute of Child Health and Human Development) for the PA-GFP cDNA, Roger Tsien (University of California, San Diego) for the mCherrycDNA, and Xiaobai Li and Lai Wei of the Ohio State University Center for Biostatistics for performing the statistical analysis of the pulse–escape data.
References
- Ackerley S, Grierson AJ, Brownlees J, Thornhill P, Anderton BH, Leigh PN, Shaw CE, Miller CC. Glutamate slows axonal transport of neurofilaments in transfected neurons. J Cell Biol. 2000;150:165–176. doi: 10.1083/jcb.150.1.165. [DOI] [PMC free article] [PubMed] [Google Scholar]
- Ackerley S, Thornhill P, Grierson AJ, Brownlees J, Anderton BH, Leigh PN, Shaw CE, Miller CC. Neurofilament heavy chain side arm phosphorylation regulates axonal transport of neurofilaments. J Cell Biol. 2003;161:489–495. doi: 10.1083/jcb.200303138. [DOI] [PMC free article] [PubMed] [Google Scholar]
- Archer DR, Watson DF, Griffin JW. Phosphorylation-dependent immunoreactivity of neurofilaments and the rate of slow axonal transport in the central and peripheral axons of the rat dorsal root ganglion. J Neurochem. 1994;62:1119–1125. doi: 10.1046/j.1471-4159.1994.62031119.x. [DOI] [PubMed] [Google Scholar]
- Bearer EL, Reese TS. Association of actin filaments with axonal microtubule tracts. J Neurocytol. 1999;28:85–98. doi: 10.1023/a:1007025421849. [DOI] [PMC free article] [PubMed] [Google Scholar]
- Bridgman PC. Myosin Va movements in normal and dilute-lethal axons provide support for a dual filament motor complex. J Cell Biol. 1999;146:1045–1060. doi: 10.1083/jcb.146.5.1045. [DOI] [PMC free article] [PubMed] [Google Scholar]
- Bridgman PC. Myosin-dependent transport in neurons. J Neurobiol. 2004;58:164–174. doi: 10.1002/neu.10320. [DOI] [PubMed] [Google Scholar]
- Brown A. Live-cell imaging of slow axonal transport in cultured neurons. Methods Cell Biol. 2003a;71:305–323. doi: 10.1016/s0091-679x(03)01014-8. [DOI] [PMC free article] [PubMed] [Google Scholar]
- Brown A. Axonal transport of membranous and nonmembranous cargoes: a unified perspective. J Cell Biol. 2003b;160:817–821. doi: 10.1083/jcb.200212017. [DOI] [PMC free article] [PubMed] [Google Scholar]
- Brown A, Wang L, Jung P. Stochastic simulation of neurofilament transport in axons: the “stop-and-go” hypothesis. Mol Biol Cell. 2005;16:4243–4255. doi: 10.1091/mbc.E05-02-0141. [DOI] [PMC free article] [PubMed] [Google Scholar]
- Craciun G, Brown A, Friedman A. A dynamical system model of neurofilament transport in axons. J Theor Biol. 2005;237:316–322. doi: 10.1016/j.jtbi.2005.04.018. [DOI] [PMC free article] [PubMed] [Google Scholar]
- Diggle PJ, Heagerty P, Liang K-Y, Zeger S. Analysis of longitudinal data. Ed 2. New York: Oxford UP; 2002. [Google Scholar]
- Evans LL, Hammer J, Bridgman PC. Subcellular localization of myosin V in nerve growth cones and outgrowth from dilute-lethal neurons. J Cell Sci. 1997;110:439–449. doi: 10.1242/jcs.110.4.439. [DOI] [PubMed] [Google Scholar]
- Fath KR, Lasek RJ. Two classes of actin microfilaments are associated with the inner cytoskeleton of axons. J Cell Biol. 1988;107:613–621. doi: 10.1083/jcb.107.2.613. [DOI] [PMC free article] [PubMed] [Google Scholar]
- Francis F, Roy S, Brady ST, Black MM. Transport of neurofilaments in growing axons requires microtubules but not actin filaments. J Neurosci Res. 2005;79:442–450. doi: 10.1002/jnr.20399. [DOI] [PubMed] [Google Scholar]
- He Y, Francis F, Myers KA, Yu W, Black MM, Baas PW. Role of cytoplasmic dynein in the axonal transport of microtubules and neurofilaments. J Cell Biol. 2005;168:697–703. doi: 10.1083/jcb.200407191. [DOI] [PMC free article] [PubMed] [Google Scholar]
- Helfand BT, Loomis P, Yoon M, Goldman RD. Rapid transport of neural intermediate filament protein. J Cell Sci. 2003;116:2345–2359. doi: 10.1242/jcs.00526. [DOI] [PubMed] [Google Scholar]
- Jung C, Yabe JT, Shea TB. C-terminal phosphorylation of the high molecular weight neurofilament subunit correlates with decreased neurofilament axonal transport velocity. Brain Res. 2000;856:12–19. doi: 10.1016/s0006-8993(99)02314-8. [DOI] [PubMed] [Google Scholar]
- Jung C, Chylinski TM, Pimenta A, Ortiz D, Shea TB. Neurofilament transport is dependent on actin and myosin. J Neurosci. 2004;24:9486–9496. doi: 10.1523/JNEUROSCI.1665-04.2004. [DOI] [PMC free article] [PubMed] [Google Scholar]
- Langford GM. Actin- and microtubule-dependent organelle motors: interrelationships between the two motility systems. Curr Opin Cell Biol. 1995;7:82–88. doi: 10.1016/0955-0674(95)80048-4. [DOI] [PubMed] [Google Scholar]
- Lasek RJ, Paggi P, Katz MJ. Slow axonal transport mechanisms move neurofilaments relentlessly in mouse optic axons. J Cell Biol. 1992;117:607–616. doi: 10.1083/jcb.117.3.607. [DOI] [PMC free article] [PubMed] [Google Scholar]
- Lee VM, Carden MJ, Schlaepfer WW, Trojanowski JQ. Monoclonal antibodies distinguish several differentially phosphorylated states of the two largest rat neurofilament subunits (NF-H and NF-M) and demonstrate their existence in the normal nervous system of adult rats. J Neurosci. 1987;7:3474–3488. doi: 10.1523/JNEUROSCI.07-11-03474.1987. [DOI] [PMC free article] [PubMed] [Google Scholar]
- Millecamps S, Gowing G, Corti O, Mallet J, Julien JP. Conditional NF-L transgene expression in mice for in vivo analysis of turnover and transport rate of neurofilaments. J Neurosci. 2007;27:4947–4956. doi: 10.1523/JNEUROSCI.5299-06.2007. [DOI] [PMC free article] [PubMed] [Google Scholar]
- Nixon RA, Logvinenko KB. Multiple fates of newly synthesized neurofilament proteins: evidence for a stationary neurofilament network distributed nonuniformly along axons of retinal ganglion cell neurons. J Cell Biol. 1986;102:647–659. doi: 10.1083/jcb.102.2.647. [DOI] [PMC free article] [PubMed] [Google Scholar]
- Nixon RA, Paskevich PA, Sihag RK, Thayer CY. Phosphorylation on carboxyl terminus domains of neurofilament proteins in retinal ganglion cell neurons in vivo: influences on regional neurofilament accumulation, interneurofilament spacing, and axon caliber. J Cell Biol. 1994;126:1031–1046. doi: 10.1083/jcb.126.4.1031. [DOI] [PMC free article] [PubMed] [Google Scholar]
- Patterson GH, Lippincott-Schwartz J. A photoactivatable GFP for selective photolabeling of proteins and cells. Science. 2002;297:1873–1877. doi: 10.1126/science.1074952. [DOI] [PubMed] [Google Scholar]
- Rao MV, Engle LJ, Mohan PS, Yuan A, Qiu D, Cataldo A, Hassinger L, Jacobsen S, Lee VM, Andreadis A, Julien JP, Bridgman PC, Nixon RA. Myosin Va binding to neurofilaments is essential for correct myosin Va distribution and transport and neurofilament density. J Cell Biol. 2002a;159:279–290. doi: 10.1083/jcb.200205062. [DOI] [PMC free article] [PubMed] [Google Scholar]
- Rao MV, Garcia ML, Miyazaki Y, Gotow T, Yuan A, Mattina S, Ward CM, Calcutt NA, Uchiyama Y, Nixon RA, Cleveland DW. Gene replacement in mice reveals that the heavily phosphorylated tail of neurofilament heavy subunit does not affect axonal caliber or the transit of cargoes in slow axonal transport. J Cell Biol. 2002b;158:681–693. doi: 10.1083/jcb.200202037. [DOI] [PMC free article] [PubMed] [Google Scholar]
- Rao MV, Campbell J, Yuan A, Kumar A, Gotow T, Uchiyama Y, Nixon RA. The neurofilament middle molecular mass subunit carboxyl-terminal tail domains is essential for the radial growth and cytoskeletal architecture of axons but not for regulating neurofilament transport rate. J Cell Biol. 2003;163:1021–1031. doi: 10.1083/jcb.200308076. [DOI] [PMC free article] [PubMed] [Google Scholar]
- Roy S, Coffee P, Smith G, Liem RK, Brady ST, Black MM. Neurofilaments are transported rapidly but intermittently in axons: implications for slow axonal transport. J Neurosci. 2000;20:6849–6861. doi: 10.1523/JNEUROSCI.20-18-06849.2000. [DOI] [PMC free article] [PubMed] [Google Scholar]
- Sánchez I, Hassinger L, Sihag RK, Cleveland DW, Mohan P, Nixon RA. Local control of neurofilament accumulation during radial growth of myelinating axons in vivo: selective role of site-specific phosphorylation. J Cell Biol. 2000;151:1013–1024. doi: 10.1083/jcb.151.5.1013. [DOI] [PMC free article] [PubMed] [Google Scholar]
- Shah JV, Flanagan LA, Janmey PA, Leterrier JF. Bidirectional translocation of neurofilaments along microtubules mediated in part by dynein/dynactin. Mol Biol Cell. 2000;11:3495–3508. doi: 10.1091/mbc.11.10.3495. [DOI] [PMC free article] [PubMed] [Google Scholar]
- Shaner NC, Campbell RE, Steinbach PA, Giepmans BN, Palmer AE, Tsien RY. Improved monomeric red, orange and yellow fluorescent proteins derived from Discosoma sp. red fluorescent protein. Nat Biotechnol. 2004;22:1567–1572. doi: 10.1038/nbt1037. [DOI] [PubMed] [Google Scholar]
- Strobel MC, Seperack PK, Copeland NG, Jenkins NA. Molecular analysis of two mouse dilute locus deletion mutations: spontaneous dilute lethal20J and radiation-induced dilute prenatal lethal Aa2 alleles. Mol Cell Biol. 1990;10:501–509. doi: 10.1128/mcb.10.2.501. [DOI] [PMC free article] [PubMed] [Google Scholar]
- Trivedi N, Jung P, Brown A. Neurofilaments switch between distinct mobile and stationary states during their transport along axons. J Neurosci. 2007;27:507–516. doi: 10.1523/JNEUROSCI.4227-06.2007. [DOI] [PMC free article] [PubMed] [Google Scholar]
- Uchida A, Brown A. Arrival, reversal and departure of neurofilaments at the tips of growing axons. Mol Biol Cell. 2004;15:4215–4225. doi: 10.1091/mbc.E04-05-0371. [DOI] [PMC free article] [PubMed] [Google Scholar]
- Veeranna , Lee JH, Pareek TK, Jaffee H, Boland B, Vinod KY, Amin N, Kulkarni AB, Pant HC, Nixon RA. Neurofilament tail phosphorylation: identity of the RT-97 phosphoepitope and regulation in neurons by cross-talk among proline-directed kinases. J Neurochem. 2008;107:35–49. doi: 10.1111/j.1471-4159.2008.05547.x. [DOI] [PMC free article] [PubMed] [Google Scholar]
- Verbeke G, Molenberghs G. Linear mixed models for longitudinal data. New York: Springer; 2000. [Google Scholar]
- Wagner OI, Ascaño J, Tokito M, Leterrier JF, Janmey PA, Holzbaur EL. The interaction of neurofilaments with the microtubule motor cytoplasmic dynein. Mol Biol Cell. 2004;15:5092–5100. doi: 10.1091/mbc.E04-05-0401. [DOI] [PMC free article] [PubMed] [Google Scholar]
- Wang L, Brown A. Rapid intermittent movement of axonal neurofilaments observed by fluorescence photobleaching. Mol Biol Cell. 2001;12:3257–3267. doi: 10.1091/mbc.12.10.3257. [DOI] [PMC free article] [PubMed] [Google Scholar]
- Wang L, Ho CL, Sun D, Liem RK, Brown A. Rapid movement of axonal neurofilaments interrupted by prolonged pauses. Nat Cell Biol. 2000;2:137–141. doi: 10.1038/35004008. [DOI] [PubMed] [Google Scholar]
- Xia CH, Roberts EA, Her LS, Liu X, Williams DS, Cleveland DW, Goldstein LS. Abnormal neurofilament transport caused by targeted disruption of neuronal kinesin heavy chain KIF5A. J Cell Biol. 2003;161:55–66. doi: 10.1083/jcb.200301026. [DOI] [PMC free article] [PubMed] [Google Scholar]
- Yabe JT, Pimenta A, Shea TB. Kinesin-mediated transport of neurofilament protein oligomers in growing axons. J Cell Sci. 1999;112:3799–3814. doi: 10.1242/jcs.112.21.3799. [DOI] [PubMed] [Google Scholar]
- Yan Y, Brown A. Neurofilament polymer transport in axons. J Neurosci. 2005;25:7014–7021. doi: 10.1523/JNEUROSCI.2001-05.2005. [DOI] [PMC free article] [PubMed] [Google Scholar]
- Yan Y, Jensen K, Brown A. The polypeptide composition of moving and stationary neurofilaments in cultured sympathetic neurons. Cell Motil Cytoskeleton. 2007;64:299–309. doi: 10.1002/cm.20184. [DOI] [PMC free article] [PubMed] [Google Scholar]
- Yuan A, Nixon RA, Rao MV. Deleting the phosphorylated tail domain of the neurofilament heavy subunit does not alter neurofilament transport rate in vivo. Neurosci Lett. 2006;393:264–268. doi: 10.1016/j.neulet.2005.10.029. [DOI] [PubMed] [Google Scholar]