


Abstract
Proteins that modulate the activity of transcription factors, often called modulators, play a critical role in creating tissue- and context-specific gene expression responses to the signals cells receive. GEM (Gene Expression Modulation) is a probabilistic framework that predicts modulators, their affected targets and mode of action by combining gene expression profiles, protein–protein interactions and transcription factor–target relationships. Using GEM, we correctly predicted a significant number of androgen receptor modulators and observed that most modulators can both act as co-activators and co-repressors for different target genes.
INTRODUCTION
Transcription factors are complex molecular machines that control the expression of tens to hundreds of target genes. At any given time, depending on the context and cellular stimuli, a transcription factor will affect only a subset of its target genes. This specificity is often provided by ‘modulators’, proteins that control transcription factor activity through several different mechanisms, including: posttranslational modifications, protein degradation and non-covalent interactions. Modulators help a cell to combine different external signals and make complex downstream decisions. Elucidating their function is necessary for understanding and controlling cell's response to external stimuli at gene expression level.
Our current knowledge of the modulation of transcription factors comes mainly from experimental studies that measure the expression levels of a few target genes [such as (1) and (2)] or the expression level of an artificial reporter gene with a ‘canonical promoter’ [such as (3)]. While these experiments provide invaluable insight, they do not tell the whole story. In order to detect context-dependent, target-specific effects of modulators, system-scale methods are required. Gene expression profiles are now extensively used for inferring causal relationships between transcription factors and target genes. The models produced from gene expression profiles, often referred as ‘gene regulatory networks’, or simply ‘gene networks’, differ significantly in their semantics and level of detail. Margolin and Califano (4) provide a comprehensive review of these methods and classify them under three groups: linear, graph-theoretic and information-theoretic models. The majority of these methods focus on modeling either causal relationships between gene expression levels as binary interactions or linear integration of expression values.
Expression level of genes can also be affected by non-modulator proteins such as alternative transcription factors, generic inhibitors of transcriptional machinery or regulators of mRNA degradation. A modulator is defined by its dependency on the transcription factor in order to exert its effect on the target. When the transcription factor is not present, at least a part of the modulator activity should be rendered ineffective. This implies a ternary, non-linear relationship, analogous to the electrical transistor, between the activity levels of the two ‘inputs’, the transcription factor and the modulator, and the ‘output’, the target gene expression. Using a sufficiently large set of expression profiles, these relationships can be detected by looking at the correlations between expression levels of candidate modulators with the expression level of a transcription factor and its target genes. Assuming that the expression level is an indicator of modulator and transcription factor activity, the correlation between modulator and target expression must increase as the concentration of the transcription factor increases. Therefore, we expect to observe a transcription factor-dependent correlation between modulator and target.
Wang et al. (5) propose MINDy, an information-theoretic algorithm for detecting modulators. They test the conditional mutual information (CMI) between the transcription factor and the target gene, and its dependency on the modulator candidate. This is, in essence, the aforementioned non-linearity principle. Building upon the same principle, we present GEM (Gene Expression Modulation), a probabilistic method for detecting modulators of transcription factors using a priori knowledge and gene expression profiles. For a modulator/transcription factor/target triplet, GEM predicts how a modulator–factor interaction will affect the expression of the target gene. GEM improves over MINDy by detecting two new classes of interaction that would result in strong correlation but low  CMI, can filter out logical-or cases and offers a more precise classification scheme. A detailed comparison of GEM and MINDy is provided in the discussion.
In the following sections, we explain our method and assumptions and apply GEM to predict modulators of androgen receptor (AR). We compare our results with a recent literature review on modulators of AR and show that GEM correctly predicts a significant number of its modulators and can provide additional insight into the mechanism of modulation and affected targets. We observe that these modulators cannot be easily classified into co-activator/co-repressor categories. Most modulators will selectively increase the expression level of some AR targets while decreasing the others, a property we call bimodality.
An implementation of GEM is freely available through SourceForge (https://sourceforge.net/projects/modulators).
MATERIALS AND METHODS
Method summary
GEM uses three types of input, protein–protein interactions, transcription factor–target relations and gene expression profiles. Proteins that are known to interact with the transcription factor are considered as potential modulators and transcription factor–target binding data are used to obtain a list of target genes for each transcription factor. These two types of interactions are combined to build a large number of small causal hypotheses of the form: ‘Modulator protein M, via transcription factor F affects the expression of the target gene T’. The modulator hypothesis predicts that correlation between the expression levels of the modulator and the target must change as the level of transcription factor changes. We use this dependency as a metric of the interaction between the modulator candidates and the transcription factor to select most likely modulators (Figure 1).
Figure 1.

(A) GEM is based on a simple model of gene regulation. A modulator interacts with a transcription factor to affect the expression of a target. (B) Initial hypotheses are generated by combining known protein–protein and protein–DNA interactions which are then tested against a set of gene expression profiles.
We can estimate this relation with the following model:
| (1) |
where, m, f and t are expression levels of the modulator, transcription factor and target, respectively.  is the expected value of t.
  and
and  represent the effect of m and f, respectively, on t by themselves alone (main effects), while
  represents the effect of their interaction. If f and m interaction has an effect on t, we expect
  to be non-zero.
There is reason to believe that  and
and  can be approximated with linear functions (6). On the other hand, the nature of
  can vary significantly from triplet to triplet, and cannot be covered by a single class of continuous functions. If
  is monotonic, however, we can use a discrete model such as the one described by Wang et al. (5). This allows us to look for non-zero
  components without worrying about the actual mechanism. When we transform the expression values of genes to activity levels 0 and 1, our model becomes:
| (2) |
Given a set of expression profiles, we estimate α coefficients by calculating the observed proportions of  , conditional on
  and
and  . We then select triplets with a high
  coefficient that satisfy a false discovery rate threshold after multiple hypothesis testing correction.
A high alone, however, is not sufficient to infer modulation. Some non-linear relationships, such as ‘logical-or’ of M and F cannot be explained by modulation. To remove these false positives, and to infer the mode of action of the modulator, we classify the non-linear triplets based on their proportion patterns and select those that can be explained by a simple, direct modulation. We report these modulators along with their respective targets and their mode of action.
Construction of triplets
To construct our initial set of hypotheses, in the form of a modulator–factor–target triplet, we combine existing protein-protein and transcription factor–target interactions. Proteins known to interact with a transcription factor, but not targets of the factor themselves, are considered as potential modulators for all targets of the transcription factor. Large integrated protein–protein interaction datasets are already available (7), and known targets of transcription factors can be obtained from literature curation (8,9), sequence-based prediction (8), and ChIP-Chip experiments (10).
Selection of expression data
Using gene expression profiles we can directly measure the level of expression for target genes and estimate activities of M and F from their expression levels. For this estimation to be accurate, expression profiles must satisfy the following two conditions:
There is a steady-state expression level for genes. A change in the expression levels of M and F will be reflected in their protein abundance and expression after a delay. Without steady–state property, we cannot correlate m, f, and t in the same expression profile.
Expression levels of M and F are correlated with their protein abundance. Studies demonstrated that there is a lower correlation between expression levels and protein abundance than expected (11). This correlation, however, increases significantly if the variance of expression values are high.
In addition to these conditions, f and m should have sufficient variance in the expression data set. If one or both genes have relatively constant expression, then this may cause three problems:
A low correlation between mRNA and protein abundance is expected.
There will not be enough ‘perturbation’ in the data set to infer M and F's effect on T.
There is a possibility of detecting fine-tuning feedback loops as modulations.
Ideally, m and f should have high variance and low correlation in the samples.
Gene expression profiles of 2158 human tumor samples published by expO (Expression Project for Oncology) is currently the best publicly available data set for our purposes (http://www.intgen.org/expo.cfm). The variety of tumor samples used in this study increases variation and thus helps reduce correlations between m and f due to the context (Supplementary Data).
Discretization and conditional proportions
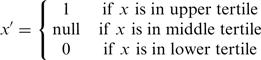
We divide rank-ordered expression values of a gene by tertiles and further discretize the triplets using:
 |
(3) |
This simple strategy has been shown to maximize entropy among groups (12) and is similar to the one used by Wang et al. (5). We also explored more sophisticated (and computationally expensive) strategies including dynamically determining optimal threshold for each triplet that maximizes entropy; however, these did not yield substantial changes in our results.
After discretization, each experiment falls into one of the 27 possible bins based on the ternary state of  ,
,  and
and  (Figure 2A). While calculating the interactions, we only consider the eight bins, where none of the genes has ‘null’ value, covering ∼30% of the experiments. Observed frequencies of these states are denoted by
  .
.
Figure 2.

(A) Samples are ranked and divided into 27 possible bins. Samples with middle values are discarded and frequencies from 8 ‘corner’ bins are used for the rest of the analysis. (B) For each combination of m-f states, proportions of t being high are derived from frequencies. Pairwise differences of proportions provide estimates for  and β values.
We then calculate the proportions of  for each combination of states of
  and
and  :
:
| (4) |
Selection of significant triplets
Observed proportions are conceptually similar to biological experiments.  is our test case, where both f and m are high; thus, an interaction is expected.
  ,
,  and
and  are the controls; here, we do not expect an interaction to occur as at least one of the interacting partners is missing.
By using the differences of observed proportions, we can estimate the  coefficients in Equation (2) (Figure 2B):
| (5) |
| (6) |
| (7) |
We can also estimate the effect of F and M when their interacting partner is present:
| (8) |
| (9) |
Finally,  gives us a metric for the effect of interaction:
| (10) |
Any significant triplet must have a non-zero . This, however, is not sufficient, as a synergistic effect can result from relationships other than direct modulation. For example, consider the case where M and F are two transcription factors competing for the same binding site to activate expression of T. When F is high, there will be low M–T correlation — a non-linear relation that might have significant . Such cases occur when effects of M and F are similar but independent, and there is a cap on the T expression levels due to a third factor, such as the DNA binding site. The nature of such a relationship between M and F is a ‘logical-or’ as opposed to ‘logical-and’ in modulation. Although interesting, we cannot apply our statistical inference in these relationships due to the hidden third factor.
If M is affecting T directly through F, it must be ‘active when F is high’. More formally,  must be significantly different than zero, and must either have a larger absolute value or have a different sign than
  .
.
As a result, all of the following null hypotheses must be rejected for a triplet to be inferred as a direct modulation:
| (11) |
Significance of  and
and  values
 and
and  values are estimated using independent proportions
  ,
,  ,
,  and
and  [Equation (6–9)]. When M and F have no effect on T expression, these proportions will be approximately normally distributed with a mean value of zero. Similarly, the difference between two proportions is approximately normally distributed with a mean value of zero when the change in the condition does not have an effect on T.
The variance of proportion difference  is estimated in Equation (12), where
 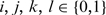 (13).
(13).
| (12) |
| (13) |
| (14) |
| (15) |
Using the variance, we can assess the probability of the measured difference under the null hypothesis:
| (16) |
| (17) |
Significance of
is estimated using proportions as in Equation (10). When the interaction between M and F does not affect T, will be approximately normally distributed with a mean value of zero. Variance of this distribution is estimated in Equation (18). We also verified the accuracy of this estimation by random permutation tests, and found it to be very accurate.
| (18) |
| (19) |
| (20) |
We use Equation (16) for assessing the probability of a measured under the null hypothesis.
Category of action
Using  , GEM classifies unmodulated F activity into three classes: activator, inhibitor and inactive. Similarly, by comparing
  and
and  coefficients, modulators are classified into three classes — they can enhance, attenuate or invert the activity of the transcription factor. There are six possible categories of action. These cases and their interpretations are listed in Table 1 and Figure 3.
Table 1.
Interpretation of the categories of modulation, and the inequality constraints that the category should satisfy
 |
‘ ’ and ‘
 ’ signs in the columns indicate significantly positive and negative values, respectively. Note that this categorization is formulated for triplets for which the null hypotheses in Equation. (11) were also rejected.
Figure 3.

Classification of modulators using proportion differences. a) A triplet can be represented as a vector  . The size of the vector is proportional to
  . b) An example of ‘logical-or case’. c) An example of too small
  . Most of the triplets fall into one of these categories and are filtered out by GEM 1-6) Representative vectors for each category of action in Table 1, using the same color-coding, drawn assuming
  .
.
RESULTS AND DISCUSSION
Inferring modulators of the AR
AR is critical to the development and maintenace of male sexual phenotype and is also implicated as a central component in development of prostate cancer. Heemers et al. (14) provide an extensive list of AR modulators and targets. In the AR literature, modulators are often classified as co-activators or co-repressors. However, the semantics of this binary classification can be ambiguous; for example, ‘Is a modulator that attenuates the inhibitory action of a transcription factor a co-activator or co-repressor?’ Another implicit assumption is that most modulators are unimodal; that is, they have a single type of effect which is either a co-activator or a co-inhibitor for all targets. Heemers et al. list only 12 out of 192 modulators as bimodal. Since for most modulators only a few targets are examined in the literature, we expect to have an observation bias toward unimodality. The extent of this bias, however, is not obvious. To answer these questions, and gain insight to the AR biology, we have applied GEM to infer modulators of AR.
For this experiment, we used the expression data set provided by expO, which contains 2158 profiles from various cancer tissue samples. Target genes were compiled by combining 40 known AR targets in Heemers et al. and 30 AR targets listed in TRED (8). In HPRD (7), 134 proteins were listed as interactors of AR forming the modulator candidate set. We used GEM to detect which of these 134 proteins modulate AR and compared our results with the list provided in Heemers et al.
Since GEM uses a linear causal model, it cannot accurately classify feedback loops. To avoid such cases, we removed genes that are known to be both modulators and targets of AR from our candidate set. Additionally, Heemers et al. showed that AR has a negative feedback effect on many known modulators, but this effect is generally under 2-fold. When we checked our candidate modulators with very low variation, we were able to observe such feedback loops. To filter such cases and make sure that the observed variance in the modulator cannot be solely attributed to feedback regulation, we only used modulator candidates with expression variance higher than 1. This is a strictly empirical threshold based on the findings reported by Heemers et al., and is specific to AR. For other transcription factors with less negative feedback control, or for applications where a less conservative approach is needed, such a filter might not be necessary. A complete listing of candidate modulators, targets and inferred triplets are given in Supplementary Results.
For each modulator, GEM predicts its targets and its category of action. For example, Figure 4 lists the inferred target genes of CAV1 modulation. CAV1 was previously shown to positively regulate AR activity (15) and was associated with prostate cancer and aggressive PSA (KLK3) recurrence. We observe that expression levels of all eight predicted targets were increased in response to CAV1, including PSA. Four of the eight genes have various growth-promoting functions including fatty acid metabolism (ACACB), ketogenesis (HMGCS2) and angiogenesis (AVP and VEGFA). CASP2 and NKX3-1 have, however, tumor suppressor functions and are also upregulated by CAV1. These results show a complicated picture of modulation by CAV1, but are in agreement with previous studies that show both anti-tumor and metastatic functions for CAV1 (16).
Figure 4.

Target genes of the AR detected to be modulated by CAV1. KLK3, also known as PSA, is upregulated as well as four other important tumor growth-related genes.
CAV1 fits in nicely with the co-activator classification in the review by Heemers et al. Most targets of CAV1 fall into ‘Enhances Upregulation’ class and inverting or even attenuating downregulation can be classified as co-activating. Following this observation, we looked at whether the results inferred by GEM agree with the review for the other modulators.
Using a 1% false discovery rate, we identified 47 modulators, covering 33 of the 192 modulators listed in Heemers et al. The 25 modulators with the most targets detected by GEM are listed in Figure 5 along with their classification in Heemers et al. Since we are limiting ourselves to direct modulators, and have a very conservative false discovery rate, this is a quite good recall. On the other hand, we have predicted 14 modulators that were not listed in the review, including two master regulators of AR — EGFR and RUNX1. When we searched the literature for unlisted modulators with the most targets (EGFR, RUNX1, CDC2, CASP1 and MED1), we were able to find supporting evidence for modulation. Recchia et al. (2) demonstrated the cross-talk between EGFR and AR pathways by investigating their effect on CD1 expression. They claim that CD1 expression requires both EGFR and AR activity. Ning et al. (1) identified modulation of mouse Slp by RUNX1 via AR. Moilanen et al. (17) show that CDC2 phosphorylates N-terminal domain of AR, which contains the major transactivation function. Wellington et al. (18) report cleavage of AR by CASP1. Wang et al. (3) detect that MED1 plays an important co-regulatory role in AR-mediated gene expression. These results show that GEM can complement literature reviews and can identify likely modulators from protein interactors of transcription factors. More importantly, GEM can infer target-specific mechanisms for each modulator.
Figure 5.

Top modulators of AR each box contains targets affected by the modulator organized by categories of action and color coded using the same schema as in Table 1. If the modulator is listed in the review by Heemers et al. (14) it is noted next to the name of the modulator. Most modulators have different effects for different targets and do not necessarily follow the classification in the review.
Unlike CAV1, we observe that most modulators are bimodal. Of the top 25, only JUN and PIAS2 are listed as bimodal in Heemers et al. This difference in the frequency of bimodal modulators predicted by our method and those found in the literature supports our supposition that many modulators are classified as co-activators or co-repressors only because they were tested on a restricted set of target genes. We also observe that the number of targets for each modulator varies from 1 to 27. Although the target sets are far from being complete, they are sufficiently large, so we expect the distribution of targets to be representative. Our results show that there is a spectrum of very specific modulators with a few targets to few master regulators that affect a majority of AR targets.
As previously mentioned, GEM requires high variance in expression values. When we do not filter out low variance genes, GEM detects NCOA3 as negative modulator of AR for most of the target genes. NCOA3 is a generic nuclear receptor co-activator whose expression does not change much in the cell. Heemers et al. show that NCOA3 expression is negatively regulated up to 0.5-fold by AR activation. When the expression of a candidate has low variance, such feedback loops can lead to false inference. In the same study, the effect of AR activation on other known modulators including some of the modulators in Figure 5 (DDC, BRCA1, BAG1, CAV1, FLNA, TGFB1I1 and PAK6), were also reported. Since these genes have very high variance in the dataset, however, these feedback effects can only account for a small fraction of the observed expression-level changes.
We performed a second analysis using GEM in all cancer-related transcription factors and their targets in TRED. Using interactors in HPRD as modulator candidates, we identify 435 M–F pairs in the result. These include 57 transcription factors and 295 modulators (Supplementary Results), in which we also observe that the type of modulation depends on the target gene.
Toward complex models of transcriptional regulation
Prevalent model used in literature for describing modulators is a simple co-activator/co-repressor classification system. This implies that the class of the modulator does not change from target to target. A similar assumption is also made implicitly about a transcription factor's effect on its targets. In other words, the ternary relationship of modulator–factor–target is modeled as two independent binary relationships, i.e. ‘activator’ and ‘repressor’ for transcription factors, and ‘co-activator’ and ‘co-repressor’ for modulators.
During the development of GEM, we gradually realized that this two class system was limiting and ambiguous. Many transcription factors are shown to both activate and repress gene expression depending on sequence, chromatin structure and modulators (19,20). It is also well documented that the modulators affect a specific subset of the targets of a transcription factor (21,22), and can reverse their effect based on the target gene (23,24). Several genome-wide studies show that such complicated cases in fact might be very common (25–28). Our findings are in agreement with this complex picture — modulators have almost always target-specific effects and they not only enhance or attenuate the effect of the transcription factor, but can also reverse it.
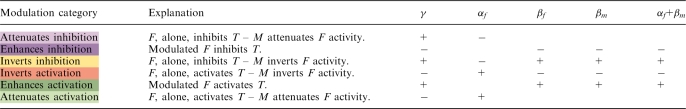
To capture this complexity, GEM provides six different classes of action for each modulator–factor–target triplet. In other words, a modulator–factor pair is described with  labels selected from six classes, where
  is the number of affected targets. This is a significant increase in complexity compared with a two-class model, making comparison of our results with the literature difficult. We, however, believe that it is a step in the right direction as we need more complex models and classification systems to better elucidate how gene expressions are regulated.
Comparison with MINDy
We analyzed the same AR modulation hypotheses using MINDy, and compared with GEM results (Supplementary Data). We observed that GEM offers significant improvements in both detection and classification capabilities.
Both MINDy and GEM infer modulation of transcription factors based on factor-dependent correlations between modulators and targets. MINDy measures the differential conditional mutual information ( CMI) between transcription factor and target in low and high conditions of modulator (M− and M+). Since mutual information is a non-negative measure, however,
  CMI does not differentiate between the negative and positive modes of modulation. This can be a problem when the factor has opposite effects under M− and M+, which results in high mutual information in both cases, and in turn low
  CMI. An example of such a relation is the effect of EGFR on the relation of AR with its target MYLK. GEM detects that AR inhibits MYLK in EGFR−, and activates MYLK in EGFR+. In these cases, statistical significance of
  CMI is weaker than significance of , and is often below the detection threshold.
MINDy treats all signaling proteins as modulator candidates, whereas we propose a much more conservative approach — we use only known interacting proteins. Using known protein interactors has the advantage of producing hypotheses about direct interactions that are immediately testable. There are combinatorially many indirect modulators, and to test them, one has to supply the intermediary molecules to the system. This makes indirect modulators harder to test, especially in vitro. Also, dependency between M and F activity on T can be a result of non-causal relations — if any of the M, F and T genes were replaced with a highly correlated substitute, there would still be a non-linear dependency. When we use a priori interactions to construct our triplets, a substantial amount of indirect and non-causative cases are filtered out. As a trade-off, our method loses some coverage due to missing or incorrect information in the source databases.
Similar to ,  CMI would also detect a ‘logical-or’ relation between M and F. In the case of AR, one-third of our result triplets were classified as ‘logical-or’ and filtered out. Unlike our approach, MINDy would not differentiate ‘logical-or’ from modulation. These relationships can be meaningful in other contexts, such as genetic interactions. They, however, do not fit into the biological description of modulation, where the modulator affects the target through the factor. We believe that there is a value in basing the method on a biological model and fine-tuning assumptions and restrictions based on it, so that the biological interpretation of the results are not ambiguous and they are more testable. To support other biological models (e.g. genetic interactions), we are developing a customizable GEM service where the user can select different a priori data and filtering options.
CONCLUSION
GEM is a method for genome-wide detection of direct modulators of transcription factors. If the modulator is affecting the target via the transcription factor, we expect to observe the level of its effect to depend on the expression level of transcription factor. We have developed a metric for measuring this dependency and applied it to infer the specific set of target genes affected by a given modulator.
We have observed that most modulators affect multiple targets and are bimodal — they do not have a single mode of action but can act as an enhancer or attenuator based on the target. The co-activator and co-inhibitor classifications in the literature reflect a very simplified version of gene regulation as they generalize the effect of a modulator for a single gene or binding site to all targets. GEM provides a much larger scope for picking up likely targets and inferring modulator–target relationships.
It is possible to generalize the triplet model used in GEM to n-tuplets. This is particularly helpful for predicting the expression level of a particular target gene by taking all modulators into account; coupled with experimental studies this approach could provide a powerful framework for investigating mechanisms of gene regulation.
Modulators of transcription factors are potential drug target candidates since they can specifically alter a smaller set of the transcription factor's targets. GEM can help to infer this smaller set and provide the direction of modulation for each target gene allowing researchers to pick targets that can lead to desired outcome with the least amount of side effects.
SUPPLEMENTARY DATA
Supplementary Data are available at NAR Online.
FUNDING
This work was supported by The National Institutes of Health [P41HG004118] and The Scientific and Technological Research Council of Turkey [104E049]. Funding for open access charge: National Institutes of Health (P41HG004118) Scientific and Technological Research Council of Turkey (104E049).
Conflict of interest statement. None declared.
Supplementary Material
ACKNOWLEDGEMENTS
We would like to thank Nadia Anwar, Kimberly Brown Dahlman, Murat Çokol, and Nikolaus Schultz for their comments.
REFERENCES
- 1.Ning YM, Robins DM. AML3/CBFalpha1 is required for androgen-specific activation of the enhancer of the mouse sex-limited protein (Slp) gene. J. Biol. Chem. 1999;275:30624–30630. doi: 10.1074/jbc.274.43.30624. [DOI] [PubMed] [Google Scholar]
- 2.Recchia AG, Musti AM, Lanzino M, Panno ML, Turano E, Zumpano R, Belfiore A, Andò S, Maggiolini M. A cross-talk between the androgen receptor and the epidermal growth factor receptor leads to p38MAPK-dependent activation of mTOR and cyclinD1 expression in prostate and lung cancer cells. Int. J. Biochem. Cell Biol. 2009;41:603–614. doi: 10.1016/j.biocel.2008.07.004. [DOI] [PubMed] [Google Scholar]
- 3.Wang Q, Sharma D, Ren Y, Fondell JD. A coregulatory role for the TRAP-mediator complex in androgen receptor-mediated gene expression. J. Biol. Chem. 2002;277:42852–42858. doi: 10.1074/jbc.M206061200. [DOI] [PubMed] [Google Scholar]
- 4.Margolin AA, Califano A. Theory and limitations of genetic network inference from microarray data. Ann. N. Y. Acad. Sci. 2007;1115:51–72. doi: 10.1196/annals.1407.019. [DOI] [PubMed] [Google Scholar]
- 5.Wang K, Saito M, Bisikirska BC, Alvarez MJ, Lim WK, Rajbhandari P, Shen Q, Nemenman I, Basso K, Margolin AA, et al. Genome-wide identification of post-translational modulators of transcription factor activity in human B cells. Nat.Biotechnol. 2009;27:829–839. doi: 10.1038/nbt.1563. [DOI] [PMC free article] [PubMed] [Google Scholar]
- 6.Chudin E, Walker R, Kosaka A, Wu SX, Rabert D, Chang TK, Kreder DE. Assessment of the relationship between signal intensities and transcript concentration for Affymetrix GeneChip arrays. Genome Biol. 2002;3:RESEARCH0005. doi: 10.1186/gb-2001-3-1-research0005. [DOI] [PMC free article] [PubMed] [Google Scholar]
- 7.Keshava Prasad TS, Goel R, Kandasamy K, Keerthikumar S, Kumar S, Mathivanan S, Telikicherla D, Raju R, Shafreen B, Venugopal A, et al. Human Protein Reference Database–2009 update. Nucleic Acids Res. 2009;37:D767–D772. doi: 10.1093/nar/gkn892. [DOI] [PMC free article] [PubMed] [Google Scholar]
- 8.Jiang C, Xuan Z, Zhao F, Zhang MQ. TRED: a transcriptional regulatory element database, new entries and other development. Nucleic Acids Res. 2007;35:D137–D140. doi: 10.1093/nar/gkl1041. [DOI] [PMC free article] [PubMed] [Google Scholar]
- 9.Matys V, Fricke E, Geffers R, Gössling E, Haubrock M, Hehl R, Hornischer K, Karas D, Kel AE, Kel-Margoulis OV, et al. TRANSFAC: transcriptional regulation, from patterns to profiles. Nucleic Acids Res. 2003;31:374–378. doi: 10.1093/nar/gkg108. [DOI] [PMC free article] [PubMed] [Google Scholar]
- 10.Birney E, Stamatoyannopoulos JA, Dutta A, Guigó R, Gingeras TR, Margulies EH, Weng Z, Snyder M, Dermitzakis ET, Thurman RE, et al. Identification and analysis of functional elements in 1% of the human genome by the ENCODE pilot project. Nature. 2007;447:799–816. doi: 10.1038/nature05874. [DOI] [PMC free article] [PubMed] [Google Scholar]
- 11.Greenbaum D, Colangelo C, Williams K, Gerstein M. Comparing protein abundance and mRNA expression levels on a genomic scale. Genome Biol. 2003;4:117. doi: 10.1186/gb-2003-4-9-117. [DOI] [PMC free article] [PubMed] [Google Scholar]
- 12.Cover TM, Thomas JA. Elements of Information Theory. Wiley Series in Telecommunications and Signal Processing. 2nd edn. Wiley-Interscience: New York; 2006. [Google Scholar]
- 13.Fleiss J. Statistical Methods for Rates and Proportions. 2nd edn. Wiley: New York; 1981. [Google Scholar]
- 14.Heemers HV, Tindall DJ. Androgen receptor (AR) coregulators: a diversity of functions converging on and regulating the AR transcriptional complex. Endocr. Rev. 2007;28:778–808. doi: 10.1210/er.2007-0019. [DOI] [PubMed] [Google Scholar]
- 15.Lu ML, Schneider MC, Zheng Y, Zhang X, Richie JP. Caveolin-1 interacts with androgen receptor. A positive modulator of androgen receptor mediated transactivation. J. Biol. Chem. 2001;276:13442–13451. doi: 10.1074/jbc.M006598200. [DOI] [PubMed] [Google Scholar]
- 16.Felicetti F, Parolini I, Bottero L, Fecchi K, Errico MC, Raggi C, Biffoni M, Spadaro F, Lisanti MP, Sargiacomo M, et al. Caveolin-1 tumor-promoting role in human melanoma. Int. J. Cancer. 2009;125:1514–1522. doi: 10.1002/ijc.24451. [DOI] [PMC free article] [PubMed] [Google Scholar]
- 17.Moilanen AM, Karvonen U, Poukka H, Jänne OA, Palvimo JJ. Activation of androgen receptor function by a novel nuclear protein kinase. Mol. Biol. Cell. 1998;9:2527–2543. doi: 10.1091/mbc.9.9.2527. [DOI] [PMC free article] [PubMed] [Google Scholar]
- 18.Wellington CL, Ellerby LM, Hackam AS, Margolis RL, Trifiro MA, Singaraja R, McCutcheon K, Salvesen GS, Propp SS, Bromm M, et al. Caspase cleavage of gene products associated with triplet expansion disorders generates truncated fragments containing the polyglutamine tract. J. Biol. Chem. 1998;273:9158–9167. doi: 10.1074/jbc.273.15.9158. [DOI] [PubMed] [Google Scholar]
- 19.Dawson SJ, Liu YZ, Rodel B, Moroy T, Latchman DS. The ability of POU family transcription factors to activate or repress gene expression is dependent on the spacing and context of their specific response elements. Biochem. J. 1996;314:439–443. doi: 10.1042/bj3140439. [DOI] [PMC free article] [PubMed] [Google Scholar]
- 20.Shi YB. Dual functions of thyroid hormone receptors in vertebrate development: the roles of histone-modifying cofactor complexes. Thyroid. 2009;19:987–999. doi: 10.1089/thy.2009.0041. [DOI] [PMC free article] [PubMed] [Google Scholar]
- 21.Gonzalez MI, Tovaglieri A, Robins DM. Androgen receptor interactions with Oct-1 and Brn-1 are physically and functionally distinct. Mol. Cell. Endocrinol. 2002;190:39–49. doi: 10.1016/s0303-7207(02)00035-7. [DOI] [PubMed] [Google Scholar]
- 22.Eeckhoute J, Metivier R, Salbert G. Defining specificity of transcription factor regulatory activities. J. Cell. Sci. 2009;122:4027–4034. doi: 10.1242/jcs.054916. [DOI] [PubMed] [Google Scholar]
- 23.McKenna NJ, O'Malley BW. Combinatorial control of gene expression by nuclear receptors and coregulators. Cell. 2002;108:465–474. doi: 10.1016/s0092-8674(02)00641-4. [DOI] [PubMed] [Google Scholar]
- 24.Chahrour M, Jung SY, Shaw C, Zhou X, Wong ST, Qin J, Zoghbi HY. MeCP2, a key contributor to neurological disease, activates and represses transcription. Science. 2008;320:1224–1229. doi: 10.1126/science.1153252. [DOI] [PMC free article] [PubMed] [Google Scholar]
- 25.Remenyi A, Scholer HR, Wilmanns M. Combinatorial control of gene expression. Nat. Struct. Mol. Biol. 2004;11:812–815. doi: 10.1038/nsmb820. [DOI] [PubMed] [Google Scholar]
- 26.Zinzen RP, Girardot C, Gagneur J, Braun M, Furlong EE. Combinatorial binding predicts spatio-temporal cis-regulatory activity. Nature. 2009;462:65–70. doi: 10.1038/nature08531. [DOI] [PubMed] [Google Scholar]
- 27.Ravasi T, Suzuki H, Cannistraci CV, Katayama S, Bajic VB, Tan K, Akalin A, Schmeier S, Kanamori-Katayama M, Bertin N, et al. An atlas of combinatorial transcriptional regulation in mouse and man. Cell. 2010;140:744–752. doi: 10.1016/j.cell.2010.01.044. [DOI] [PMC free article] [PubMed] [Google Scholar]
- 28.Wang Z, Zang C, Cui K, Schones DE, Barski A, Peng W, Zhao K. Genome-wide mapping of HATs and HDACs reveals distinct functions in active and inactive genes. Cell. 2009;138:1019–1031. doi: 10.1016/j.cell.2009.06.049. [DOI] [PMC free article] [PubMed] [Google Scholar]
Associated Data
This section collects any data citations, data availability statements, or supplementary materials included in this article.