

Abstract
Thrombospondin-1 (TSP1) binding to calreticulin (CRT) on the cell surface stimulates association of CRT with LDL receptor-related protein (LRP1) to signal focal adhesion disassembly and engagement of cellular activities. The structural basis for this phenomenon is unknown. We studied the binding thermodynamics of the TSP1–CRT complex and the conformational changes in CRT induced by binding to TSP1 with combined binding free energy analysis, molecular dynamics simulation, and anisotropic network model restrained molecular dynamics simulation. Results showed that mutations of Lys 24 and Lys 32 in TSP1 to Ala and of amino acids 24–26 and 32–34 in CRT to Ala significantly weakened the binding of TSP1 and CRT, which is consistent with experimental results. Upon validation of the calculated binding affinity changes of the TSP1–CRT complex by mutations in key residues in TSP1 and CRT with the experimental results, we performed conformational analyses to understand the role of TSP1 binding to CRT in the induction of conformational changes in CRT. Conformational analyses showed that TSP1 binding to CRT resulted in a more “open” conformation and a significant rotational change for the CRT N-domain with respect to the CRT P-domain, which could expose the potential binding site(s) in CRT for binding to LRP1 to signal focal adhesion disassembly. Results offer structural insight into the role of TSP1 binding to CRT in CRT-induced focal adhesion disassembly.
Interactions of cells with the extracellular matrix are essential for many cellular functions, including growth, differentiation, migration, and survival. Intermediate adhesion is an adaptive state of cell adhesion characterized by restructuring of focal adhesions and stress fibers while a spread cell shape is maintained (1). Studies show that the interaction of the matricellular protein thrombospondin-1 (TSP1)1 with the cell surface protein calreticulin (CRT) enhances binding of CRT to the LDL receptor-related protein complex (LRP1). This interaction promotes signaling that stimulates focal adhesion disassembly, leading to the intermediate adhesive phenotype, cell migration, and also resistance to anoikis (2–7). TSP1 signaling through the CRT–LRP1 complex is thought to be important for cellular responses to injury and tissue remodeling through stimulation of intermediate adhesion, survival, and cell motility. In addition, recent evidence suggests that TSP1 signaling through the CRT–LRP1 complex also promotes extracellular matrix remodeling through stimulation of collagen production (Sweetwyne, Van Duyn, Pallero, Liu, and Murphy-Ullrich, manuscript in preparation).
TSP1, a multifunctional matricellular protein with multiple receptors, has been implicated as a critical regulator of wound healing, fibrosis, angiogenesis, inflammation, tumor cell metastasis, atherosclerosis, hemostasis, and thrombosis (2–4, 8–18). Structurally, TSP1 is a large (420 kDa) disulfide-linked homotrimeric glycoprotein. Each monomer of TSP1 is composed of N- and C-terminal globular domains, which are connected by a rodlike segment (8). The N-terminal domain of TSP1 binds to the cell surface protein CRT, which enhances binding of CRT to LRP1 to form a receptor cocomplex to signal focal adhesion disassembly. The CRT binding site in TSP1 has been localized to amino acids 17–35 (ELTGAARKGSGRRLVKGPD) called hep I peptide, and the two lysine residues in hep I peptide (residues 24 and 32 of the TSP1 N-domain) are critical for hep I peptide binding to CRT (19). The crystal structure of the TSP1 N-domain has been determined (20), providing a basis for structural studies of the interaction of the TSP1 N-domain with CRT, which is important for the regulation of cellular functions.
CRT, a ubiquitous calcium-binding protein, localizes to the endoplasmic reticulum (ER), but also to non-ER compartments, including the cell surface (21). CRT at the cell surface exerts a number of physiological and pathological effects, including the regulation of cell adhesion, cell migration and resistance to anoikis (3, 4, 6, 22, 23), clearance of apoptotic cells (24), inhibition of angiogenesis and suppression of tumor growth (25), and enhancement of wound healing (26). Structurally, CRT has three domains: a globular β-sandwich N-domain, a proline-rich β-hairpin P-domain, and a calcium-binding C-domain (27). The P-domain of CRT extends from the N-domain in a spiral-like conformation, although the overall conformation of the P-domain indicates a certain flexibility (28, 29). The conformational plasticity of the P-domain has been established, indicating that the P-domain of CRT is able to adapt distinct conformations dependent upon its interactions with other proteins (27). A three-dimensional structural model of CRT has been constructed on the basis of the crystal structure of calnexin (30) and the NMR structure of the P-domain of CRT (28). This model has been consistent with experimental findings, particularly with respect to the role of His 153 in protein folding (31). The N-terminal domain of the cell surface protein CRT interacts with the TSP1 N-domain to signal intermediate adhesion (2, 3). Specifically, the CRT binding site for TSP1 is an 18-residue sequence (CRT19.36, RWIESKHKSDFGKFVLSS) in the N-terminal domain of CRT (3). The cluster of basic amino acids 24–26 and amino acids 32–34 in CRT are critical for TSP1 binding and function (6).
Molecular dynamics (MD) simulations have been extensively used to study the protein structure and dynamics. To overcome the potential time scale limitation of the MD simulations, the anisotropic network model (ANM) that uses a reduced description of protein structure consisting of only the α-carbon for each residue (32, 33) is able to analyze protein conformational changes over a long time scale (33–39). Combining the strengths of MD simulation with atomic details and ANM for long time scale simulation, ANM restrained MD simulations were adopted for the evaluation of the protein conformational changes (40).
In this study, we constructed a validated TSP1 –CRT complex and, using combined protein docking, molecular dynamics (MD) simulations, and binding free energy calculations, assessed the conformational changes in CRT induced by binding to TSP1 using both MD simulations and anisotropic network model restrained MD simulations. Results from this study offered structural insight into the role of TSP1 binding to CRT in formation of the CRT-induced signaling cocomplex for focal adhesion disassembly.
MATERIALS AND METHODS
Construction of the TSP1–CRT Complex
On the basis of the structures of the N-domain of TSP1 [Protein Data Bank (PDB) entry 1Z78] (20) and the N-domain, P-domain, and partial C-domain of CRT (31), the experimentally known binding sites between TSP1 and CRT (residues 17–35 in TSP1 and residues 19–36 in CRT) (2, 3, 19), and the key residues in TSP1 required for TSP1–CRT binding (Lys 24 and Lys 32 in TSP1) (19) as restraints (Figure 1S of the Supporting Information), we constructed the TSP1–CRT complex using combined protein docking, MD simulations, and binding free energy calculations. The constructed complex was functionally validated with the results from biochemical experiments. The protocol for predicting the structure of the TSP1–CRT complex is shown in Figure 1. Rigid docking in combination with rescoring and refinement has previously been shown to improve protein docking performance (41, 42). In this study, we adopted two pathways in parallel for construction of the protein complex (Figure 1). Both pathways use the same rigid docking program ZDOCK, the performance of which has been proven in the critical assessment of prediction of interactions (CAPRI) challenge (43), but use a different refinement and rescoring program. The first pathway used for the TSP1–CRT complex prediction combined ZDOCK and the refining program RDOCK. The combined ZDOCK/RDOCK programs have demonstrated their performance in CAPRI for protein docking (42, 43) and by satisfactory results from molecular dynamics (MD) simulations using the predicted protein complexes (44–46). The second pathway for TSP1–CRT complex prediction utilized a combination of the rigid docking program ZDOCK, the ranking program ZRANK (47), and the structural refining program Rosetta-Dock (48), which has previously been shown to significantly improve protein docking performance (41). Detailed protocols for two complex construction pathways and the identification of a functionally validated TSP1–CRT complex are described in the Supporting Information.
Figure 1.
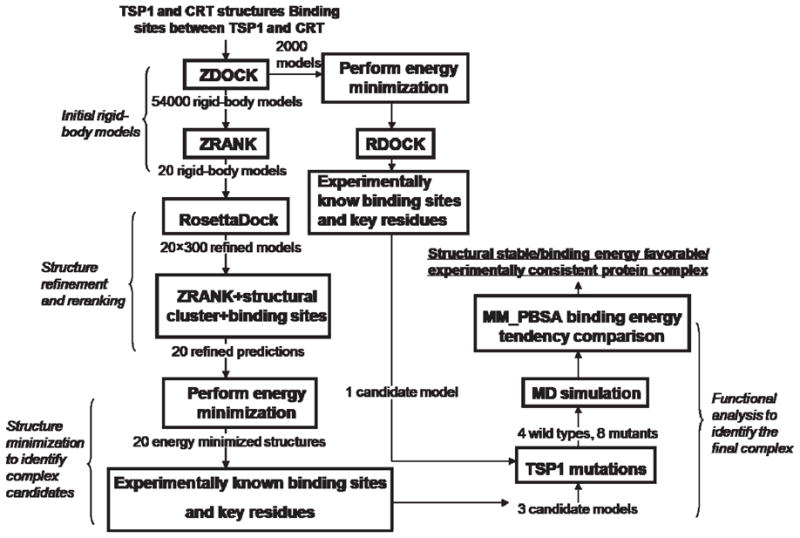
Protocol for TSP1–CRT complex prediction.
Molecular Dynamics Simulations
In addition to identifying a functionally validated TSP1–CRT complex from protein docking and binding free energy analyses, we also performed four 30 ns MD simulations (Table 1) to examine the effects of the mutations in TSP1 and CRT on TSP1 –CRT binding free energy and to investigate the conformational changes in CRT induced by binding to TSP1. We used the AMBER 9 MD package (49) for the MD simulations. The MD simulations were performed in a periodic box (the size of the box depends on the simulated system). One nanometer of solvent between the protein and the box boundaries was ensured to reduce potential artifacts arising from periodicity. The periodic box was filled with TIP3P water molecules (50) and 150 mM NaCl (physiological salt concentration). Additional ions of Na+ or Cl− were added to the system to neutralize the charge of the protein complex. The AMBER force field was used for the simulated systems in combination with a standard MD simulation protocol similar to that of our previous studies (51–53). Briefly, the MD simulation protocol included (1) steepest descent minimization for the solvent with the protein and ions restrained but with water mobile, (2) equilibration of water with mobile water molecules but with the protein and ions restrained at constant number–pressure–temperature (NpT) at 50 K and 1 atm for 20 ps, (3) the warm-up of the system via a series of 10 ps constant number–volume–temperature (NVT) MD simulations at 50, 100, 150, 200, 250, and 300 K with SHAKE constraints and 2 fs time steps, and (4) production simulation at NpT of 300 K and 1 atm for the assigned time length of either 10 or 30 ns in this study. In the production simulations, SHAKE constraints with a relative tolerance of 1 × 10⁻⁵ were used on all hydrogen–heavy atom bonds to permit a dynamics time step of 2 fs. Electrostatic interactions were calculated by the particle mesh Ewald (PME) method (54). The Lennard-Jones cutoffs were set at 1.0 nm. The root-mean-square deviation (RMSD) and binding free energy of each complex were calculated over time to ensure that the system reached equilibration during the MD simulations. The simulation trajectories after the initial equilibration were used for the binding free energy and conformational analyses.
Table 1.
Four Systems for 30 ns MD Simulations
| system | CRT | TSP1–CRT complex |
|---|---|---|
| 1 | CRT wild type (WT) | |
| 2 | TSP1 WT–CRT WT | |
| 3 | TSP1 mutant–CRT WT | |
| 4 | TSP1 WT–CRT mutant |
Binding Free Energy Calculations
To identify a functionally validated TSP1 –CRT complex from the four potential complexes predicted from protein docking, to understand the effect of TSP1 and CRT mutations on the binding affinity of the TSP1–CRT complex, and to validate the constructed TSP1–CRT complex, we calculated the change in binding free energy of the predicted TSP1 –CRT complex caused by mutations in TSP1 and CRT and compared these results to experimental results (2, 6, 19). With a series of snapshots obtained from the trajectories of the MD simulations, the binding free energies for the predicted TSP1–CRT complex and mutants were calculated by the molecular mechanics Poisson–Boltzmann surface area (MM-PBSA) method (55–59). The MM-PBSA method combines molecular mechanics, Poisson–Boltzmann electrostatics for polar solvation free energy, apolar solvation energy based on solvent-accessible surface area, and normal-mode analyses for entropy to calculate the binding free energy for the protein complexes. Details for the calculations of binding free energy of the TSP1–CRT complex with the MM-PBSA method are detailed in the Supporting Information.
Anisotropic Network Model (ANM) Restrained MD Simulation
To overcome the potential time scale limitation of the 30 ns MD simulation for modeling TSP1–CRT interactions and CRT conformational changes caused by binding to TSP1, we also utilized ANM restrained MD simulations (40) to study CRT and the TSP1 –CRT complex. ANM restrained MD simulations were used to further elucidate the conformational changes in CRT caused by binding to TSP1 and to validate the simulation results from 30 ns MD simulations. Functionally important conformational transitions can often be represented by a few of the lowest-frequency normal modes, which describe simplified protein motion that may not be observed by MD simulations at nanosecond time scales (60). The anisotropic network model (ANM), using a reduced description of protein structure consisting of only the α-carbon for each residue (32, 33), calculates the normal modes of motion of the protein. ANM computes the potential motion of proteins on the basis of only the static structure and thus does not involve dynamics, which are important for protein interactions. ANM restrained MD (40), which uses the deformations derived from ANM analysis as restraints in MD simulations, determines the conformational change of the protein over a long time scale. Therefore, this combined method could overcome the time scale limitation for traditional MD simulations and incorporate the effects of explicit residues and interaction with solvents at an atomic level that the ANM method loses in its analysis. The protocol for anisotropic network model (ANM) restrained MD simulation is detailed in the Supporting Information.
The MD simulations, binding free energy calculations, and ANM restrained MD simulations were performed on a local DELL infiniband Xeon cluster, a local Bluegene cluster, and the clusters in the Alabama Supercomputer Center.
Conformational Analyses
After validation of the constructed TSP1–CRT complex by a comparison of calculated and experimental changes in binding free energy caused by mutations in key residues in TSP1 and CRT, we performed conformational analyses to understand the role of TSP1 binding to CRT in induction of conformational changes in CRT using the MD simulation trajectory. We calculated the root-mean-square fluctuations (RMSFs) of CRT before and after it binds to TSP1 on a residue-by-residue basis by averaging over the production trajectories after the initial equilibration. In addition to RMSF analyses, we also analyzed the dynamical cross-correlation map between the residues of CRT. Through this analysis, we investigated the degree of correlated motion between residues in the protein, the distance matrix between the residues of CRT, and the relative orientation angle between the CRT N- and P-domains to assess changes in the conformation of CRT caused by binding to TSP1. To confirm that the conformational analysis results from the 30 ns MD simulation were not limited by the time scale of MD simulations, we analyzed the conformational change in CRT by binding to TSP1 based on the ANM–MD simulations and compared the results with those from the MD simulations.
Statistical Methods
To determine the effect of TSP1 mutations and CRT mutations on TSP1–CRT binding and CRT conformational changes induced by binding to TSP1, we calculated the means and standard deviations of the analyzed variables. Adjacent snapshots from the MD trajectories tend to be correlated with one another. The autocorrelation time τ for the calculated variables was calculated as in a previous study (61), which was determined on the basis of the system RMSD. With a decorrelation time of 2τ, we used bootstrap analyses (62), with a protocol similar to that of Chen and Pappu (63), to resample the frames of the simulation trajectories into statistically independent samples to calculate the standard deviations of the interested variables and ensure statistical independence (61). Each newly generated sample data set was used to calculate the averages for the variables in which we were interested, and the average for each resampled data set was used for the calculation of the standard deviation. Significant differences in the mean and standard deviations for the variables in which we were interested were determined using the Student’s t test (64) with 95% confidence.
RESULTS AND DISCUSSION
Identification of the Final TSP1–CRT Binding Mode from the Four Potential Binding Modes of the TSP1–CRT Complex
Four binding modes for the TSP1–CRT complex were predicted with two protein docking pathways (Figure 2S of the Supporting Information). To further identify the final TSP1–CRT binding mode, the functionally important roles of TSP1 residue 32 alone and residues 24 and 32 together in TSP1–CRT binding free energy were used as the scoring criterion.
The root-mean-square deviation (RMSD) of the TSP1 N-domain and the CRT N-domain and the partial C-domain of the TSP1–CRT complexes over the 10 ns MD simulations showed that the system reached the initial equilibration after 5 ns of MD simulations (Figure 3S of the Supporting Information). The CRT P-domain is a highly flexible region, so the RMSD of the CRT P-domain was not used for the evaluation of the initial equilibration of the system. The binding free energies of the four predicted TSP1–CRT complexes and their eight mutants (K32A mutation alone and K24A and K32A mutations together for each of the predicted complexes) over the 10 ns MD simulations, which were calculated as the ensemble-averaged value over the MD simulation trajectories, converged after 5 ns of MD simulations (Figure 4S of the Supporting Information). MD simulation trajectories from 5 to 10 ns were used for binding free energy calculations. The calculated binding free energy results for the four predicted TSP1–CRT complexes and their eight mutants included the mean value and the standard deviation obtained with the bootstrap statistical analysis method (Table 1S of the Supporting Information). Experimental studies previously showed that mutation of Lys 24 and Lys 32 of the TSP1 hep I peptide (residues 17–35) to Ala resulted in the loss of the ability of the peptide to inhibit formation of the TSP1–CRT complex (2). Furthermore, residue 32 is required for binding of TSP1 to CRT to signal focal adhesion disassembly (19). The calculated changes in the binding free energy of the TSP1–CRT complex caused by the single TSP1 K32A mutation and by the double TSP1 K24A and K32A mutations for binding modes 1 and 4 were consistent with previous biochemical studies (Table 1S of the Supporting Information). However, for complex mode 4, the binding of the wild-type TSP1–CRT complex is quite weak, which was not consistent with the experimental results. Thus, complex mode 1 was identified as the predicted TSP1–CRT complex (Figure 2S of the Supporting Information).
Binding Thermodynamics Analysis for the Identified TSP1–CRT Complex and Its Mutants
In addition to the critical roles of residues 24 and 32 in TSP1 for TSP1–CRT binding (2, 19), residues 24–26 and 32–34 of CRT are also critical for TSP1–CRT binding (6). To validate the constructed TSP1–CRT complex, we calculated the binding free energy for the wild-type TSP1–CRT complex, the TSP1 K24A/K32A mutant–CRT complex, and the TSP1–CRT mutant complex with residues 24–26 and 32–34 of CRT mutated to Ala, based on the 30 ns MD simulation trajectories. The RMSD of the TSP1 protein and the CRT N-domain and partial C-domain showed that all simulations reached the initial equilibration after 15 ns of MD simulations (Figure 2). The binding free energy over the 30 ns MD simulations of the three complex systems also showed system convergence after 15 ns (Figure 3). Therefore, the last 15 ns of the MD trajectories for the three systems was used to calculate the binding free energy, including the mean value and standard deviation (Table 2). The calculated results showed that the K24A and K32A mutations in TSP1 resulted in the binding free energy changing from −10.58 ± 1.52 to −0.66 ± 1.64 kcal/mol, almost abolishing TSP1–CRT binding, which was qualitatively consistent with the experimental observation (2, 19). The calculated results also showed that the mutation of residues 24–26 and 32–34 of CRT to Ala significantly decreased the binding free energy of the TSP1–CRT complex from −10.58 ± 1.52 to −7.43 ± 1.98 kcal/mol, which was also qualitatively consistent with the experimental observation (6).
Figure 2.

(A) RMSD for the TSP1 N-domain in TSP1–CRT complexes over the 30 ns MD simulation. (B) RMSD for the CRT N-domain and the partial C-domain in TSP1–CRT complexes over the 30 ns MD simulation.
Figure 3.
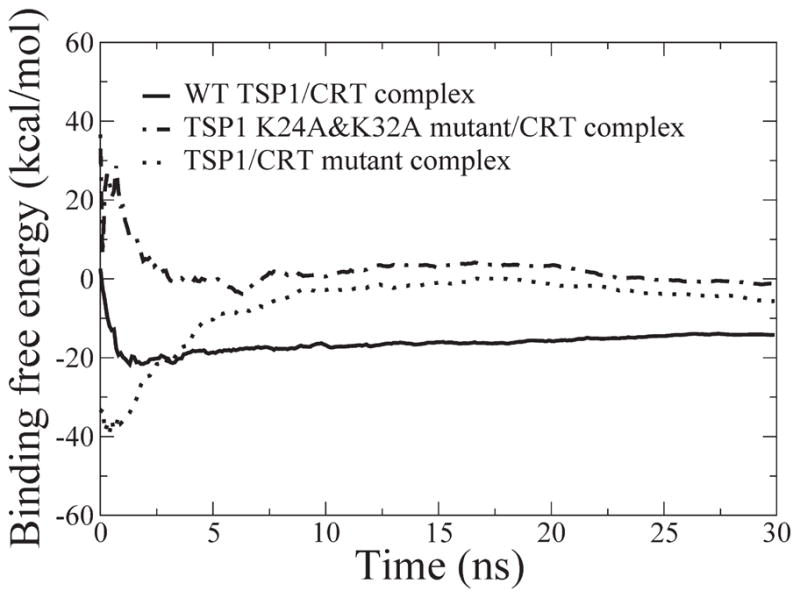
Binding free energy over the 30 ns MD simulations for the constructed TSP1–CRT complex and the mutant complex.
Table 2.
Calculated Binding Free Energies for the TSP1–CRT Complex and Its Mutantsa
| TSP1 WT–CRT complex | TSP1 mutant–CRT complex | TSP1–CRT mutant complex | |
|---|---|---|---|
| ΔEelec | −816.36 ± 7.78 | −398.22 ± 9.77 | −922.18 ± 9.80 |
| ΔEvdw | −66.98 ± 1.44 | −98.51 ± 1.11 | −88.41 ± 1.37 |
| ΔGSA | −9.49 ± 0.16 | −13.41 ± 0.13 | −11.66 ± 0.09 |
| ΔGPB | 839.63 ± 8.11 | 455.33 ± 9.30 | 963.48 ± 10.80 |
| TΔS | −42.62 ± 1.16 | −54.15 ± 1.33 | −51.34 ± 0.86 |
| ΔGcalc | −10.58 ± 1.52 | −0.66 ± 1.64 | −7.43 ± 1.98 |
| ΔΔGcalc | 9.92b | 3.15b | |
| results from biochemical studies (2, 6, 19) | strong | abolished binding (2, 19) | weakened binding (6) |
All values in this table have units of kilocalories per mole. ΔEelec is the electrostatic energy, ΔEvdw the van der Waals energy, ΔGSA the nonpolar solvation energy, ΔGPB the polar solvation energy, TΔS the solute entropy, ΔGcalc the binding free energy of the complex, and ΔΔGcalc the relative binding free energy with respect to the wild-type TSP1–CRT complex.
Differences that are statistically significant (Student’s t test; p < 0.05).
Analysis of the energy components shown in Table 2 showed that TSP1 mutations and CRT mutations resulted in a change in the electrostatic energy of the complex from −816.36 ± 7.78 kcal/mol for the wild type to −398.22 ± 9.77 kcal/mol with TSP1 mutations and −922.18 ± 9.80 kcal/mol with CRT mutations, the change in the van der Waals energy from −66.98 ± 1.44 kcal/mol for the wild type to −98.51 ± 1.11 kcal/mol with TSP1 mutations and −88.41 ± 1.37 with CRT mutations, the change in the polar solvation energy from 839.63 ± 8.11 kcal/mol for the wild type to 455.33 ± 9.30 kcal/mol with TSP1 mutations and 963.48 ± 10.80 kcal/mol with CRT mutations, and the change in the entropy of the protein from −42.62 ± 1.16 kcal/mol for the wild type to −54.15 ± 1.33 kcal/mol with TSP1 mutations and −51.34 ± 0.86 kcal/mol with CRT mutations. These results showed that the electrostatic energy, van der Waals energy, polar solvation energy, and entropy of the TSP1–CRT complex were all significantly changed by the TSP1 mutations or CRT mutations. Both the charge changes in the TSP1–CRT protein complex and the conformational changes in TSP1 and CRT could affect the changes in the electrostatic energy, van der Waals energy, and polar solvation energy, and the conformational changes in TSP1 and CRT could directly contribute to the entropy changes.
Conformational Changes in CRT Induced by Binding to TSP1 in MD Simulations
CRT alone and CRT in TSP1–CRT complexes exhibited initial equilibration after 15 ns of MD simulation (Figure 2 and Figure 5S of the Supporting Information). Therefore, the last 15 ns of MD simulation trajectories was used for the conformational analyses. The RMSF of both CRT alone and CRT in the TSP1–CRT complex showed that most of the residues of CRT in the TSP1–CRT complex were more stable than those in unbound CRT (Figure 4A), including the residues in and adjacent to the CRT binding site for TSP1. Dynamical cross-correlation maps that investigated the degree of correlated motion between residues in the protein provided further insight into the effect of TSP1 binding to CRT on CRT conformational changes (Figure 4B). The top left half of Figure 4B shows the cross-correlation map of CRT in the TSP1–CRT complex, while the bottom right half shows the map for CRT alone. With TSP1 bound to CRT, an increased degree of correlated motion between residues in the CRT N-domain (residues 1–180) (red) and an increased degree of anticorrelated motion between residues in the CRT N-domain and the CRT P-domain (blue) were observed when compared to CRT alone. The distance matrix was calculated for the average distance between the residues in CRT over the last 15 ns of MD simulations (Figure 4C). The top left half of Figure 4C shows the distance matrix for CRT in the TSP1–CRT complex, and the bottom right half shows the distance matrix for CRT alone. TSP1 binding to CRT resulted in a significantly increased distance between the partial CRT P-domain (amino acids 200–270) and the CRT N-domain (amino acids 1–180), as shown by the increased degree of red patch in Figure 4C. This observation was supported by results from the dynamical cross-correlation map showing that TSP1 binding to CRT resulted in an increased degree of anticorrelated motion between residues in the CRT N-domain and P-domain (Figure 4B). These results suggested that TSP1 binding to CRT results in a more “open” conformational configuration between the CRT N- and P-domains compared to CRT alone.
Figure 4.

(A) RMSF comparison of CRT N- and P-domains for CRT alone and CRT in the TSP1–CRT complex. (B) Dynamical cross-correlation maps for the degree of correlated motion of the residues in CRT alone (bottom right) and CRT in the TSP1–CRT complex (top left). (C) Distance matrix for CRT alone (bottom right) and CRT in the TSP1–CRT complex (top left).
In addition to a more open conformation between the CRT N- and P-domains resulting from CRT binding to TSP1, a significantly changed angle for the CRT N-domain relative to the CRT P-domain was also observed (Figure 5). The angle between the CRT N- and P-domains was defined to be the angle of one vector formed by residues 129 and 145 in the CRT N-domain relative to one plane formed by residues 190, 210, and 240 in the CRT P-domain (Figure 5A). TSP1 binding to CRT resulted in a change in the orientation angle of the CRT N-domain relative to the P-domain from 110.4 ± 4.6° to 77.6 ± 3.1° (Figure 5B). The significantly changed rotational angle and the more open conformation of the CRT N-domain relative to the P-domain might expose additional residues important for CRT recruitment of LRP1 to form a ternary signaling cocomplex. Therefore, these observations provide structural and molecular insight regarding the experimental observation that TSP1 binding to CRT enhances binding of CRT to LRP1 to signal cellular activities (2–7).
Figure 5.

(A) Definition of the angle for the CRT N-domain with respect to the CRT P-domain. The vector formed by residues 129 and 145 in the CRT N-domain relative to the plane formed by residues 190, 210, and 240 in the CRT P-domain. (B) Angle between the CRT N- and P-domains for CRT alone and CRT in the TSP1–CRT complex.
Conformational Changes in CRT Induced by Binding to TSP1 in ANM Restrained MD Simulations
To verify that 30 ns MD simulations of CRT and the TSP1–CRT complex were able to capture the conformational characteristics of CRT binding to TSP1, we performed ANM restrained MD simulations for CRT alone and the TSP1–CRT complex. On the basis of the eigenvalue distribution and degree of collectivity from ANM analyses (Figure 6S, Table 2S, and Table 3S of the Supporting Information), we selected two modes in the first cycle for ANM restrained MD simulations. With the final structure from the ANM restrained MD simulations in the first cycle, the first two modes from ANM analysis were chosen for the second loop to perform ANM restrained MD simulations, based on the eigenvalue distribution and degree of collectivity (Figure 6S of the Supporting Information). This procedure was repeated for the third cycle until the RMSD of the CRT backbone, using the starting structure as a reference, reached 6 Å (Figure 6). Figure 6 shows the RMSD of backbone Cα atoms from the initial structure of both the single CRT and CRT in the TSP1–CRT complex and the corresponding energy change. The black (minus) and red (plus) curves represented two equally possible directions. On the basis of the mode selection criteria, the two lowest modes were chosen to perform in one cycle. After one mode, a short energy minimization was performed. The structure that had the lower energy was used as the starting structure in the next mode. After the calculation of three cycles, the conformation departs from the very initial structure by a RMSD of 6 Å. The comparison of the final structures of CRT alone and CRT in the TSP1–CRT complex showed a more open conformation between the CRT N- and P-domains when CRT was bound to TSP1 (Figure 7). This observation was further supported by the distance matrix for the final structure of CRT alone (bottom right half) and CRT in the TSP1–CRT complex (top left half) (Figure 7S of the Supporting Information). The distance matrix shows that TSP1 binding to CRT resulted in an increased distance between the partial CRT P-domain (residues 200–270) and the CRT N-domain, which was shown by the increase in red patches (Figure 7S of the Supporting Information). These observations were consistent with the results from 30 ns MD simulations, validating the conformational analysis results from 30 ns MD simulations for CRT alone and the TSP1–CRT complex.
Figure 6.

RMSD of backbone Cα atoms and energy of CRT in ANM–MD simulations. (A) Single CRT. (B) TSP1–CRT complex. The black (minus) and red (plus) curves represent two equally possible directions.
Figure 7.
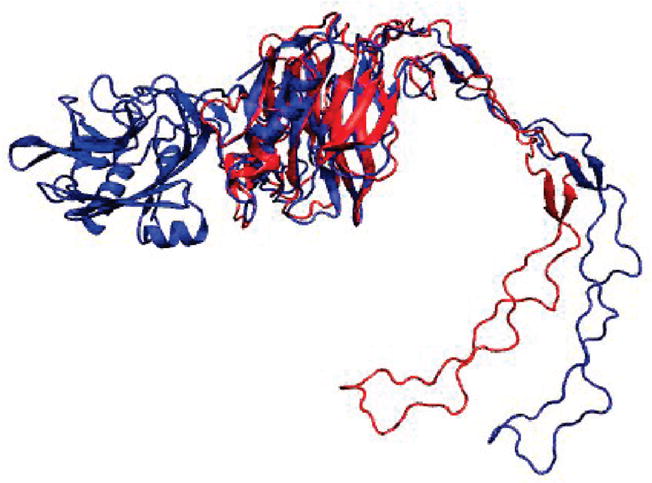
Supposition of the final structure of CRT alone (red) and the structure of the TSP1–CRT complex (blue) after ANM restrained MD simulations.
CONCLUSIONS
In this study, we constructed a functionally validated TSP1–CRT complex and assessed the conformational changes in CRT induced by binding to TSP1. The results demonstrate that mutation of Lys 24 and Lys 32 in TSP1 to Ala and of amino acids 24–26 and 32–34 in CRT to Ala significantly weakened the binding of TSP1 and CRT, consistent with experimental results. TSP1 binding to CRT resulted in amore open conformation and a significantly changed rotational angle for the CRT N-domain with respect to the CRT P-domain. These changes could expose the potential binding site(s) in CRT for the recruitment of LRP1 to form a ternary signaling cocomplex. Conformational changes in CRT when it binds to TSP1 offered structural insights into experimental observations about the role of binding of TSP1 to CRT in the stimulation of association of CRT with LRP1 to signal focal adhesion disassembly, cell migration, and resistance to anoikis. The binding site of LRP1 in CRT is still unknown. Understanding the conformational change characteristics of CRT via its binding to TSP1 could help to identify the potential binding site(s) of LRP1 in CRT in the future. Results from this study about the conformational characteristics of CRT in its binding to TSP1 may also provide a structural basis for the identification of novel strategies and potentially effective ligands for regulation of the conformation of CRT and thereby its induced cellular activities, including extracellular matrix remodeling and cellular responses to injury in tissue repair and cardiovascular diseases. Physiologic levels of calcium and zinc are known to enhance TSP1–CRT binding (3). The constructed TSP1–CRT complex in this study also provides a basis for further investigation of the binding of Zn2+ or Ca2+ to CRT and its effect on CRT conformation and TSP1–CRT binding.
Supplementary Material
Acknowledgments
We acknowledge Dr. Marek Michalak for providing the PDB file of calreticulin.
Footnotes
This work was supported by TeraGrid supercomputer allocation (National Science Foundation Grant MCB090009) to Y.S. and National Institutes of Health Grant HL79644 to J.E.M.-U.
Abbreviations: TSP1, thrombospondin-1; CRT, calreticulin; LRP1, LDL receptor-related protein complex; MD, molecular dynamics; PME, particle mesh Ewald; MM-PBSA, molecular mechanics Poisson–Boltzmann surface area; ANM, anisotropic network model; RMSD, root-mean-square deviation; RMSF, root-mean-square fluctuation; CAPRI, critical assessment of prediction of interactions.
SUPPORTING INFORMATION AVAILABLE
The detailed protocols for two complex construction pathways and the identification of a functionally validated TSP1–CRT complex, the MM-PBSA method, and the protocol for anisotropic network model (ANM) restrained MD simulation are described in detail. Binding restraints for construction of the TSP1–CRT complex are shown in Figure 1S. Four potential binding modes for the TSP1–CRT complex were predicted with two protein docking pathways (Figure 2S and Table 1S). The RMSD of TSP1 and CRT and the binding free energy of the predicted TSP1–CRT complexes and their mutant over the MD simulations showed that that the system reached the initial equilibration after 5 ns of MD simulations (Figures 3S and 4S). CRT alone exhibited initial equilibration after 15 ns of MD simulation (Figure 5S). We performed ANM analyses to obtain the eigenvalue distribution and degree of collectivity for CRT alone and CRT in complex (Figure 6S, Table 2S, and Table 3S). The distance matrix for the final structure of CRT alone (bottom right half) and CRT in the TSP1–CRT complex (top left half) based on ANM analyses showed a more open conformation between the CRT N- and P-domains when CRT was bound to TSP1 (Figure 7S). The PDB file of the constructed TSP1–CRT complex is available upon request. This material is available free of charge via the Internet at http://pubs.acs.org.
References
- 1.Murphy-Ullrich JE. The de-adhesive activity of matricellular proteins: Is intermediate cell adhesion an adaptive state? J Clin Invest. 2001;107:785–790. doi: 10.1172/JCI12609. [DOI] [PMC free article] [PubMed] [Google Scholar]
- 2.Goicoechea S, Orr AW, Pallero MA, Eggleton P, Murphy-Ullrich JE. Thrombospondin mediates focal adhesion disassembly through interactions with cell surface calreticulin. J Biol Chem. 2000;275:36358–36368. doi: 10.1074/jbc.M005951200. [DOI] [PubMed] [Google Scholar]
- 3.Goicoechea S, Pallero MA, Eggleton P, Michalak M, Murphy-Ullrich JE. The anti-adhesive activity of thrombospondin is mediated by the N-terminal domain of cell surface calreticulin. J Biol Chem. 2002;277:37219–37228. doi: 10.1074/jbc.M202200200. [DOI] [PubMed] [Google Scholar]
- 4.Orr AW, Elzie CA, Kucik DF, Murphy-Ullrich JE. Thrombospondin signaling through the calreticulin/LDL receptor-related protein co-complex stimulates random and directed cell migration. J Cell Sci. 2003;116:2917–2927. doi: 10.1242/jcs.00600. [DOI] [PubMed] [Google Scholar]
- 5.Orr AW, Pedraza CE, Pallero MA, Elzie CA, Goicoechea S, Strickland DK, Murphy-Ullrich JE. Low density lipoprotein receptor-related protein is a calreticulin coreceptor that signals focal adhesion disassembly. J Cell Biol. 2003;161:1179–1189. doi: 10.1083/jcb.200302069. [DOI] [PMC free article] [PubMed] [Google Scholar]
- 6.Pallero MA, Elzie CA, Chen J, Mosher DF, Murphy-Ullrich JE. Thrombospondin 1 binding to calreticulin-LRP1 signals resistance to anoikis. FASEB J. 2008;22:3968–3979. doi: 10.1096/fj.07-104802. [DOI] [PMC free article] [PubMed] [Google Scholar]
- 7.Elzie CA, Murphy-Ullrich JE. The N-terminus of thrombospondin: The domain stands apart. Int J Biochem Cell Biol. 2004;36:1090–1101. doi: 10.1016/j.biocel.2003.12.012. [DOI] [PubMed] [Google Scholar]
- 8.Adams JC, Lawler J. The thrombospondins. Int J Biochem Cell Biol. 2004;36:961–968. doi: 10.1016/j.biocel.2004.01.004. [DOI] [PMC free article] [PubMed] [Google Scholar]
- 9.Chen H, Herndon ME, Lawler J. The cell biology of thrombospondin-1. Matrix Biol. 2000;19:597–614. doi: 10.1016/s0945-053x(00)00107-4. [DOI] [PubMed] [Google Scholar]
- 10.Lahav J. The functions of thrombospondin and its involvement in physiology and pathophysiology. Biochim Biophys Acta. 1993;1182:1–14. doi: 10.1016/0925-4439(93)90146-r. [DOI] [PubMed] [Google Scholar]
- 11.Asch AS, Tepler J, Silbiger S, Nachman RL. Cellular attachment to thrombospondin. Cooperative interactions between receptor systems. J Biol Chem. 1991;266:1740–1745. [PubMed] [Google Scholar]
- 12.Frazier WA. Thrombospondins. Curr Opin Cell Biol. 1991;3:792–799. doi: 10.1016/0955-0674(91)90052-z. [DOI] [PubMed] [Google Scholar]
- 13.Botney MD, Kaiser LR, Cooper JD, Mecham RP, Parghi D, Roby J, Parks WC. Extracellular matrix protein gene expression in atherosclerotic hypertensive pulmonary arteries. Am J Pathol. 1992;140:357–364. [PMC free article] [PubMed] [Google Scholar]
- 14.Chen D, Asahara T, Krasinski K, Witzenbichler B, Yang J, Magner M, Kearney M, Frazier WA, Isner JM, Andres V. Antibody blockade of thrombospondin accelerates reendothelialization and reduces neointima formation in balloon-injured rat carotid artery. Circulation. 1999;100:849–854. doi: 10.1161/01.cir.100.8.849. [DOI] [PubMed] [Google Scholar]
- 15.Raugi GJ, Mullen JS, Bark DH, Okada T, Mayberg MR. Thrombospondin deposition in rat carotid artery injury. Am J Pathol. 1990;137:179–185. [PMC free article] [PubMed] [Google Scholar]
- 16.van Zanten GH, de Graaf S, Slootweg PJ, Heijnen HF, Connolly TM, de Groot PG, Sixma JJ. Increased platelet deposition on atherosclerotic coronary arteries. J Clin Invest. 1994;93:615–632. doi: 10.1172/JCI117014. [DOI] [PMC free article] [PubMed] [Google Scholar]
- 17.Reed MJ, Iruela-Arispe L, O’Brien ER, Truong T, LaBell T, Bornstein P, Sage EH. Expression of thrombospondins by endothelial cells. Injury is correlated with TSP-1. Am J Pathol. 1995;147:1068–1080. [PMC free article] [PubMed] [Google Scholar]
- 18.Roth JJ, Gahtan V, Brown JL, Gerhard C, Swami VK, Rothman VL, Tulenko TN, Tuszynski GP. Thrombospondin-1 is elevated with both intimal hyperplasia and hypercholesterolemia. J Surg Res. 1998;74:11–16. doi: 10.1006/jsre.1997.5209. [DOI] [PubMed] [Google Scholar]
- 19.Murphy-Ullrich JE, Gurusiddappa S, Frazier WA, Hook M. Heparin-binding peptides from thrombospondins 1 and 2 contain focal adhesion-labilizing activity. J Biol Chem. 1993;268:26784–26789. [PubMed] [Google Scholar]
- 20.Tan K, Duquette M, Liu JH, Zhang R, Joachimiak A, Wang JH, Lawler J. The structures of the thrombospondin-1 N-terminal domain and its complex with a synthetic pentameric heparin. Structure. 2006;14:33–42. doi: 10.1016/j.str.2005.09.017. [DOI] [PMC free article] [PubMed] [Google Scholar]
- 21.Johnson S, Michalak M, Opas M, Eggleton P. The ins and outs of calreticulin: From the ER lumen to the extracellular space. Trends Cell Biol. 2001;11:122–129. doi: 10.1016/s0962-8924(01)01926-2. [DOI] [PubMed] [Google Scholar]
- 22.Zhu Q, Zelinka P, White T, Tanzer ML. Calreticulin-integrin bidirectional signaling complex. Biochem Biophys Res Commun. 1997;232:354–358. doi: 10.1006/bbrc.1997.6195. [DOI] [PubMed] [Google Scholar]
- 23.Kwon MS, Park CS, Choi K, Ahnn J, Kim JI, Eom SH, Kaufman SJ, Song WK. Calreticulin couples calcium release and calcium influx in integrin-mediated calcium signaling. Mol Biol Cell. 2000;11:1433–1443. doi: 10.1091/mbc.11.4.1433. [DOI] [PMC free article] [PubMed] [Google Scholar]
- 24.Gardai SJ, McPhillips KA, Frasch SC, Janssen WJ, Starefeldt A, Murphy-Ullrich JE, Bratton DL, Oldenborg PA, Michalak M, Henson PM. Cell-surface calreticulin initiates clearance of viable or apoptotic cells through transactivation of LRP on the phagocyte. Cell. 2005;123:321–334. doi: 10.1016/j.cell.2005.08.032. [DOI] [PubMed] [Google Scholar]
- 25.Pike SE, Yao L, Jones KD, Cherney B, Appella E, Sakaguchi K, Nakhasi H, Teruya-Feldstein J, Wirth P, Gupta G, Tosato G. Vasostatin, a calreticulin fragment, inhibits angiogenesis and suppresses tumor growth. J Exp Med. 1998;188:2349–2356. doi: 10.1084/jem.188.12.2349. [DOI] [PMC free article] [PubMed] [Google Scholar]
- 26.Gold LI, Rahman M, Blechman KM, Greives MR, Churgin S, Michaels J, Callaghan MJ, Cardwell NL, Pollins AC, Michalak M, Siebert JW, Levine JP, Gurtner GC, Nanney LB, Galiano RD, Cadacio CL. Overview of the role for calreticulin in the enhancement of wound healing through multiple biological effects. J Invest Dermatol Symp Proc. 2006;11:57–65. doi: 10.1038/sj.jidsymp.5650011. [DOI] [PubMed] [Google Scholar]
- 27.Norgaard Toft K, Larsen N, Steen Jorgensen F, Hojrup P, Houen G, Vestergaard B. Small angle X-ray scattering study of calreticulin reveals conformational plasticity. Biochim Biophys Acta. 2008;1784:1265–1270. doi: 10.1016/j.bbapap.2008.05.005. [DOI] [PubMed] [Google Scholar]
- 28.Ellgaard L, Riek R, Braun D, Herrmann T, Helenius A, Wuthrich K. Three-dimensional structure topology of the calreticulin P-domain based on NMR assignment. FEBS Lett. 2001;488:69–73. doi: 10.1016/s0014-5793(00)02382-6. [DOI] [PubMed] [Google Scholar]
- 29.Tan Y, Chen M, Li Z, Mabuchi K, Bouvier M. The calcium- and zinc-responsive regions of calreticulin reside strictly in the N-/C-domain. Biochim Biophys Acta. 2006;1760:745–753. doi: 10.1016/j.bbagen.2006.02.003. [DOI] [PubMed] [Google Scholar]
- 30.Schrag JD, Bergeron JJ, Li Y, Borisova S, Hahn M, Thomas DY, Cygler M. The Structure of calnexin, an ER chaperone involved in quality control of protein folding. Mol Cell. 2001;8:633–644. doi: 10.1016/s1097-2765(01)00318-5. [DOI] [PubMed] [Google Scholar]
- 31.Guo L, Groenendyk J, Papp S, Dabrowska M, Knoblach B, Kay C, Parker JM, Opas M, Michalak M. Identification of an N-domain histidine essential for chaperone function in calreticulin. J Biol Chem. 2003;278:50645–50653. doi: 10.1074/jbc.M309497200. [DOI] [PubMed] [Google Scholar]
- 32.Tirion MM. Large Amplitude Elastic Motions in Proteins from a Single-Parameter, Atomic Analysis. Phys Rev Lett. 1996;77:1905–1908. doi: 10.1103/PhysRevLett.77.1905. [DOI] [PubMed] [Google Scholar]
- 33.Bahar I, Atilgan AR, Erman B. Direct evaluation of thermal fluctuations in proteins using a single-parameter harmonic potential. Folding Des. 1997;2:173–181. doi: 10.1016/S1359-0278(97)00024-2. [DOI] [PubMed] [Google Scholar]
- 34.Bahar I, Lezon TR, Bakan A, Shrivastava IH. Normal Mode Analysis of Biomolecular Structures: Functional Mechanisms of Membrane Proteins. Chem Rev. 2010;110:1463–1497. doi: 10.1021/cr900095e. [DOI] [PMC free article] [PubMed] [Google Scholar]
- 35.Chennubhotla C, Rader AJ, Yang LW, Bahar I. Elastic network models for understanding biomolecular machinery: From enzymes to supramolecular assemblies. Phys Biol. 2005;2:S173–S180. doi: 10.1088/1478-3975/2/4/S12. [DOI] [PubMed] [Google Scholar]
- 36.Isin B, Doruker P, Bahar I. Functional motions of influenza virus hemagglutinin: A structure-based analytical approach. Biophys J. 2002;82:569–581. doi: 10.1016/S0006-3495(02)75422-2. [DOI] [PMC free article] [PubMed] [Google Scholar]
- 37.Keskin O, Bahar I, Flatow D, Covell DG, Jernigan RL. Molecular mechanisms of chaperonin GroEL-GroES function. Biochemistry. 2002;41:491–501. doi: 10.1021/bi011393x. [DOI] [PubMed] [Google Scholar]
- 38.Ramaswamy A, Bahar I, Ioshikhes I. Structural dynamics of nucleosome core particle: Comparison with nucleosomes containing histone variants. Proteins. 2005;58:683–696. doi: 10.1002/prot.20357. [DOI] [PubMed] [Google Scholar]
- 39.Szarecka A, Xu Y, Tang P. Dynamics of heteropentameric nicotinic acetylcholine receptor: Implications of the gating mechanism. Proteins. 2007;68:948–960. doi: 10.1002/prot.21462. [DOI] [PubMed] [Google Scholar]
- 40.Isin B, Schulten K, Tajkhorshid E, Bahar I. Mechanism of signal propagation upon retinal isomerization: Insights from molecular dynamics simulations of rhodopsin restrained by normal modes. Biophys J. 2008;95:789–803. doi: 10.1529/biophysj.107.120691. [DOI] [PMC free article] [PubMed] [Google Scholar]
- 41.Pierce B, Weng Z. A combination of rescoring and refinement significantly improves protein docking performance. Proteins. 2008;72:270–279. doi: 10.1002/prot.21920. [DOI] [PMC free article] [PubMed] [Google Scholar]
- 42.Wiehe K, Pierce B, Mintseris J, Tong WW, Anderson R, Chen R, Weng Z. ZDOCK and RDOCK performance in CAPRI rounds 3, 4, and 5. Proteins. 2005;60:207–213. doi: 10.1002/prot.20559. [DOI] [PubMed] [Google Scholar]
- 43.Chen R, Tong W, Mintseris J, Li L, Weng Z. ZDOCK predictions for the CAPRI challenge. Proteins. 2003;52:68–73. doi: 10.1002/prot.10388. [DOI] [PubMed] [Google Scholar]
- 44.Wu Y, Cao Z, Yi H, Jiang D, Mao X, Liu H, Li W. Simulation of the interaction between ScyTx and small conductance calcium-activated potassium channel by docking and MM-PBSA. Biophys J. 2004;87:105–112. doi: 10.1529/biophysj.103.039156. [DOI] [PMC free article] [PubMed] [Google Scholar]
- 45.Yi H, Qiu S, Cao Z, Wu Y, Li W. Molecular basis of inhibitory peptide maurotoxin recognizing Kv1.2 channel explored by ZDOCK and molecular dynamic simulations. Proteins. 2008;70:844–854. doi: 10.1002/prot.21706. [DOI] [PubMed] [Google Scholar]
- 46.Jin L, Wu Y. Molecular mechanism of the sea anemone toxin ShK recognizing the Kv1.3 channel explored by docking and molecular dynamic simulations. J Chem Inf Model. 2007;47:1967–1972. doi: 10.1021/ci700178w. [DOI] [PubMed] [Google Scholar]
- 47.Pierce B, Weng Z. ZRANK: Reranking protein docking predictions with an optimized energy function. Proteins. 2007;67:1078–1086. doi: 10.1002/prot.21373. [DOI] [PubMed] [Google Scholar]
- 48.Gray JJ, Moughon S, Wang C, Schueler-Furman O, Kuhlman B, Rohl CA, Baker D. Protein-protein docking with simultaneous optimization of rigid-body displacement and side-chain conformations. J Mol Biol. 2003;331:281–299. doi: 10.1016/s0022-2836(03)00670-3. [DOI] [PubMed] [Google Scholar]
- 49.Case DA, Cheatham TE, III, Darden T, Gohlke H, Luo R, Merz KM, Jr, Onufriev A, Simmerling C, Wang B, Woods RJ. The Amber biomolecular simulation programs. J Comput Chem. 2005;26:1668–1688. doi: 10.1002/jcc.20290. [DOI] [PMC free article] [PubMed] [Google Scholar]
- 50.Jorgensen WL, Chandrasekhar J, Madura JD, Impey RW, Klein ML. Comparison of simple potential functions for simulating liquid water. J Chem Phys. 1983;79:926–935. [Google Scholar]
- 51.Suever J, Chen Y, McDonald JM, Song Y. Conformation and Free Energy Analyses of the Complex of Ca2+-Bound Calmodulin and the Fas Death Domain. Biophys J. 2008;95:1–9. doi: 10.1529/biophysj.108.130542. [DOI] [PMC free article] [PubMed] [Google Scholar]
- 52.Song Y, Guallar V, Baker NA. Molecular dynamics simulations of salicylate effects on the micro- and mesoscopic properties of a dipalmitoylphosphatidylcholine bilayer. Biochemistry. 2005;44:13425–13438. doi: 10.1021/bi0506829. [DOI] [PMC free article] [PubMed] [Google Scholar]
- 53.Liu Y, Pan D, Bellis SL, Song Y. Effect of altered glycosylation on the structure of the I-like domain of β1 integrin: A molecular dynamics study. Proteins. 2008;73:989–1000. doi: 10.1002/prot.22126. [DOI] [PubMed] [Google Scholar]
- 54.Darden T, York D, Pedersen LG. Particle mesh Ewald: An N·log(N) method for Ewald sums in large systems. J Chem Phys. 1993;98:10089–10092. [Google Scholar]
- 55.Ganoth A, Friedman R, Nachliel E, Gutman M. A molecular dynamics study and free energy analysis of complexes between the Mlc1p protein and two IQ motif peptides. Biophys J. 2006;91:2436–2450. doi: 10.1529/biophysj.106.085399. [DOI] [PMC free article] [PubMed] [Google Scholar]
- 56.Wang W, Lim WA, Jakalian A, Wang J, Wang J, Luo R, Bayly CI, Kollman PA. An analysis of the interactions between the Sem-5 SH3 domain and its ligands using molecular dynamics, free energy calculations, and sequence analysis. J Am Chem Soc. 2001;123:3986–3994. doi: 10.1021/ja003164o. [DOI] [PubMed] [Google Scholar]
- 57.Kollman PA, Massova I, Reyes C, Kuhn B, Huo S, Chong L, Lee M, Lee T, Duan Y, Wang W, Donini O, Cieplak P, Srinivasan J, Case DA, Cheatham TE., III Calculating structures and free energies of complex molecules: Combining molecular mechanics and continuum models. Acc Chem Res. 2000;33:889–897. doi: 10.1021/ar000033j. [DOI] [PubMed] [Google Scholar]
- 58.Wang J, Morin P, Wang W, Kollman PA. Use of MM-PBSA in reproducing the binding free energies to HIV-1 RT of TIBO derivatives and predicting the binding mode to HIV-1 RT of efavirenz by docking and MM-PBSA. J Am Chem Soc. 2001;123:5221–5230. doi: 10.1021/ja003834q. [DOI] [PubMed] [Google Scholar]
- 59.Li L, Uversky VN, Dunker AK, Meroueh SO. A computational investigation of allostery in the catabolite activator protein. J Am Chem Soc. 2007;129:15668–15676. doi: 10.1021/ja076046a. [DOI] [PubMed] [Google Scholar]
- 60.Brooks B, Karplus M. Normal modes for specific motions of macromolecules: Application to the hinge-bending mode of lysozyme. Proc Natl Acad Sci USA. 1985;82:4995–4999. doi: 10.1073/pnas.82.15.4995. [DOI] [PMC free article] [PubMed] [Google Scholar]
- 61.Lee SJ, Song Y, Baker NA. Molecular dynamics simulations of asymmetric NaCl and KCl solutions separated by phosphatidylcholine bilayers: Potential drops and structural changes induced by strong Na+-lipid interactions and finite size effects. Biophys J. 2008;94:3565–3576. doi: 10.1529/biophysj.107.116335. [DOI] [PMC free article] [PubMed] [Google Scholar]
- 62.Efron B, Tibshirani RJ. An Introduction to the Bootstrap. Chapman & Hall; New York: 1998. [Google Scholar]
- 63.Chen AA, Pappu RV. Quantitative characterization of ion pairing and cluster formation in strong 1:1 electrolytes. J Phys Chem B. 2007;111:6469–6478. doi: 10.1021/jp0708547. [DOI] [PubMed] [Google Scholar]
- 64.Bailey NTJ. Statistical methods in biology. 3. Cambridge University Press; New York: 1995. [Google Scholar]
Associated Data
This section collects any data citations, data availability statements, or supplementary materials included in this article.