To the editor,
The major methods for examining tissue samples include histology, autoradiography of radiolabeled compounds, and fluorescence microscopy in conjunction with labeled antibodies. Mass spectrometry (MS) imaging has the potential to complement these methods and is advantageous for reasons that include the fact that more chemical information can be gleaned during a single experiment and that labeling is not required. Some of its limitations include ion suppression effects, the fact that targeted experiments are often more challenging, and, most importantly, that it is an invasive experiment. The principal methods for MS imaging are secondary ion mass spectrometry (SIMS)1, 2, which has the advantage of high spatial resolution, and matrix assisted laser desorption/ionization (MALDI)3, 4, which allows for the detection of higher molecular weight species and has been used for high resolution/high mass accuracy imaging of lipids from tissue5. More recently, attention has been given to imaging by ambient ionization methods, which allow for the examination of samples in situ, outside the vacuum of the mass spectrometer; reports in the literature of ambient imaging include use of DESI-MS6, surface-sampling probe electrospray ionization7, and laser ablation electro-spray ionization (LAESI)8. The first ambient imaging method, DESI-MS, analyzes condensed phase samples using a pneumatically assisted stream of charged microdroplets directed at the surface9. A thin liquid film collects on the surface, and the impact of incoming droplets on this thin film causes the ejection of small secondary droplets containing the dissolved analyte10. Reports in the literature include examples of imaging of thin tissue sections6, 11, 12, seaweed13, TLC plates14, ink on paper15, and latent fingerprints16.
One defining feature of ambient analysis is that, because samples are analyzed in their native state, little or no sample preparation is used. Any sample preparation or treatment is typically done concurrently with the analysis and not as a separate step. The principal benefits of ambient analysis, therefore, are a reduction in the time required for analysis and the ease of operation. One drawback is that untreated samples are often chemically complex, and this is particularly true in tissue imaging applications. High selectivity is therefore important for the successful implementation of ambient analysis. Increased selectivity in DESI over that available by unit resolution, single stage mass spectrometry has been achieved by tandem mass spectrometry, the use of in situ chemical reactions11, and by high resolution mass spectrometry17. High resolution DESI experiments were reported in 2006 by Fernandez, Muddiman and their coworkers using FT-ICR. Volny and coworkers recently extended this work by performing high m/z resolution and mass accuracy DESI imaging on an FT-ICR, but the spatial resolution was lower than previously reported for DESI imaging18. In this letter, we describe DESI-MS imaging of rat brain tissue sections using an orbitrap mass spectrometer (Thermo Scientific, San Jose, CA), which has mass accuracy and resolving power in the same range as that of the FT-ICR.
All of the experiments were performed on an LTQ Orbitrap mass spectrometer (Thermo Scientific). Imaging experiments were done using the 30k mass resolution setting, while the 100k setting with lock masses was used for exact mass measurements to calculate molecular formulae. Mass standards were delivered directly to the mass spectrometer via an electrosonic spray ionization (ESSI) source concurrently with the DESI analysis. The [M+H]+ of reserpine and the [M+Na]+ ion of cyclosporine A, exact masses of 609.28121 and 1224.83114, respectively, were used as standards in the positive ion mode; the [M-H]- ion of taurocholate and the C15H15O6N3P3F20(C2F4)2 ultram]1621 peak, with theoretical exact masses of 514.28385 and 1005.97266, respectively, were used in the negative ion mode. Frozen rat brain was purchased from Pel-Freez Biologicals, cut into 10 micron sections, and thaw mounted on a glass slide. The pixel size in the imaging experiments was 230 × 230 microns. The acquisition time per pixel on the LTQ-Orbitrap was 1.06 s for a total image collection time of 48 minutes for the coronal section and 78 minutes for the sagittal sections. Full profile mode was turned on to keep the orbitrap mass list constant. The MS images were viewed in BioMap (www.maldi-msi.org) by first importing the MS data into MATLAB (MathWorks) for conversion into the Analyze 7.5 format and scaling of the intensities to a maximum of 32767, the upper intensity limit imposed by BioMap. A commercially available software package, FireFly, was also used for the image conversion (Indigo BioSystems, Inc., Indianapolis). No denoising of the data was performed
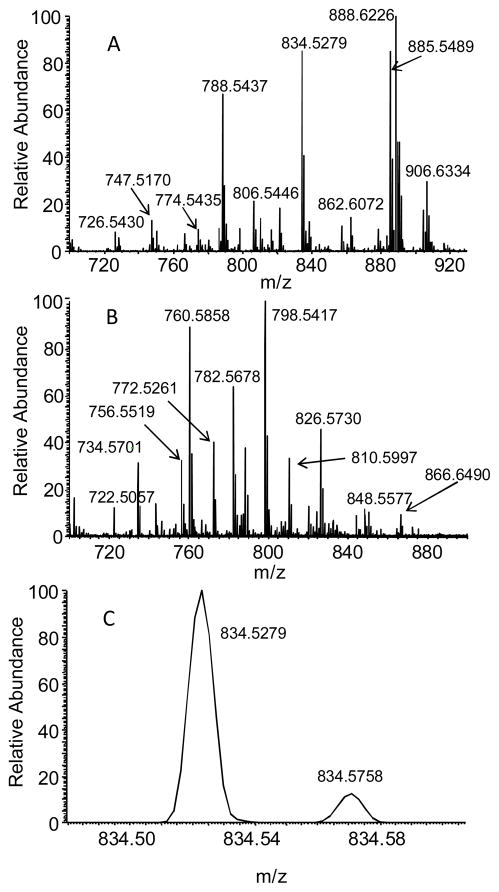
Full scan mass spectra for the direct analysis of rat brain at 100k resolution are shown in Figure 1. The polar lipid profile was similar to that obtained previously from direct analysis of rat brain tissue by DESI-MS on a unit resolution ion trap6, 19, except that a number of new peaks are identifiable due to the increased resolution. In the positive ion mode, most of the abundant species were potassium and sodium adducts of diacyl-glycerosphosphocholines (GPCho), while some of the less abundant peaks were identified as glycerophosphoethanolamines (GPEtn), sphingomyelin (SM), and glycosphingolipids like cerebroside (GlcCer). In the negative ion mode, deprotonated fatty acids such as palmitate, oleate, and docosahexaenoate were detected; the [M–H]− ions of the relatively acidic polar lipids were also observed, including glycerophosphoserines (GPSer), glycerophosphoinositols (GPIns), and sulfatides.
Figure 1.
Typical mass spectra in the negative ion mode (A) and the positive ion mode (B) for the analysis of rat brain sections. The region around m/z 834.5 in the negative ion mode is shown in (C).
In both the positive and the negative ion modes, several pairs of peaks differing by less than 0.1 m/z units (Thomson - Th) were observed. The measured m/z for these ions and the proposed chemical formulae and molecular identifications are shown in Table 1. Molecular identification on the LTQ orbitrap was performed by a combination of exact mass measurement, tandem mass spectrometry, and database searching using the LIPID MAPS Structure Database (www.lipidmaps.org). The mass accuracy at 100k resolution was generally sufficient to correctly calculate the molecular formula. Tandem mass spectrometry (MS/MS) was used to confirm the molecular identity of the ions; the collision induced dissociation (CID) fragmentation patterns of polar lipids have been reported on extensively20. Briefly, fragmentation in the negative ion mode is usually informative, commonly yielding fragment ions corresponding to fatty acid side chains and the polar head group. MS/MS of phospholipids was less informative in the positive ion mode. GPCho, SM, and GPEtn gave a characteristic neutral loss from the headgroup, but fragment ions resulting from the radyl groups were generally low in intensity or absent.
Table 1.
Examples of polar lipids detected in the positive and negative ion modes differing by less than 0.1 Th
| negative ion mode | |||
|---|---|---|---|
| measured m/z | proposed formula | error (ppm) | molecular identity |
| 834.5284 | C46H77O10NP | 0.575 | 40:6 diacyl GPSer |
| 834.5766 | C44H84O11NS | 0.72 | C20 Sulfatide |
| 863.6105 | C4513CH88O11NS | −0.104 | C22 sulfatide, 13C |
| 863.5609 | C45H84O13P | −3.555 | 36:1 diacyl GPIns |
| 886.5527 | C4613C H82O13 P | 0.609 | 38:4 diacyl GPIns, 13C |
| 888.6226 | C48H90O11NS | −0.28 | C24:1 sulfatide |
| 909.6562 | C4513C3H92O12NS | 6.711 | C24-OH sulfatide, 13C |
| 909.5487 | C49H82O13P | −0.035 | 40:6 diacyl GPIns |
| positive ion mode | |||
| 768.5308 | C41H80O7NP+K | 0.391 | 36:1 diacyl GPEns |
| 768.5882 | C42H84O7NP+Na | 0.418 | 34:1 plasmalogen GPCho |
| 784.5622 | C42H84O7NP+K | 0.461 | 34:1 plasmalogen GPCho |
| 784.5834 | C42H84O8NP+Na | 0.714 | 34:0 GPCho |
| 806.5103 | C43H78O8NP+K | 0.637 | 38:4 diacyl GPEtn |
| 806.5700 | C46H81O8NP | 0.569 | 38:6 diacyl GPCho |
| 832.5835 | C46H84O8NP+Na | 0.966 | 38:4 diacyl GPCho |
| 832.6645 | C48H91O8N+Na | 0.973 | C24:1 GlcCer |
| 848.5577 | C46H84O8NP+K | 1.269 | 38:4 diacyl GPCho |
| 848.6386 | C48H91O8N+K | 1.147 | C24:1 GlcCer |
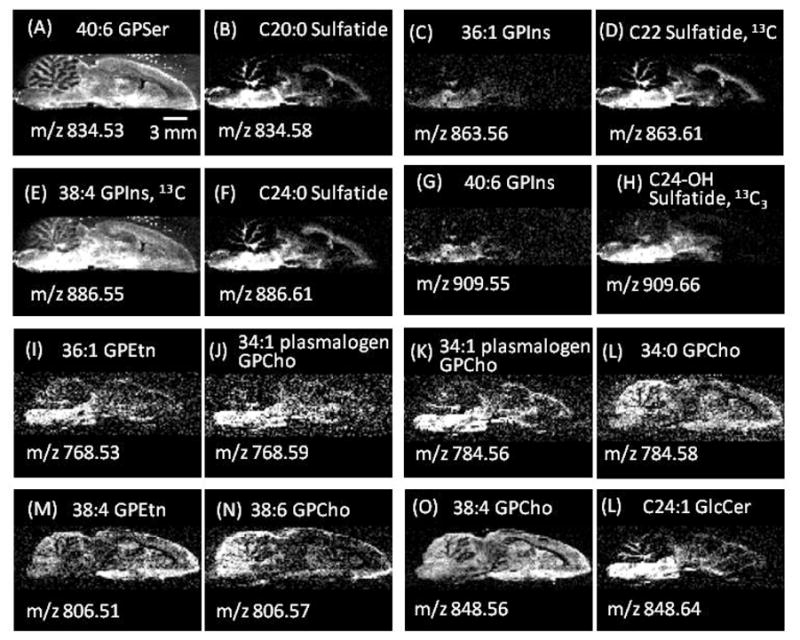
Eight pairs of selected ion images, four pairs each from the negative (Figure 2A–H) and the positive ion mode (Figure 2I–L), are shown in Figure 2. In five of the ion pairs shown, two unique molecular species have nearly the same m/z, such as 36:1 GPEtn and 34:1 plasmalogen GPCho in Figure 2I and J. In the other three pairs, a relatively abundant isotope peak obscures a minor component, such as the 13C isotope peak of 38:4 GPIns and the [M–H]− ion of C24:0 sulfatide in Figure 2E and F. In this case, only one of the peaks is of unique interest. However, without the use of a high resolution mass spectrometer, the minor component would be obscured by the more abundant isotope peak.
Figure 2.

Selected ion images in the negative (A–H) and positive (I–L) mode
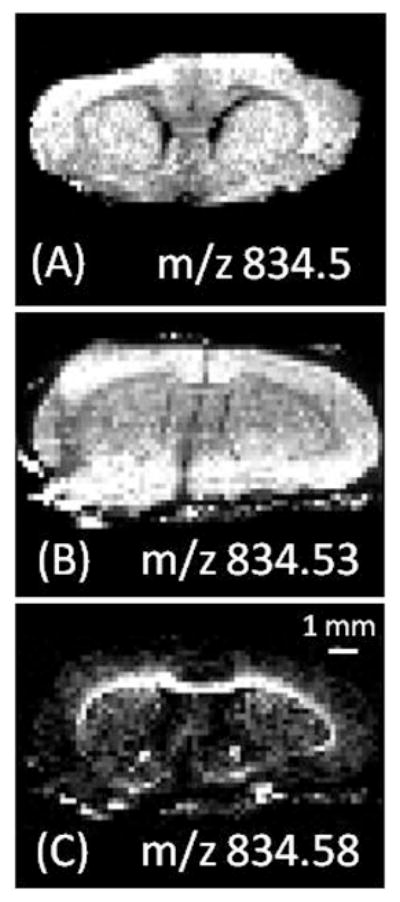
The selected ion image of m/z 834 from a coronal section of rat brain imaged on an LTQ ion trap in the negative ion mode is shown in figure 3A6. This previous study identified the ion as 40:6 GPSer. Imaging on the LTQ orbitrap, however, indicated that this ion actually consists of two different molecular species (figure 1C) with distinct distributions: 40:6 GPSer and C20 sulfatide (Figure 3B and C). This example illustrates the difficulty with using MS/MS alone to identify ions of almost identical mass. First, interpretation of tandem mass spectra resulting from multiple molecular ions is challenging. Second, fragment ions resulting from precursor ions with lower relative abundance may be missed. Third, and most importantly, some overlapping species may only be present in isolated regions of the tissue. In the case shown in Figure 3, the minor component, C20 sulfatide, is detectable only in the white matter (e.g. corpus callosum) but is absent in the gray matter, which makes up the bulk of the tissue surface area. A tissue section would need to be exhaustively analyzed (i.e. imaged) in the MS/MS mode for each peak to identify overlapping ions; N peaks would therefore require N number of MS/MS images, a significant problem because N times more sample and time would be required compared to collecting a single image. Imaging using a high resolution MS solves this problem. The improved resolution of the orbitrap compared with an ion trap resolves most nearly isobaric species and increases the amount of chemical information obtained from complex samples. Using an orbitrap at a resolution of 30k does increase the amount of time required to collect an image by approximately 1.5 times compared with a unit mass resolution ion trap.
Figure 3.

Selected ion images in the negative ion mode of (A) m/z 834.5 on an LTQ ion trap. B) m/z 834.53 and (c) m/z 834.58 collected on an orbitrap
Accurate mass data, however, was often not sufficient to unambiguously identify unknown peaks for two reasons. First, there are a number of isomeric lipid species with the same exact mass. Second, even when operated at 100k resolution, some peaks in the rat brain positive and negative mode spectra are not fully resolved, reducing the accuracy of the mass/charge measurement. For example, the peak detected at m/z 909.6562 in the negative ion mode was only partially resolved from another peak at approximately m/z 909.635. Interpretation of MS/MS spectra was still needed in this case to identify the major component as C24-OH Sulfatide, 13C3. The orbitrap was therefore valuable as a tool for screening for isobaric peaks, followed by MS/MS for molecular identification. To conclude, ambient methods such as DESI-MS are used to analyze untreated samples that are typically chemically complex. High resolution tissue imaging using the orbitrap, as demonstrated here, is one way to improve the selectivity of ambient ionization methods, a necessity for the analysis of complex mixtures.
Acknowledgments
This work was supported by the National Institutes of Health grant # 1R21EB009459-01 and in part by a fellowship from Merck Research Laboratories (NM). We also thank Prosolia, Inc. (Indianapolis, IN) for providing a copy of the software FireFly v.1.2.0.1
References
- 1.Colliver T, Brummel C, Pacholski M, Swanek F, Ewing A, Winograd N. Atomic and molecular imaging at the single-cell level with TOF-SIMS. Analytical Chemistry. 1997;69:2225–2231. doi: 10.1021/ac9701748. [DOI] [PubMed] [Google Scholar]
- 2.Luxembourg SL, Mize TH, McDonnell LA, Heeren RMA. High-spatial resolution mass spectrometric imaging of peptide and protein distributions on a surface. Analytical Chemistry. 2004;76:5339–5344. doi: 10.1021/ac049692q. [DOI] [PubMed] [Google Scholar]
- 3.Stoeckli M, Chaurand P, Hallahan DE, Caprioli RM. Imaging mass spectrometry: A new technology for the analysis of protein expression in mammalian tissues. Nature Medicine. 2001;7:493–496. doi: 10.1038/86573. [DOI] [PubMed] [Google Scholar]
- 4.Jurchen J, Rubakhin S, Sweedler J. MALDI-MS imaging of features smaller than the size of the laser beam. Journal of the American Society for Mass Spectrometry. 2005;16:1654–1659. doi: 10.1016/j.jasms.2005.06.006. [DOI] [PubMed] [Google Scholar]
- 5.Burnum KE, Cornett DS, Puolitaival SM, Milne SB, Myers DS, Tranguch S, Brown HA, Dey SK, Caprioli RM. Spatial and temporal alterations of phospholipids determined by mass spectrometry during mouse embryoimplantation. J Lipid Res. 2009;50:2290–2298. doi: 10.1194/jlr.M900100-JLR200. [DOI] [PMC free article] [PubMed] [Google Scholar]
- 6.Wiseman JM, Ifa DR, Song Q, Cooks RG. Tissue Imaging at Atmospheric Pressure using Desorption Electrospray Ionization (DESI) Mass Spectrometry. Angew Chem Int Edit. 2006;45:7188–7192. doi: 10.1002/anie.200602449. [DOI] [PubMed] [Google Scholar]
- 7.Van Berkel GJ, Kertesz V, Koeplinger KA, Vavrek M, Kong ANT. Liquid microjunction surface sampling probe electrospray mass spectrometry for detection of drugs and metabolites in thin tissue sections. Journal of Mass Spectrometry. 2008;43:500–508. doi: 10.1002/jms.1340. [DOI] [PubMed] [Google Scholar]
- 8.Nemes P, Vertes A. Laser ablation electrospray ionization for atmospheric pressure, in vivo, and imaging mass spectrometry. Analytical Chemistry. 2007;79:8098–8106. doi: 10.1021/ac071181r. [DOI] [PubMed] [Google Scholar]
- 9.Takats Z, Wiseman JM, Gologan B, Cooks RG. Mass spectrometry sampling under ambient conditions with desorption electrospray ionization. Science. 2004;306:471–473. doi: 10.1126/science.1104404. [DOI] [PubMed] [Google Scholar]
- 10.Costa AB, Cooks RG. Simulation of Atmospheric Transport and Droplet Thin-Film Collisions in Desorption Electrospray Ionization. Chemical Communications. 2007 doi: 10.1039/b710511h. [DOI] [PubMed] [Google Scholar]
- 11.Wu CP, Ifa DR, Manicke NE, Cooks RG. Rapid, Direct Analysis of Cholesterol by Charge Labeling in Reactive Desorption Electrospray Ionization. Analytical Chemistry. 2009;81:7618–7624. doi: 10.1021/ac901003u. [DOI] [PMC free article] [PubMed] [Google Scholar]
- 12.Wiseman JM, Ifa DR, Zhu YX, Kissinger CB, Manicke NE, Kissinger PT, Cooks RG. Desorption electrospray ionization mass spectrometry: Imaging drugs and metabolites in tissues. Proceedings of the National Academy of Sciences of the United States of America. 2008;105:18120–18125. doi: 10.1073/pnas.0801066105. [DOI] [PMC free article] [PubMed] [Google Scholar]
- 13.Lane AL, Nyadong L, Galhena AS, Shearer TL, Stout EP, Parry RM, Kwasnik M, Wang MD, Hay ME, Fernandez FM, Kubanek J. Desorption electrospray ionization mass spectrometry reveals surface-mediated antifungal chemical defense of a tropical seaweed. Proceedings of the National Academy of Sciences of the United States of America. 2009;106:7314–7319. doi: 10.1073/pnas.0812020106. [DOI] [PMC free article] [PubMed] [Google Scholar]
- 14.Van Berkel GJ, Kertesz V. Automated Sampling and Imaging of Analytes Separated on Thin-Layer Chromatography Plates using Desorption Electrospray Ionization Mass Spectrometry. Analytical Chemistry. 2006;78:4938–4944. doi: 10.1021/ac060690a. [DOI] [PubMed] [Google Scholar]
- 15.Ifa DR, Gumaelius LM, Eberlin LS, Manicke NE, Cooks RG. Forensic analysis of inks by imaging desorption electrospray ionization (DESI) mass spectrometry. Analyst. 2007;132:461–467. doi: 10.1039/b700236j. [DOI] [PubMed] [Google Scholar]
- 16.Ifa DR, Manicke NE, Dill AL, Cooks G. Latent fingerprint chemical imaging by mass spectrometry. Science. 2008;321:805–805. doi: 10.1126/science.1157199. [DOI] [PubMed] [Google Scholar]
- 17.Bereman MS, Nyadong L, Fernandez FM, Muddiman DC. Direct high-resolution peptide and protein analysis by desorption electrospray ionization Fourier transform ion cyclotron resonance mass spectrometry. Rapid Communications in Mass Spectrometry. 2006;20:3409–3411. doi: 10.1002/rcm.2759. [DOI] [PubMed] [Google Scholar]
- 18.Pol J, Vidova V, Kruppa G, Kobliha V, Novak P, Lemr K, Kotiaho T, Kostiainen R, Havlicek V, Volny M. Automated Ambient Desorption Electrospray Ionization Platform for Surface Imaging Integrated with a Commercial Fourier Transform Ion Cyclotron Resonance Mass Spectrometer. Analytical Chemistry. 2009;81:8479–8487. doi: 10.1021/ac901368q. [DOI] [PubMed] [Google Scholar]
- 19.Wiseman JM, Puolitaival SM, Takats Z, Cooks RG, Caprioli R. Mass Spectrometric Profiling of Intact Biological Tissue by Using Desorption Electrospray Ionization. Angew Chem Int Edit. 2005;44:7094–7097. doi: 10.1002/anie.200502362. [DOI] [PubMed] [Google Scholar]
- 20.Pulfer M, Murphy RC. Electrospray mass spectrometry of phospholipids. Mass Spectrometry Reviews. 2003;22:332–364. doi: 10.1002/mas.10061. [DOI] [PubMed] [Google Scholar]


