

Abstract
We present simultaneous measurement of enhancement kinetics of an optical and a magnetic resonance (MR) contrast agent in a small animal breast tumor model (R3230 ac) using a combined MR-diffuse optical tomographic (MR-DOT) imaging system. A mixture of a small molecular-weight MR contrast agent gadolinium-diethylene-triamine-pentaacetic acid (Gd-DTPA) and a large molecular-weight optical contrast agent indocyanine green (ICG) was administered intravenously for multimodal dynamic imaging. Coregistration of optical and MR images was accomplished using agar-water–based markers. Using T2 and dynamic T1 weighted MR images, we divided the entire tumor into two regions of interest (ROI): a viable and a nonviable region. The absorption enhancements in the ROIs were calculated. An enhancement of the ICG was observed in the viable region. On the contrary, there was a lower enhancement in the nonviable region.
Keywords: medical imaging, tomography, infrared imaging, magnetic resonance imaging, image reconstruction
1 Introduction
Diffuse optical tomography (DOT) can be used to localize and characterize a tumor based on endogenous contrast. Besides, using exogenous contrast agents may provide additional information for tumor detection and characterization. For example, it may be possible to use the dynamic behavior of indocyanine green (ICG) for differential diagnosis.1–3 ICG binds to plasma proteins; thus, it is confined to the vascular compartment and behaves as an intravascular contrast agent.
To date, contrast agents have been used extensively in the magnetic resonance (MR) imaging of tumors including breast cancer.4 Clinical studies have shown that dynamic contrast enhanced–MR imaging (DCE-MRI) has a high sensitivity in breast cancer detection. Nonetheless, the major obstacle on the road to the use of DCE-MRI in breast cancer diagnosis is its low specificity. This is due to the small molecular weight of gadolinium-diethylene-triamine-pentaacetic acid (Gd-DTPA, 0.57 kDa) that leaks out of tumor vasculature.5 As a result, some benign lesions may show malignant-type enhancement kinetics and give false positive results because of their high vascularity and high interstitial volume.
This study is motivated by the desire to use a mixture of a small and a large molecular agent to improve specificity in cancer imaging.5 Small molecular agents leak into the extravascular space in tumors, resulting in higher contrast that improves sensitivity. Meanwhile, the large molecular optical agent probes vascular permeability, resulting in improved specificity. In this letter, we report the simultaneous measurement of optical and MR contrast agent kinetics using a frequency domain DOT small animal imaging system with a time resolution of 16 s and a 4T MRI system.
2 Methods
We used a R3230 ac-induced small animal breast tumor model in this study. Tumor cells were injected into a Fisher rat that weighed 170 g. The tumor size was ∼2 cm. We used a frequency domain DOT system that had already been integrated into a 4T MR scanner previously.6 The time resolution of the imaging system was a pivotal feature of the dynamic studies. Our frequency domain DOT system has eight sources and eight detectors7 with a time resolution of 16 s per time point. The time resolution of dynamic MR data acquisition was set to 23 s. Optical measurements were performed with a laser diode emitting at 785 nm and modulated at a frequency of 100 MHz. The MR and the DOT measurements were started and performed simultaneously. A mixture of Gd-DTPA (0.1 mmol/kg) and ICG (0.5 mg/kg) was injected intravenously into the animal after the first three T1 weighted baseline acquisitions. Data were acquired by both systems for ∼ 10 min.
Afterward, the calibrated optical data were analyzed using the diffusion equation with the Robin boundary conditions. We used the finite element method for the numerical solution of the diffusion equation. The details of the reconstruction scheme were described in Refs. 6 and 8. In the optical reconstructions, the first time point was selected as the baseline and then it was subtracted from subsequent dynamic optical data. Coregistration of MR and optical images was accomplished using agar-water–based markers attached to DOT fiber probes.9 These markers were visible on the MR images so that contact points of the fibers on the animal surface could be located. Please note that, in this preliminary study, we did not use any anatomical a priori information in the optical image reconstruction so as not to bias the inverse solution. It was important to take into account the heterogeneity of the tumor when calculating the contrast agent kinetics. The availability of both the T1 and T2-weighted images made it possible to select a viable and a nonviable region in the tumor. The two main criteria that characterized a viable region were (i) high signal (bright regions) on the MR enhancement image and (ii) normal or low signal (dark regions) in the T2 image.9 Accordingly, a nonviable region of the tumor was defined as a region that did not show T1 signal enhancement. We divided the entire tumor into two regions: one viable and one nonviable region. These ROIs were selected from MR enhancement images corresponding to the optical imaging slice. After the DOT reconstruction was completed, the mean of reconstructed absorption in each ROI at each time point was used to obtain the fractional absorption enhancement curve that was defined as [μa(t)−μa(t=0)]/ μa (t=0). Similarly, fractional MR signal enhancement was defined .
3 Results
Figure 1(a) displays the enhancement image superimposed on the T1-weighted image of the rat cross section. The ROI that was displayed on the image covered the nonviable region. The rest of the tumor was considered to be viable. Figure 1(b) shows the reconstructed absorption map at t= 160 s, when maximum enhancement was obtained. The calculated mean μa was 0.019 mm−1 in the viable ROI for the baseline measurement, and it increased to 0.022 mm−1 at the peak time point. Meanwhile, mean μa increased to 0.019 mm−1 in the nonviable ROI.
Fig. 1.
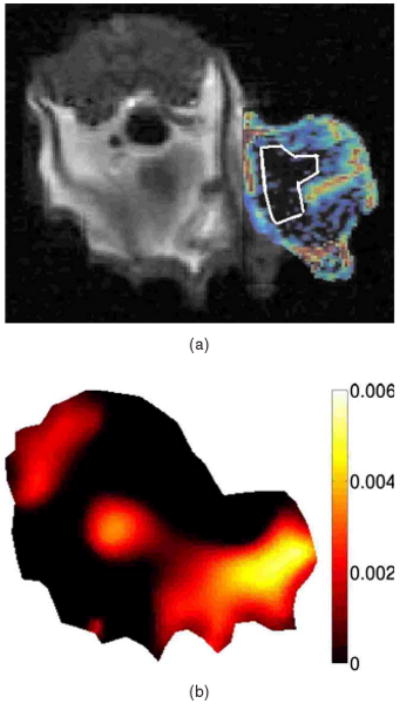
Enhancement images are given. (a) T1-weighted MR image at the peak signal enhancement. Red corresponds to the highest enhancement spots. The ROI covering the nonviable part of the tumor is shown on the image. (b) Reconstructed δμa map, at t= 160 s. (Color online only.)
Figure 2(a) shows the fractional enhancement for the T1-weighted signal obtained by MRI from the nonviable and viable ROIs. It was clear that the nonviable region exhibited low enhancement, and there was a higher signal enhancement in the viable region. In the viable ROI, Gd-DTPA kinetics showed a rapid rise. This was because small molecular contrast agent leaked out of the blood vessels in the viable region causing a rapid increase in the signal that reached the peak point immediately after the injection. The slow decay seen afterward showed that the Gd-DTPA started diffusing back into the intravascular space.
Fig. 2.

(a) Fractional T1 enhancement and (b) fractional μa enhancement in the viable and nonviable region.
Optical absorption enhancement kinetics is displayed in Fig. 2(b). Absorption kinetics showed a rapid rise in the viable region similar to MRI, and a slow decay was observed. The large molecular size of albumin-ICG made it difficult for the contrast agent to exchange between the extravascular and intravascular spaces. Meanwhile, the kinetics in the nonviable ROI showed low enhancement.
4 Discussion
DOT imaging allowed spatially resolved measurement of absorption kinetics within the tumor. The 16-s temporal resolution of our system allowed us to measure the fast-rising slope of absorption enhancement and recover the peak value of the optical absorption. It had been shown that reduced scattering did not depend on the concentration of ICG significantly.10 Therefore, we calculated only the absorption kinetics.
The spatial resolution of DOT was low compared to the MRI. As a result, the recovered optical enhancement map did not entirely overlap with the MR enhancement map. This showed that structural a priori information obtained from MRI should be used in optical reconstruction.
Some qualitative features of both contrast agents could be observed from the kinetic curves in the viable ROI. The kinetics of Gd-DTPA displayed the characteristics of a small molecular weight agent, whereas ICG kinetics showed the features of a large molecular agent. In addition, neither agent showed a significant enhancement in the nonviable region. These results were consistent with the DCE-MRI literature.11
Using two contrast agents, one small molecular weight MR and one large molecular weight optical agent, during a single imaging session provides fully coregistered complementary information. This study was the first step toward the goal to use optical imaging in conjunction with the DCE-MRI to improve specificity in tumor characterization.
Acknowledgments
We thank Dr. Min-Ying Su and Dr. Hon J. Yu for discussions on the subject. This research was supported in part by the National Cancer Institute through Grants No. R21/33 CA-101139, No. R21/33 CA120175, No. R21 CA 121568, and No. U54 CA105480; the California Breast Cancer Research Program No. 12IB-0095; and U.S. Army BC051304.
References
- 1.Ntziachristos V, Yodh AG, Schnall M, Chance B. Concurrent MRI and diffuse optical tomography of breast after indocyanine green enhancement. Proc Natl Acad Sci U S A. 2000;97:2767–2772. doi: 10.1073/pnas.040570597. [DOI] [PMC free article] [PubMed] [Google Scholar]
- 2.Intes X, Ripoll J, Chen Y, Nioka S, Yodh AG, Chance B. In vivo continuous-wave optical breast imaging enhanced with indocyanine green. Med Phys. 2003;30:1039–1047. doi: 10.1118/1.1573791. [DOI] [PubMed] [Google Scholar]
- 3.Alacam B, Yazici B, Intes X, Nioka S, Chance B. Pharmacokinetic-rate images of indocyanine green for breast tumors using near-infrared optical methods. Phys Med Biol. 2008;53:837–859. doi: 10.1088/0031-9155/53/4/002. [DOI] [PubMed] [Google Scholar]
- 4.Warner E, Plewes DB, Shumak RS, Catzavelos GC, Prospero LSD, Yaffe MJ, Goel V, Ram E, Chart PL, Cole DE, Taylor GA, Cutrara M, Samuels TH, Murphy JP, Murphy JM, Narod SA. Comparison of breast magnetic resonance imaging, mammography, and ultrasound for surveillance of women at high risk for hereditary breast cancer. J Clin Oncol. 2001;19:3524–3531. doi: 10.1200/JCO.2001.19.15.3524. [DOI] [PubMed] [Google Scholar]
- 5.Su MY, Muhler A, Lao X, Nalcioglu O. Tumor characterization with dynamic-contrast enhanced MRI using MR contrast agents of various molecular weights magnetic resonance in medicine. Magn Reson Med. 1998;39:259–269. doi: 10.1002/mrm.1910390213. [DOI] [PubMed] [Google Scholar]
- 6.Gulsen G, Unlu MB, Birgul O, Nalcioglu O, Azar FS, editors. Proc SPIE. Vol. 6431. 2007. Simultaneous monitoring of multiple contrast agents using a hybrid MR-DOT system; p. 64310D. [Google Scholar]
- 7.Gulsen G, Xiong B, Birgul O, Nalcioglu O. Design and implementation of a multifrequency near-infrared diffuse optical tomography system. J Biomed Opt. 2006;11:014020. doi: 10.1117/1.2161199. [DOI] [PubMed] [Google Scholar]
- 8.Unlu MB, Birgul O, Shafiiha R, Gulsen G, Nalcioglu O. Diffuse optical tomographic reconstruction using multifrequency data. J Biomed Opt. 2006;11:054008. doi: 10.1117/1.2363370. [DOI] [PubMed] [Google Scholar]
- 9.Merritt S, Bevilacqua F, Durkin AJ, Cuccia DJ, Lanning R, Tromberg BJ, Gulsen G, Yu H, Wang J, Nalcioglu O. Coreg-istration of diffuse optical spectroscopy and magnetic resonance imaging in a rat tumor model. Appl Opt. 2003;42:2951–2959. doi: 10.1364/ao.42.002951. [DOI] [PubMed] [Google Scholar]
- 10.Yuan B, Chen N, Zhu Q. Emission and absorption properties of indocyanine green in Intralipid solution. J Biomed Opt. 2004;9:497–503. doi: 10.1117/1.1695411. [DOI] [PMC free article] [PubMed] [Google Scholar]
- 11.Su MY, Wang Z, Carpenter PM, Lao X, Muhler A, Nalcioglu O. Characterization of N-ethyl-N-nitrosourea-induced malignant and benign breast tumors in rats by using three MR contrast agents. J Magn Reson Imaging. 1999;9:177–186. doi: 10.1002/(sici)1522-2586(199902)9:2<177::aid-jmri5>3.0.co;2-8. [DOI] [PubMed] [Google Scholar]