

Abstract
Signal transduction depends critically on the spatial localization of protein constituents. A key question in odor transduction is whether chemotransduction proteins organize into discrete molecular complexes throughout olfactory cilia or distribute homogeneously along the ciliary membrane. Our recordings of Ca2+ changes in individual cilia with unprecedented spatial and temporal resolution using two-photon microscopy provide solid evidence for Ca2+ microdomains (transducisomes). Dissociated frog olfactory neurons were preloaded with caged-cAMP and Fluo-4 Ca2+ indicator. Ca2+ influx through cyclic nucleotide-gated (CNG) channels was evoked by uniformly photoreleasing cAMP, while measuring ciliary Ca2+. Discrete fluorescence events were clearly resolved. Events were missing in the absence of external Ca2+, consistent with the absence of internal Ca2+ sources. Fluorescence events at individual microdomains resembled single-CNG channel fluctuations in shape, mean duration and kinetics, indicating that transducisomes typically contain 1–3 CNG channels. Inhibiting the Na+/Ca2+ exchanger or the Ca2+-ATPase prolonged the decay of evoked intraciliary Ca2+ transients, supporting the participation of both transporters in ciliary Ca2+ clearance and suggesting that both molecules localize close to the CNG. Chemosensory transducisomes provide a physical basis for the low amplification and for the linearity of odor responses at low odor concentrations.
Keywords: Calcium, microdomains, Ca2+ fluorescence, odor transduction, olfactory neuron, cyclic nucleotide-gated channels
INTRODUCTION
Odor transduction takes place in the cilia of the sensory neurons of the olfactory epithelium. Odor binding to specific receptors triggers a Golf-mediated cascade where activation of adenylyl cyclase III (ACIII) raises cAMP concentration. This nucleotide directly gates ciliary cyclic nucleotide-gated (CNG) channels (Schild and Restrepo, 1998), mediating the influx of Ca2+ ions that elicit the opening of Ca2+-activated Cl−(ClCa) channels. Since Cl− concentration is higher in the ciliary lumen compared to the external mucus, both channels contribute to cell depolarization (Kurahashi and Yau, 1993; Lowe and Gold, 1993). Intracellular Ca2+ also plays a key role in olfactory adaptation, largely by decreasing CNG channel affinity for cAMP (Chen and Yau, 1994).
Olfactory cilia (<0.2 μm diameter, 5 to a few hundred μm long, depending on the species) are devoid of internal organelles (Menco, 1992), making the extracellular milieu the only source and sink of Ca2+. In the ciliary membrane, a Na+/Ca2+ exchanger (NCX) (Reisert and Matthews, 1998) and a Ca2+-ATPase (PMCA) (Castillo et al., 2007; Antolin et al., 2010) are the transporters responsible for Ca2+ clearance. It is possible that Ca2+ increases are confined to the local microenvironment around individual CNG channels, as with other Ca2+-permeant channels (Naraghi and Neher, 1997; Fakler and Adelman, 2008). Takeuchi and Kurahashi (2008) measured electrical responses of similar amplitude to identical cAMP increments evoked in separate micrometer long segments of individual olfactory cilia, arriving to the conclusion that there was no interaction between adjacent segments of that size. On the other hand, Bhandawat et al. (2005) reported evidence that odor responses are built of small elementary units, consistent with the notion that odor transduction is organized into small protein ensembles involving a remarkably low gain. Here we directly test for the presence of the hypothetical submicrometer ciliary Ca2+ microdomains, whose spatial organization and relative location might be relevant for the dynamics and amplification of signal transduction.
MATERIALS AND METHODS
Isolation of olfactory sensory neurons
Adult frogs (Rana pipiens) were anesthetized by cooling on ice, killed by decapitation and pithed. All procedures were approved by the animal care and use committee of the University of Colorado Denver. Olfactory epithelia were removed, cut into small pieces (~1 mm2) and maintained for less than 8 h at 4°C in frog Ringer’s solution. To dissociate the cells, pieces of tissue were torn apart with fine tweezers, passed 3 times through a fire-polished Pasteur pipette and filtered through a 70 μm mesh (Falcon). The cells were allowed to settle on a number 0 coverglass coated with CellTAK (BD Biosciences) to attach the cells, in order to avoid movement of the cilia.
Solutions
Normal Ringer’s (in mM): 115 NaCl, 2.5 KCl, 2 CaCl2, 0.4 MgCl2, 10 HEPES, 10 glucose, pH 7.5; 0-Ca2+ Ringer’s: 115 NaCl, 2.5 KCl, 0.4 MgCl2, 10 HEPES, 1 EGTA (no Ca2+ added), 10 glucose, pH 7.5; Li+-Ringer’s, 115 LiCl, 2.5 KCl, 2 CaCl2, 0.4 MgCl2, 10 HEPES, 10 glucose, pH 7.5. The PMCA blocker 5-(and-6)-carboxyeosin diacetate, succinimidyl ester (CE, 50 μM; Molecular Probes, Eugene OR) or the PDE inhibitor 3-Isobutyl-1-methylxanthine (IBMX, 1 mM) were added to Normal Ringer’s, when needed. Chemicals were purchased from Sigma Chemical (St. Louis, MO), unless otherwise specified.
Calcium measurements in olfactory cilia
Cells were preincubated at room temperature for 40 min in Ringer’s solution supplemented with 10 μM of Fluo-4 acetoxymethyl ester probe (Fluo-4 AM, Molecular Probes) and then washed twice (10 min each) with Ringer’s solution. Cells were then incubated for at least 25min previous to the experiment in extracellular solution supplemented with 250 μM of the cell-permeable caged-cAMP (4,5-dimethoxy-2-nitrobenzyl adenosine 3’,5’-cyclicmonophosphate, Molecular Probes). Cilia presenting a straight segment of at least 5 μm were chosen for Ca2+ fluorescence measurements under line raster scan mode.
All measurements were made with a two photon microscope (Zeiss, model LSM-510 NLO), equipped with a Ti:sapphire laser running at 795 nm, and were visualized with a 40X or 63X water immersion objective. Fluo-4 emission was collected using 500-550 nm bandpass filters.
To uncage cAMP, we placed an optic fiber (250 μm diameter) transmitting UV light flashes (0.5 to 1 ms) delivered from a Xenon flash lamp system (JML-C2, Rapp Optoelectronic) directly under the coverglass that held the cells. The beam from the optic fiber was centered within the focal field, where the cell was positioned. A scan line was positioned along a straight segment of a cilium and scanned every 3 ms or less during 1 to 3 min, providing measurement of Ca2+ fluorescence changes as function of time and distance in a ciliary segment. Time resolution was similar, but not identical throughout experiments, because it depended on the length of the segment examined, being higher for shorter segments than for longer ones (range 1.9 – 3.0 ms). The time resolution of our fluorescent recordings is comparable to that of previous studies on Ca2+-permeant channels using the same fluorescent probe, under TIRF microscopy (Shuai and Parker, 2005; Demuro and Parker, 2006). To test the possibility that transient fluorescence events could be artifact of non-biological origin, we conducted line-scan fluorescence measurements in external solution containing the fluorophore (in its cell-impermeant form) at a concentration (10 μM) that would result in emission of light with intensities in the same range as the fluorescence measured from the cells) and three different Ca2+ concentrations. These measurements gave a rather uniform fluorescence signal, completely devoid of transient events, strongly supporting the biological origin of the transient fluorescence signals recorded from the cilia.
Analysis of Ca2+ fluorescence measurements
The time course of transient Ca2+ signals was quantified over a particular region of the recording where a Ca2+ signal was evident. Normalized fluorescence (ΔF/Fi) vs. time was plotted (Fig 1D, H and Fig. 2D and H). Fi was the basal average fluorescence intensity in the same ciliary segment before exposure of the cilium to the UV light flash, while ΔF was the fluorescence intensity at any time point minus Fi. The time at which the Ca2+ signal declined to half its peak value (τ0.5) was measured for each experimental situation.
Figure 1. Localized cAMP-induced Ca2+ increases in olfactory cilia.
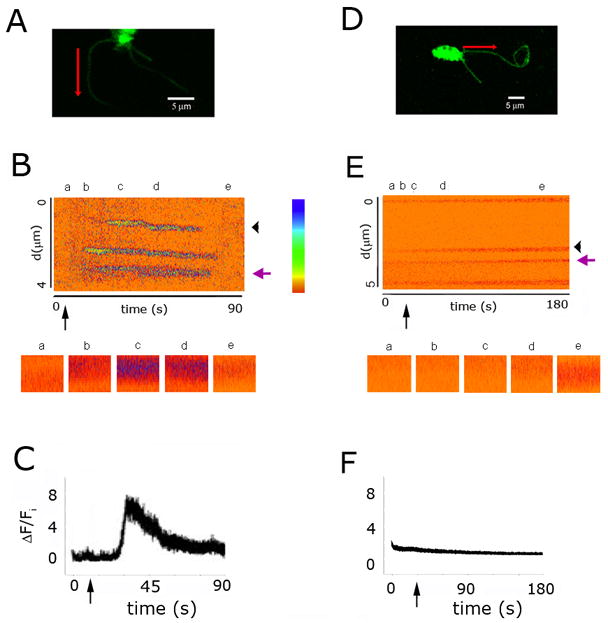
A, Dendritic knob and cilia of an olfactory receptor neuron preloaded with Fluo-4 and caged-cAMP. The red arrow denotes the cilium segment from where the emission of fluorescence was collected and the direction of the scan. B, Ca2+ fluorescence changes along the cilia segment; ordinate: time, abscissa: distance; relative fluorescence intensity is color-coded, according to calibration bar. The five insets underneath the fluorescence recording show details of it at indicated the times (a-f0. Black arrow: time of the photoreleasing UV-flash. Violet arrow: ciliary segment from where insets were taken, at the times pointed out with asterisks. Black arrowhead: segment from where ΔF/Fi (C) was obtained. C, Time-course of the fluorescence change (ΔF/Fi) for a selected ciliary region (black arrowhead in B). Relaxation half time, τ0.5 = 11 s. D, Another olfactory neuron, bathed in 0-Ca2+ Ringer’s solution. E. Ca2+ fluorescence in the ciliary segment. F, Relative fluorescence upon cAMP release. Labels as in A-C. Relative fluorescence was calculated by dividing fluorescence intensity by the average fluorescence intensity in the entire cilium for the period preceding cAMP photorelease.
Figure 2. Effects of inhibiting PMCA and NCX on Ca2+ microdomains and Ca2+ clearance.
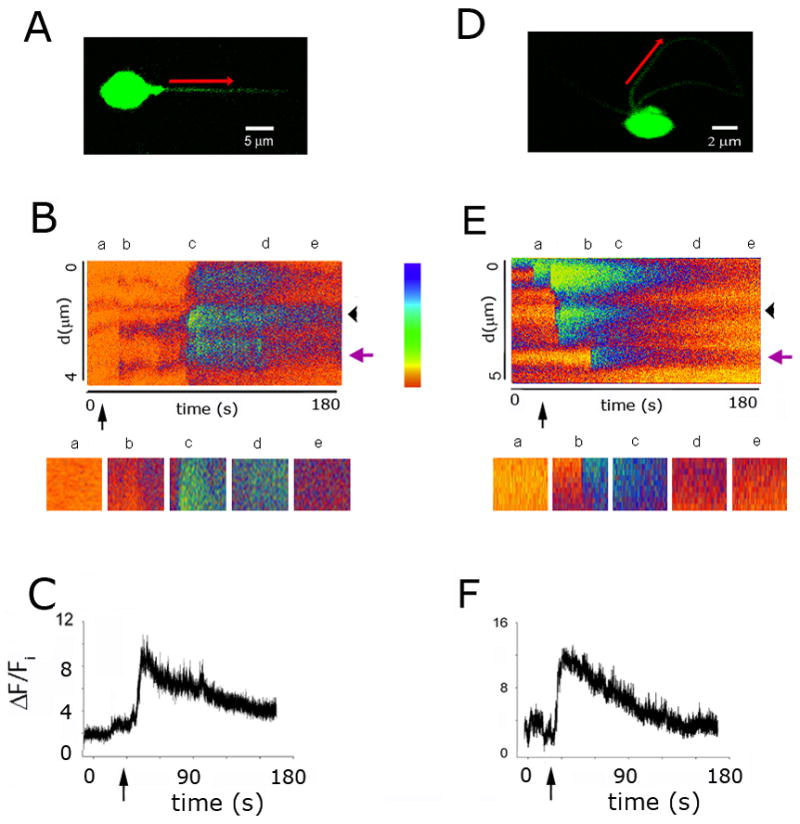
A, Olfactory receptor neuron incubated in 50 μM carboxyeosin to inhibit PMCA, with red arrow indicating the olfactory cilia segment studied and direction of the scan. B, Ca2+ fluorescence changes along the cilia. C, Time-course of the fluorescence change for a selected region in the cilium. Relaxation half-time, τ0.5 = 34 s. D, Ciliary segment of another olfactory neuron examined under Ringer’s-Li+ solution to abolish NCX activity. E, Fluorescence change as a function of distance and time. F, Time-course of fluorescence decay; τ0.5 = 31 s. Labels as in Fig 1.
To characterize the individual fluorescent events, a small zone where Ca2+ increments occurred was chosen (5 pixels, ~0.15 μm of cilium) and the events were quantified before and after cAMP release. In order to differentiate significant Ca2+ signals from basal noise, a discriminating line was defined as 2 standard deviations above the average value of the basal fluorescence preceding CNG channels activation. There was no ambiguity on sorting out the individual fluorescence events, because the magnitude of the Ca2+ signals was generally much higher than the baseline noise. Event durations and their spatial dimensions were measured and their cumulative distribution histograms plotted (Fig. 3). Additionally, histograms of fluorescence amplitudes of the events occurring along the cilium segment at a given time as well as those taking place at a given spot on the cilium for the duration of the experiment were built for all experimental conditions. Average duration of individual fluorescence events were expressed as mean ± S.D. Differences between average values were obtained with Sigmaplot 10 (Systat Software Inc, Point Richmond, CA, USA).
Figure 3. Unitary calcium events recorded in olfactory cilia.

A, Fluorescence recordings from 3 spots, exhibiting 1, 2 and 3 amplitude levels. Fluorescence changes were normalized by dividing the change in fluorescence (ΔF) by the average basal fluorescence before the UV flash (Fi,). The ‘y’ scale has been arbitrarily scaled so that the change in fluorescence to the first level is the same for the three traces. B, Representative high-resolution fluorescence recordings from 3 individual spots of different cilia under different condition: “Control” is normal Ringer’s, “-PMCA” is Ringer’s with 50 μM CE and “-NCX” is Li+-Ringer’s. C, Plot showing the average durations of the fluorescence events under each condition; measurements from 5 spots each (mean ± S.D.; control vs. Li+: F = 8, t = −3.50, P = 0.008; control vs. CE: F = 8, t = −4.96, P = 0.001; Student’s test) D, Fluorescence intensity histograms at different conditions, each one comprising spots obtained from multiple cilia. E, Histograms showing the cumulative distribution of the spatial dimension of the fluorescent events induced by UV light for the different conditions, fitted with Gaussian functions. F. Histograms showing the cumulative distribution of the duration of the fluorescent events under the different conditions, fitted with Gaussians functions.
RESULTS
We addressed the question whether transduction-dependent Ca2+ increases in olfactory cilia take place in microdomains by examining whether discrete Ca2+ fluorescence increments are elicited by sudden uniform cAMP increments in olfactory cilia. We used two-photon microscopy, which allows measuring the spatio-temporal distribution of Ca2+ fluorescence increments with sub-micrometer and sub-millisecond resolution, with limited contribution from out of focus fluorescence and negligible photobleaching, contrary to conventional confocal microscopy (Denk et al., 1995; Denk and Svoboda, 1997). Olfactory neurons were preloaded with caged-cAMP and the Ca2+ indicator Fluo-4. cAMP was photoreleased by a UV flash. Figure 1 illustrates representative experiments conducted under 2 mM (control; A-C) and in no external Ca2+ (D-F). Line-scan fluorescence measurements were made every 3 ms or less for 180 s, in straight segments of individual cilia (Figs. 1A, D, red arrows). Multiple fluorescence spots were observed (Fig. 1B) along the cilium segment (ordinate, d) during the recording time under control solution (abscissa, t), indicating prominent Ca2+ increments at well defined spots along the cilium (see below). This is shown in further detail for different times along the experiment in the insets underneath the continuous fluorescence recording (Fig. 1B). In the experiment in Figure 1, the relative fluorescence measured in a ~0.4 μm long stretch of the cilium (Fig. 1B, black arrowhead) over the whole time of the experiment incremented following the UV flash, reached a peak at ~35 s, subsequently decaying to basal level, with a half maximal time of 11 s (Fig 1C; τ0.5 = 10.5 ± 1.9 s, mean ± S.E.M.; n = 11 of 17 cells tested). A similar experiment performed with cilia bathed in 0-Ca2+ Ringer’s solution showed only a few fluorescence events (Fig. 1E,F; n = 8), as expected because external Ca2+ is the origin of intraciliary Ca2+ increments. Thus, we refer to the cAMP-induced discrete fluorescence increases as ‘Ca2+ microdomains’. We noticed the existence of a basal frequency of fluorescence events preceding the UV flash, which may be attributed to the low spontaneous activity of the CNG channels (Kleene, 2000).
Inhibition of either of two Ca2+ transporters slows down the recovery of luminal Ca2+ level (Fig. 2), in accordance with the slackening in the relaxation of the ClCa transduction current by these pharmacological agents (Castillo et al., 2007). In the presence of the PMCA blocker carboxyeosin (CE, 50 μM), ciliary fluorescence (Fig. 2A) increased at discrete sites with a more diffuse distribution compared to control conditions (Figs. 2B) and relaxed more slowly (Fig. 2C, τ0.5 = 34 s; average τ0.5 = 30.18 ± 6.4 s, n = 8 of 14 cells tested). Abolishing NCX activity by substituting external Na+ with Li+ (Fig. 2D-F) resulted in more diffuse microdomains (Fig. 2E) and affected fluorescence decline similar to inhibiting PMCA (Fig. 2F; τ0.5 = 31 s; average τ0.5 = 28.12 ± 5.20 s, n = 6 of 11 cells tested). This evidence supports the contribution of both transporters to Ca2+ clearance.
A close examination of the recordings revealed that the evoked Ca2+ response was made up of brief discrete events (Fig 1B, insets). Strikingly, inspection of such individual fluorescence events as a function of time revealed the occurrence of square fluctuations between a small number (1–3, depending on the spot) of well defined and regularly spaced amplitude levels, closely resembling single-channel events, suggesting a stereotyped organization of CNG channels in the ciliary membrane (Fig. 3A). Respective amplitude distributions are shown besides each trace. The recordings chosen for this type of analysis correspond to those in which separate events were discernible within the fluorescence activity; we obtained recordings where this was not possible due to excessive activity (not shown), which might reflect a higher spot density as a result of higher cAMP levels attained in such experiments.
Traces from spots containing one individual channel each from the three experimental conditions tested (control, PMCA and NCX inhibited) are shown in Fig. 3B. As in control conditions, levels ranged from one to three under the different treatment conditions. The average duration of the fluorescence events for the control trace was 3.7 ms. This value incremented by nearly 50% upon abolishing either PMCA or NCX (τf = 6.5 and 6.8 ms, respectively). Average τf values for each condition (3.9 ± 0.5 ms, 6.7 ± 1.2 ms and 6.7 ± 1.7 ms, respectively; mean ± S.D.; control vs. Li+: F = 8, t = −3.50, P = 0.008; control vs. CE: F = 8, t = −4.96, P = 0.001; Student’s test) are plotted in figure 3C. Figure 3D depicts fluorescence amplitude histograms each one built with data obtained from several cilia (see figure legend), recorded under the different experimental conditions. Remarkably, all histograms display three equally spaced peaks, suggesting the presence of events with three well defined fluorescence amplitudes above the basal fluorescence level. We examined the spatial dimension of the fluorescence spots, for which we plotted the cumulative distribution of the events sizes (Fig. 3E). The events recorded under control condition were of a size at the limit of resolution of the microscope (~0.2 μm). However, the width of the spots widened when either transporter was abolished, presenting average sizes of 0.4 ± 0.5 μm under carboxyeosin and 0.4 ± 0.3 μm in Li+ solution. The cumulative distribution of the duration of the events under control condition shows an average value below the time resolution of the instrument (<2 ms), while under blockage of PMCA it incremented to 6.3 ± 3.8 ms and to 4.9 ± 3.2 ms when NCX was abolished (Fig. 3F).
DISCUSSION
In this work we determined the existence of Ca2+ microdomains comprising a small number of CNG channels in olfactory cilia and investigated Ca2+ dynamics following sudden uniform increments in intraluminal concentrations cAMP, confirming the participation of both NCX and PMCA on Ca2+ clearance.
The relaxation kinetics of the fluorescence increment is comparable with that previously observed with regular confocal microscopy in odor-stimulated salamander olfactory cilia (~7.7 s) (Leinders-Zufall et al., 1998). However, the latency of the Ca2+-fluorescence events following UV-illumination in our experiments (5–15 s) was much longer than that of the whole cell current induced by photoreleased cAMP (~0.1 s) (Takeuchi and Kurahashi, 2002; Castillo et al., 2007), its principal component being the ClCa current. Its relaxation time (~11 s) was much longer than that of the current (< 1s) as well. Our experiments do not allow us to unravel the reason for the unexpectedly long latency. One possibility is that the whole cell current, mainly carried by Cl− ions, directly depends on the free Ca2+ concentration at the internal membrane surface, which is sensed by the ClCa channels localized immediately next to the open CNG channels in the microdomain (these can be as close as 20 nm). Thus, a large electrical signal rapidly develops as Ca2+ concentration reaches threshold for ClCa channel activation, product of the high Ca2+ sensitivity of the Cl− channels (nM) and the important amplification of this last transduction step. If the Ca2+ changes occur in the vicinity of the ion channels (within 20 nm) it does not necessarily translate into fluorescence change because of the very weak fluorescence signal it would evoke. In contrast, the latency preceding the detectable Ca2+ fluorescence events is much longer because in spite that cAMP rises uniformly in the entire ciliary lumen, it drops very quickly to sub-threshold levels within the miniscule microdomain compartments, which comprises most ciliary PDE molecules (Cygnar and Zhao, 2009). The strong PDE barrier would greatly limit cAMP diffusion from the luminal pool to the microdomain, where its concentration would gradually build up to eventually attain threshold for CNG activation. The time that this takes depends on the concentration of cAMP at the lumen and the potency of the PDE barrier. In the present work this latency was several seconds to tens of seconds. Interestingly, Kurahashi (1990) observed that the latency of the whole cell current evoked by introducing a large concentration of cAMP (0.5 mM) with a patch pipette positioned at base of the dendrite was much longer (1.4 s) than at the dendritic knob (0.2 s). In our experiments we are not aware of the caged-cAMP concentration attained in the cell after incubation in the caged compound (250 μM), nor the concentration of photoreleased cAMP, but they may have been much less than 0.5 mM. Accordingly, it does not seem unreasonable that the fluorescence event activity was preceded by long delays.
Regarding the relaxation of the responses to photorelease cAMP, we would expect the nucleotide to rapidly decline within the microenvironment surrounding the CNG channels due to potent local PDE activity, explaining the relatively fast relaxation time of the Cl− current. But the cAMP concentration in the bulk of the cilium would take a much longer time to decline, because the PDE molecules that hydrolyze it are confined to the membrane and likely became overwhelmed by abnormally large amounts of cAMP generated by the photolysis. This is manifested by the slowly developing but sustained activity of discrete fluorescent events. Eventually cAMP drops to basal levels, ending the fluorescent events.
Besides the strikingly similar appearance between the Ca2+ fluorescence fluctuations and the single CNG channel activity recorded electrically in patches excised from the dendritic knob, the dwell time obtained from the fluorescence measurements is close to that derived from electrical measurements (τo = ~1.5 ms) (Zufall et al., 1991) with substantially higher time resolution (2,5 vs. ~0.3 KHz), indicating that the fluorescence events are manifestations of highly localized Ca2+ increments occurring as individual CNG channels open in one microdomain. The fluorescence levels indicate the number of CNG channels contained by individual microdomains. The prolongation of the dwell time occurring upon abolishment of PMCA or NCX can be explained by the retention of Ca2+ around the channel for a longer time, consistent with the participation of both transporters in ciliary Ca2+ removal.
A recent study showed that identical cAMP increments evoked in successive 1 μm segments of individual olfactory cilia induced electrical responses of similar amplitudes, leading to the conclusion that CNG channels were uniformly located along the cilium (Takeuchi and Kurahashi, 2008). However, our finding of <0.2 μm size Ca2+ microdomains suggest that if several of them activate within a 1 μm ciliary segment, the resulting electrical responses to identical stimuli would be alike. The existence of microdomains was questioned by Reisert and co-workers (2003), based on studies with inside-out patches excised from dendritic knob, some of which might have additionally contained cilia. From cAMP-evoked multichannel Cl− currents recorded at various Ca2+ buffer concentrations, they concluded that CNG and ClCa channels were ~120 nm apart, a distance incompatible with co-localization into a transducisome. However, there is no reason to expect a similar molecular organization or spatial distribution of channels in the cilia and knob membranes nor there is any evidence that the ClCa channels in the knob are the same as those in the cilia.
The small number of CNG channels in the microdomains suggests that the odor transduction cascade involves low amplification, where the odor binding to a single receptor would lead to the opening of very few (typically 3 or less) CNG channels and a limited number of ClCa channels surrounding each CNG in discrete sparse microdomains. This result is in agreement with the notion that at low concentration odor responses are the linear summation of multiple elementary responses of extremely small amplitude (Bhandawat et al., 2005). This observation is based on the statistical analysis of responses to brief odorant stimuli of low concentration, where the dose-response relation was evidently linear. A key consideration was that the OR-Golf interaction time is brief (~0.1 ms), implying that an odor receptor has a low probability of activating one Golf protein when it binds an odor molecule. On the other hand, as for other Ca2+-conducting channels, a pronounced Ca2+ profile around a CNG channel limits to tens of nanometers from the mouth of this channel the distance at which Ca2+ concentration is sufficient for ClCa activation (Naraghi and Neher, 1997; Bauer, 2001). Therefore, it is reasonable to postulate that the CNG and the ClCa channels would localize to the Ca2+ microdomains, and that the number of ClCa channels that can be housed and be functional within the microdomain cannot be large. Assuming that most of the area immediately surrounding a CNG where [Ca2+] attains threshold for ClCa activation is occupied by ClCa and a few transporter molecules, and a diameter of these proteins of 10 nm (Long et al., 2005; Fakler and Adelman, 2008), less than 10 ClCa channels would fit in such area. Beyond this area, Ca2+ increments would be insufficient for opening ClCas (Fig. 4). This conclusion has an important implication regarding the characteristics of the ClCa channel, currently under debate (Frings et al., 2000; Kleene, 2009). As the Cl− current associated to a single CNG channel is 3 to 4 times the cationic current (Lowe and Gold, 1993), the number of ClCa in a microdomain must be sufficient to allow such anionic current, but it shall not exceed the quantity of channels that sterically fits in it. This number is directly related to the single ClCa channel conductance; if its conductance were 1 pS (Reisert et al., 2003; Pifferi et al., 2006; Pifferi et al., 2009; Stephan et al., 2009) and as one CNG channel conducts 0.08 pA at −55 mV (Zufall and Firestein, 1993), 5-6 ClCa channels would be required to conduct 0.32 pA, in agreement with the model of Fig 4. This implies that under physiological conditions an elementary response would be undetectable, and several of such responses should occur simultaneously in the cilia of an olfactory neuron to be physiologically significant. This is in agreement with the notion that vertebrate olfactory receptor neurons are incapable of responding to individual odorant molecules (Paysan and Breer, 2001). Interestingly, elements capable of sustaining macromolecular complexes exist in olfactory cilia, such as scaffolding proteins (Saavedra et al., 2008) or lipid rafts (Schreiber et al., 2000), although it is still unclear whether they play such a role.
Figure 4.

Model of an olfactory cilium transducisome. The model depicts one transducisome (actually half of it, for convenience) as suggested by our results, next to the profile of free Ca2+ concentration as a function of distance from the mouth of a single Ca2+-permeant channel, in this case a cyclic nucleotide-gated channel, adapted from (Naraghi and Neher, 1997). The CNG is surrounded by multiple ClCa channels, whose only Ca2+ source is the CNG channel. The K0.5 range of ClCa for Ca2+, 1–5 μM (Kleene and Gesteland, 1991; Reisert et al., 2003), is indicated by a bar beside the ordinate, projected to the distance axis. Proteins have been assigned an estimated size of ~10 nm (Fakler and Adelman, 2008). According to the model, [Ca2+] drops below threshold for ClCa activation beyond the second row of proteins surrounding the CNG, implying that if there were further ClCa in the transducisome, they could not open. As the Ca2+ transporters and protein constituents of the transduction cascade are likely to be part of the transducisome as well, the number of ClCa within the restricted transducisome area may be even smaller.
The duration and width of the microdomains were similarly incremented when either of the two Ca2+ transporters present in the olfactory cilia was abolished. These observations imply that the NCX and PMCA effectively contribute to limit the diffusion of Ca2+ away from the CNG channels, suggesting that they localize in close proximity to the CNG channels, likely being part of the microdomain. This would assure an efficient removal of calcium ions after the transduction machinery is activated.
In conclusion, our data show that Ca2+ increments in olfactory cilia that result from CNG channel opening are confined to microdomains. Each microdomain comprises one to three CNG channels. It seems likely that these channels are associated with other transduction proteins into transducisomes, giving origin to elementary odor responses that add up generating the cellular odor response. In addition, the present results strongly support the involvement of both, NCX and PMCA in the extrusion of Ca2+ and in restricting Ca2+ increases in olfactory cilia.
Acknowledgments
We thank Magdalena Sanhueza and Ricardo Delgado for discussions of early versions of this manuscript. This work was supported by grant TW007920 from the Fogarty International Center of the NIH (JB and DR), NIDCD grants DC006070 and DC04657 (DR), MIDEPLAN ICM-P05-001-F (JB), FONDECYT 1080653 (JB), MECESUP UCH0409 training research fellowship (KC), Graduate Department and Academic Affairs University of Chile (KC) and CONICYT doctoral fellowship (KC).
References
- Antolin S, Reisert J, Matthews HR. Olfactory response termination involves Ca2+-ATPase in vertebrate olfactory receptor neuron cilia. J Gen Physiol. 2010;135:367–378. doi: 10.1085/jgp.200910337. [DOI] [PMC free article] [PubMed] [Google Scholar]
- Bauer PJ. The local Ca concentration profile in the vicinity of a Ca channel. Cell Biochem Biophys. 2001;35:49–61. doi: 10.1385/CBB:35:1:49. [DOI] [PubMed] [Google Scholar]
- Bhandawat V, Reisert J, Yau KW. Elementary response of olfactory receptor neurons to odorants. Science. 2005;308:1931–1934. doi: 10.1126/science.1109886. [DOI] [PMC free article] [PubMed] [Google Scholar]
- Castillo K, Delgado R, Bacigalupo J. Plasma membrane Ca(2+)-ATPase in the cilia of olfactory receptor neurons: possible role in Ca(2+) clearance. Eur J Neurosci. 2007;26:2524–2531. doi: 10.1111/j.1460-9568.2007.05863.x. [DOI] [PubMed] [Google Scholar]
- Chen TY, Yau KW. Direct modulation by Ca(2+)-calmodulin of cyclic nucleotide-activated channel of rat olfactory receptor neurons. Nature. 1994;368:545–548. doi: 10.1038/368545a0. [DOI] [PubMed] [Google Scholar]
- Cygnar KD, Zhao H. Phosphodiesterase 1C is dispensable for rapid response termination of olfactory sensory neurons. Nat Neurosci. 2009;12:454–462. doi: 10.1038/nn.2289. [DOI] [PMC free article] [PubMed] [Google Scholar]
- Demuro A, Parker I. Imaging single-channel calcium microdomains. Cell Calcium. 2006;40:413–422. doi: 10.1016/j.ceca.2006.08.006. [DOI] [PMC free article] [PubMed] [Google Scholar]
- Denk W, Svoboda K. Photon upmanship: why multiphoton imaging is more than a gimmick. Neuron. 1997;18:351–357. doi: 10.1016/s0896-6273(00)81237-4. [DOI] [PubMed] [Google Scholar]
- Denk W, Holt JR, Shepherd GM, Corey DP. Calcium imaging of single stereocilia in hair cells: localization of transduction channels at both ends of tip links. Neuron. 1995;15:1311–1321. doi: 10.1016/0896-6273(95)90010-1. [DOI] [PubMed] [Google Scholar]
- Fakler B, Adelman JP. Control of K(Ca) channels by calcium nano/microdomains. Neuron. 2008;59:873–881. doi: 10.1016/j.neuron.2008.09.001. [DOI] [PubMed] [Google Scholar]
- Frings S, Reuter D, Kleene SJ. Neuronal Ca2+-activated Cl- channels--homing in on an elusive channel species. Prog Neurobiol. 2000;60:247–289. doi: 10.1016/s0301-0082(99)00027-1. [DOI] [PubMed] [Google Scholar]
- Kleene SJ. Spontaneous gating of olfactory cyclic-nucleotide-gated channels. J Membr Biol. 2000;178:49–54. doi: 10.1007/s002320010014. [DOI] [PubMed] [Google Scholar]
- Kleene SJ. Identifying olfaction's 'other channels'. J Physiol. 2009;587:4135–4136. doi: 10.1113/jphysiol.2009.178954. [DOI] [PMC free article] [PubMed] [Google Scholar]
- Kleene SJ, Gesteland RC. Calcium-activated chloride conductance in frog olfactory cilia. J Neurosci. 1991;11:3624–3629. doi: 10.1523/JNEUROSCI.11-11-03624.1991. [DOI] [PMC free article] [PubMed] [Google Scholar]
- Kurahashi T, Yau KW. Co-existence of cationic and chloride components in odorant-induced current of vertebrate olfactory receptor cells. Nature. 1993;363:71–74. doi: 10.1038/363071a0. [DOI] [PubMed] [Google Scholar]
- Leinders-Zufall T, Greer CA, Shepherd GM, Zufall F. Imaging odor-induced calcium transients in single olfactory cilia: specificity of activation and role in transduction. J Neurosci. 1998;18:5630–5639. doi: 10.1523/JNEUROSCI.18-15-05630.1998. [DOI] [PMC free article] [PubMed] [Google Scholar]
- Long SB, Campbell EB, Mackinnon R. Crystal structure of a mammalian voltage-dependent Shaker family K+ channel. Science. 2005;309:897–903. doi: 10.1126/science.1116269. [DOI] [PubMed] [Google Scholar]
- Lowe G, Gold GH. Nonlinear amplification by calcium-dependent chloride channels in olfactory receptor cells. Nature. 1993;366:283–286. doi: 10.1038/366283a0. [DOI] [PubMed] [Google Scholar]
- Menco B. Ultrastructural studies on membrane, cytoskeletal, mucous, and protective compartments in olfaction. Microsc Res Tech. 1992;22:215–224. doi: 10.1002/jemt.1070220303. [DOI] [PubMed] [Google Scholar]
- Naraghi M, Neher E. Linearized buffered Ca2+ diffusion in microdomains and its implications for calculation of [Ca2+] at the mouth of a calcium channel. J Neurosci. 1997;17:6961–6973. doi: 10.1523/JNEUROSCI.17-18-06961.1997. [DOI] [PMC free article] [PubMed] [Google Scholar]
- Paysan J, Breer H. Molecular physiology of odor detection: current views. Pflugers Arch. 2001;441:579–586. doi: 10.1007/s004240000492. [DOI] [PubMed] [Google Scholar]
- Pifferi S, Dibattista M, Menini A. TMEM16B induces chloride currents activated by calcium in mammalian cells. Pflugers Arch. 2009 doi: 10.1007/s00424-009-0684-9. [DOI] [PubMed] [Google Scholar]
- Pifferi S, Pascarella G, Boccaccio A, Mazzatenta A, Gustincich S, Menini A, Zucchelli S. Bestrophin-2 is a candidate calcium-activated chloride channel involved in olfactory transduction. Proc Natl Acad Sci U S A. 2006;103:12929–12934. doi: 10.1073/pnas.0604505103. [DOI] [PMC free article] [PubMed] [Google Scholar]
- Reisert J, Matthews HR. Na+-dependent Ca2+ extrusion governs response recovery in frog olfactory receptor cells. J Gen Physiol. 1998;112:529–535. doi: 10.1085/jgp.112.5.529. [DOI] [PMC free article] [PubMed] [Google Scholar]
- Reisert J, Bauer PJ, Yau KW, Frings S. The Ca-activated Cl channel and its control in rat olfactory receptor neurons. J Gen Physiol. 2003;122:349–363. doi: 10.1085/jgp.200308888. [DOI] [PMC free article] [PubMed] [Google Scholar]
- Saavedra MV, Smalla KH, Thomas U, Sandoval S, Olavarria K, Castillo K, Delgado MG, Delgado R, Gundelfinger ED, Bacigalupo J, Wyneken U. Scaffolding proteins in highly purified rat olfactory cilia membranes. Neuroreport. 2008;19:1123–1126. doi: 10.1097/WNR.0b013e3283086797. [DOI] [PubMed] [Google Scholar]
- Schild D, Restrepo D. Transduction mechanisms in vertebrate olfactory receptor cells. Physiol Rev. 1998;78:429–466. doi: 10.1152/physrev.1998.78.2.429. [DOI] [PubMed] [Google Scholar]
- Schreiber S, Fleischer J, Breer H, Boekhoff I. A possible role for caveolin as a signaling organizer in olfactory sensory membranes. J Biol Chem. 2000;275:24115–24123. doi: 10.1074/jbc.M001876200. [DOI] [PubMed] [Google Scholar]
- Shuai J, Parker I. Optical single-channel recording by imaging Ca2+ flux through individual ion channels: theoretical considerations and limits to resolution. Cell Calcium. 2005;37:283–299. doi: 10.1016/j.ceca.2004.10.008. [DOI] [PubMed] [Google Scholar]
- Stephan AB, Shum EY, Hirsh S, Cygnar KD, Reisert J, Zhao H. ANO2 is the cilial calcium-activated chloride channel that may mediate olfactory amplification. Proc Natl Acad Sci U S A. 2009;106:11776–11781. doi: 10.1073/pnas.0903304106. [DOI] [PMC free article] [PubMed] [Google Scholar]
- Takeuchi H, Kurahashi T. Photolysis of caged cyclic AMP in the ciliary cytoplasm of the newt olfactory receptor cell. J Physiol. 2002;541:825–833. doi: 10.1113/jphysiol.2002.016600. [DOI] [PMC free article] [PubMed] [Google Scholar]
- Takeuchi H, Kurahashi T. Distribution, amplification, and summation of cyclic nucleotide sensitivities within single olfactory sensory cilia. J Neurosci. 2008;28:766–775. doi: 10.1523/JNEUROSCI.3531-07.2008. [DOI] [PMC free article] [PubMed] [Google Scholar]
- Zufall F, Firestein S. Divalent cations block the cyclic nucleotide-gated channel of olfactory receptor neurons. J Neurophysiol. 1993;69:1758–1768. doi: 10.1152/jn.1993.69.5.1758. [DOI] [PubMed] [Google Scholar]
- Zufall F, Firestein S, Shepherd GM. Analysis of single cyclic nucleotide-gated channels in olfactory receptor cells. J Neurosci. 1991;11:3573–3580. doi: 10.1523/JNEUROSCI.11-11-03573.1991. [DOI] [PMC free article] [PubMed] [Google Scholar]