

Abstract
Global measurements of the lung provided by standard pulmonary function tests do not give insight into the regional basis of lung function and lung disease. Advances in imaging methodologies, computer technologies, and subject-specific simulations are creating new opportunities for studying structure-function relationships in the lung through multi-disciplinary research. The digital Human Lung Atlas is an imaging-based resource compiled from male and female subjects spanning several decades of age. The Atlas comprises both structural and functional measures, and includes computational models derived to match individual subjects for personalized prediction of function. The computational models in the Atlas form part of the Lung Physiome project, which is an international effort to develop integrative models of lung function at all levels of biological organization. The computational models provide mechanistic interpretation of imaging measures; the Atlas provides structural data upon which to base model geometry, and functional data against which to test hypotheses. The example of simulating air flow on a subject-specific basis is considered. Methods for deriving multi-scale models of the airway geometry for individual subjects in the Atlas are outlined, and methods for modeling turbulent flows in the airway are reviewed.
Keywords: Computed tomography imaging, Physiome, Respiratory system, Predictive models, Computational fluid dynamics, Drug transport
Understanding the complex dynamics of the pulmonary system and the lung’s response to disease, injury, and treatment is fundamental to the advancement of pulmonary medicine; however the global measurements obtained via clinical pulmonary function tests do not adequately capture lung complexity and may only be minimally altered by significant local disease. Quantifiable image-based measures, including evaluation of static and dynamic structure and function, are now recognized as very sensitive indicators of localized subclinical disease and appear to describe complex lung processes much better than global measurements [1]. Dramatic advances in imaging methodologies including multidetector row CT (MDCT), hyperpolarized gas MRI, positron emission tomography (PET), and single photon emission tomography (SPECT), in parallel with advances in computer technologies and subject-specific simulations is creating new opportunities for studying structure-function relationships in the lung through truly multi-disciplinary research. For example, development of a subject-specific model for ventilation of a breathing lung can only be accomplished through multi-disciplinary efforts that require expertise in medical imaging, airway geometric reconstruction, computational techniques, pulmonary physiology and medicine, and fluid mechanics.
Anatomically and biophysically based computational models of human or animal physiology provide a means to integrate vast amounts of data across many spatial and temporal scales into a framework that can be linked to whole-body physiology and clinical medicine. Development of pulmonary models that can be customized to a human or animal subject means that an individual’s structure can be linked to personalized predictions of function [2–5]. These developments form part of the Lung Physiome Project (www.physiome.org.nz), a public domain effort to develop integrative models at all levels of biological organization, from genes to the whole organism. The lung is a unique internal organ in that with each breath it interacts directly with the environment. This can have long term consequences on the structure of the airway tree [6], or an immediate consequence for the asthmatic lung. Pathologic changes in the lung are slow to develop, heterogeneous, and multiple pathologic processes intermingle; this points to a fundamental need for sensitive, quantitative measures of phenotypic outcomes, and interpretive computational models to differentiate between interacting mechanisms.
A goal of the Lung Physiome is to curate peer-reviewed models and data in a standardized format, facilitating model sharing and minimizing the need for scientists to reimplement existing models. A parallel project developing a digital Human Lung Atlas [7–10] aims to use imaging measures to quantify normal lung structure and pathological ranges of departure from normal, along with standard and imaging-based functional measurements. The Human Lung Atlas provides the primary imaging database for the Lung Physiome, and conversely the Physiome models provide an interpretive tool to link structure and function in the Atlas. This review focuses primarily on the link between the Atlas and the Physiome, considering the derivation of subject-specific models of the airway tree, and their emerging application in studying individualized computation of air flow.
Imaging-based models of the airway tree
The conducting airways in the mammalian lung comprise an extensive asymmetric branching structure, however all computational studies of function in the conducting airways rely on at least some simplifications of the airway geometry due to constraints on computer memory and computing time. The airway tree can be simplified by assuming that the tree has symmetry [11] or regular asymmetry of branching [12] and/or by modelling it as a one-dimensional (1D) structure and integrating the governing equations for function over the circular cross-section of the airways [13–15], or by only simulating within a subset of the tree in three-dimensional (3D) space [16, 17].
Two classic simplifications of the airway tree are Weibel’s symmetric model A [11], and the Horsfield Δ model with regular asymmetry of branching [12]. Both models are based on measurements made on casts of the airway tree [11, 18]. Both of these models provide a convenient simplification of the complex branching airway tree, and are still widely used for computational studies because they summarize detailed anatomical measurements into idealized structures that are relatively easily used and computationally inexpensive. These ‘simplified’ models are necessary for computing analytic solutions, however, neither model directly includes spatial information, and they cannot be used to predict function on a subject-specific basis.
Weibel and Horsfield relied on measuring airways from casts of the airway tree. Modern imaging provides a high resolution tool with which to measure and define the lung. Early imaging-based studies measured the geometry of the airway tree [19]; later work used imaging to derive models of the airway tree geometry and connectivity [4, 20–23]. These anatomically based models are specific to an imaged individual rather than seeking to be representative of a population. The airway model geometry can be anatomically-accurate in two ways: 1) it follows the centerlines of the airways to define a 1D tree [4, 20], or 2) it conforms to surface data of the airways segmented from medical imaging [21–23].
The first type of anatomically-accurate, spatially distributed 1D model for the airway tree can be derived by tracing the bifurcating airway paths using imaging of airway casts from an excised lung [20] or imaging of the in vivo lung [4]. Schmidt et al. [20] derived a digital reference model of the human bronchial tree over 17 Horsfield orders, using CT scanning of an airway cast. This study provided further insight into airway branching geometry, demonstrating multi-fractal properties in the bronchial airway tree, but it is not a method that can be used to generate geometric models for the in vivo lung. Using an airway cast to define the branching geometry has the advantage of defining connectivity through an extensive airway tree, but casting potentially introduces geometric distortion of the tissue, is representative of a single filling pressure, and it does not extend through the entire conducting airway system. It is also not applicable to deriving individualized models for living subjects.
Physiome models of the airway from the Human Lung Atlas
The Human Lung Atlas
X-ray CT is currently the imaging modality of choice for comprehensive evaluation of the lung. Scanners are now capable of sub half second data acquisition (330 msec per rotation and faster), allowing for the imaging of not only anatomy [24] but also ventilation [25–27] and perfusion [28], providing unprecedented structure-to-function correlations. Conventional x-ray CT is a sensitive predictor of emphysema [29], smoking-related pathophysiology [30], and pulmonary hypertension [31], compared with standards such as pulmonary function tests. An electronic CT-based deformable ‘Human Lung Atlas’ is currently being compiled as a comprehensive tool for image and model based analysis of lung disease [7–10], supported through a Bioengineering Research Partnership through the National Heart, Lung, and Blood Institute of the National Institutes of Health. Medical atlases have traditionally been illustrated texts that fully characterize an anatomical structure. With the advent of modern imaging, atlases can now be based on high resolution volumetric data, including structure and function from a range of imaging modalities. Examples of imaging-based brain atlases can be found at www.brainmaps.org and www.brain-map.org.
The Human Lung Atlas includes male and female subjects spanning several decades of life, integrating both structural and functional information from MDCT imaging and spirometry. The human female lung is smaller in volume relative to body size than the male lung [32], has smaller mean airway diameters [32] and a smaller diffusion surface[33]. Functional gender differences include greater expiratory flow limitation and increased work of breathing in the female lung during heavy exercise [34]. One goal of the Atlas is to establish the range of normality of an extensive set of both structural and functional measures of the adult human lung and to catalogue these normative values in a form which can then serve as the basis for detection of early pathology in an individual, as well as a basis for tracking the changes in an individual lung over time. A further goal is to partner imaging-based measures with computational model-based interpretation of physiological mechanisms, for analysis of structure-function relationships in lung disease.
The natural contrast between the low-density lungs and the surrounding high-density chest wall can be used to guide image segmentation [35]. Lung segmentation in the Atlas uses a fully automatic and validated algorithm [36] to first extract the lung region by gray-level thresholding, then separate the left and right lungs by identifying the anterior and posterior junctions using dynamic programming, and finally smoothing the irregular boundary along the mediastinum to obtain results consistent with manual analysis. The lobar fissures are low contrast surfaces with blurred boundaries in the cross-sectional CT images, and may be incomplete or vary between subjects. Computer-based detection of the fissures is complicated by surrounding vessels or other structures, and noise and artifacts in the images. The Atlas previously used a semi-automatic lobar fissure detection method [37], but currently utilizes an anatomic pulmonary atlas constructed from 16 volumetric CT scans of 16 subjects to guide fully automatic lobe segmentation [9]. Segmentation and analysis of the intra-thoracic airway trees utilizes the Volumetric Imaging Display and Analysis (VIDA) software [38]. Several iterations of automated algorithms for segmentation of the human airway tree have been developed for the Atlas and incorporated into VIDA. The most recent generations are based on a combination of 3D region growing and two-dimensional (2D) mathematical morphology [39], and later incorporating fuzzy logic [40]. Using this approach [40], airway trees can be successfully extracted from most clinical quality standard-dose CT data sets. Segmentation of the human airway tree at close to TLC reliably yields between six to nine generations of branches, and often up to twelve generations depending on image resolution and branch diameter. Many more branch generations can be segmented from a monopodial airway tree – such as that of the ovine lung – due to large-diameter central airways that taper without significantly changing direction [4].
Extracting the airway tree is only a first step: to perform topology-based analyses, airway tree branches must be identified, either manually [41] or automatically [42]. The binary airway tree formed in the segmentation step is skeletonized to identify the 3D centerlines of individual branches and branchpoint locations. A sequential 3D thinning algorithm [43, 44] was customized for this application. After thinning, the skeleton is smoothed, pruned, and the complete tree converted into a graph structure. The airway-tree branch-point matching algorithm utilized for the Atlas is able to find corresponding branch-points between two intra-subject scans in-vivo [40, 45]. An automatic method is used for anatomical labeling of the airways. The method is capable of assigning all 33 commonly used anatomical names to a human airway-tree [46].
Anatomical measurements of the minor and major airway diameter and cross-sectional area are made in the original gray-level MDCT volume [47]. Measurements are made in two-dimensional slices that are resampled perpendicular to the airway centerline. The measurement method has been demonstrated to achieve subvoxel accuracy (typical error ~0.1 mm) on a Plexiglas phantom, independent of airway orientation and X-ray dose [47].
Subject-specific models of the airway tree
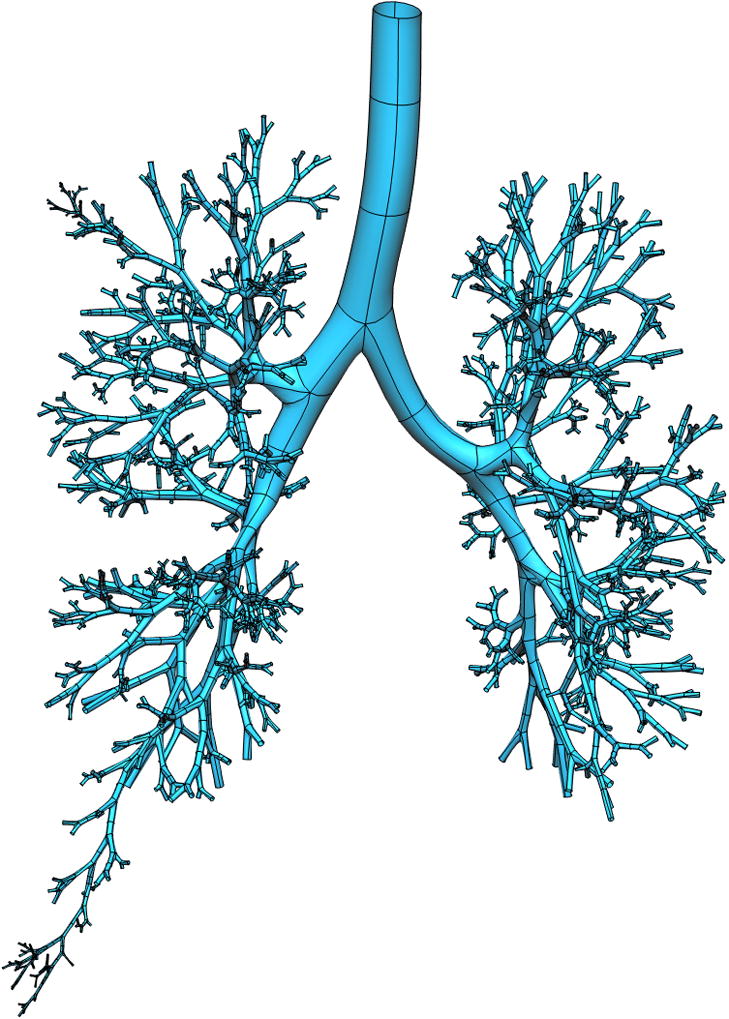
Tawhai et al. [4] derive subject-specific airway models for the Atlas subject database by supplementing in vivo imaging-based airway geometry with a volume-filling branching (VFB) method to fill a lung volume with an airway-consistent tree. Combining in vivo imaging with supplemental airways has the advantage of producing a model that is specific to an imaged subject. The airway trees created with the VFB method have been shown to be morphometrically consistent with measurements from cast [11, 12, 48] and imaging [19] studies. Individual airway trees generated for human and ovine subjects have geometry appropriate to their respective species: the human airways form a relatively symmetric bifurcating tree, whereas the sheep airways branch monopodially and hence are far more asymmetric. The generation algorithm reproduces these features in response to the shape of the lung or lobe boundary [4]. This algorithm is the only method to date that produces airway trees in anatomically-realistic lung shapes, and is the only method that has been used to generate non-human airway trees. The method has also been extended to model the pulmonary vascular trees, including the supernumerary vessels [3]. A model for one Atlas subject is shown in Figure 1.
Figure 1.


Model of the entire conducting airway tree for one subject in the Human Lung Atlas database. a) left lung airways from VFB algorithm (upper lobe yellow, lower lobe orange) and central airways fitted to MDCT imaging (grey), b) front view of the full tree, c) right lung airways from VFB algorithm (upper lobe green, middle lobe red, lower lobe blue).
The resulting model is a 1D tree with branches distributed in 3D space. To use the model for computation, diameters must be defined through the entire structure. For the imaging-based (uppermost) airways the diameters are assigned directly from calculating the diameter based on measurement of airway cross-sectional area in a plane orthogonal to the central axis. The algorithm-based airways can have diameters assigned using Horsfield or Strahler ordering [14] weighted against a ratio to parent branch diameter.
The model from [4] is a centreline (1D) tree with associated branch diameters. It is therefore equivalent in basic structure to the Weibel and Horsfield models, but with subject-specific geometry and spatial positioning of the airways. This becomes important when considering interacting function - such as the effect of changing tissue properties on airway tethering and airway collapse – or for comparison of simulated results with spatially distributed experimental results [2].
The physiologically consistent spatial distribution of airways in this 1D tree structure makes it an adequate and appropriate model for many simulation studies [2, 5, 49]. However, simulation of 3D flow and pressure via computational fluid dynamics (CFD) techniques requires a 3D structure that incorporates the salient features of the airway geometry. Previous models of the airway tree have simplified the computational domain by representing the airways as smooth cylinders, and/or have considered only a few of the up to 30 generations in the conducting airway tree [50–53]. The reason for this is clear: constructing a CFD-appropriate computational mesh of the airways is complex and time consuming, and imaging data for the lower airways is generally not attainable.
3D models of airway geometry will be considered in the next section on CFD simulation.
Computational fluid dynamics and turbulence modeling
The lungs are increasingly recognized as a potential route for delivery of systemic drugs such as insulin [54], because this avoids the hepatic metabolic pathway and may better simulate the physiological response to a food bolus. Penetration and deposition of particles within the airways depends on airway size and branching patterns, which vary between species [55]. Variation in individual airway geometry therefore makes subject-specific models essential for the study of pulmonary air flow and drug delivery. Recent evidence also suggests that early exposure to environmental pollutants has chronic, adverse effects on lung development in children [6]. Furthermore, it has been demonstrated that a strong interaction exists between lung geometry and gas properties [26], which has major implications in determining gas delivery to and clearance from the lung periphery during ventilation imaging via x-ray CT using xenon gas [25, 27, 56], or MRI using hyperpolarized helium gas [57–60]. The ability to predict air flow and particle deposition on a subject-specific basis is therefore necessary for understanding the correlation between structure and function, for assessing individual differences in vulnerability to airborne pollutants, and to provide insights into inter-subject differences in regional lung function and underlying mechanisms of pathologic developments.
CFD is now becoming a viable tool for simulation of airflow in the human respiratory tract and has been pursued by a number of researchers. The earliest studies of airway CFD used smooth cylindrical tubes merging in a single bifurcation [61], building to several bifurcations [62–65], and then incorporating imaging-defined airway surface data [21–23, 66–68]. Most of the emphasis of numerical studies has been placed on flow structure and particle deposition for drug delivery. Limitations of airway CFD studies that will be considered here are: 1) the representation of airway geometry, and 2) the treatment of turbulence. Other limitations of CFD studies not considered here but studied by others are the effects of mesh structure and grid convergence [69], the accuracy of particle tracking algorithms for sedimentation and diffusion in commercial software packages [70], and the inlet velocity profile [65]. A partial list of earlier CFD studies is given by [70], summarizing the computational packages used, parameters tested, and success in predicting experimental data. Many studies of airway CFD have been presented in the literature, for example references [16, 17, 21, 50–53, 61–65, 68–74] to name a few; the ones primarily considered here are the most recent studies that are based on medical imaging in an attempt to move towards subject-specific predictions of flow and particle transport.
Geometric models
Several studies have demonstrated the importance of anatomically accurate geometry for valid predictions of flow and particle distribution [16, 75]. Studies based on single and double bifurcation models have been concluded insufficient for analyzing particle transport and deposition in the bronchial airways [52, 71]. The velocity profiles in daughter generations after a bifurcation have been shown to be affected by the angle of rotation, viz. the azimuthal angle, between consecutive bifurcations [17, 75]. Thus, simulations that do not consider the azimuthal angle are limited in their scope. Nowak et al. [16] demonstrated major differences between Weibel symmetric and imaging-based models derived from a cadaver cast. Using the commercial software FLUENT®, they calculated airflow in generations 0–9 of a Weibel-based airway tree separated into three simulation subunits (generations 0–3, 3–6, and 6–9). Comparison with computation in a more realistic geometry showed that the velocity fields in the more accurate geometry are more complicated than predicted in the symmetric geometry. Furthermore, there was no location-to-location correspondence between the velocity field in the anatomical geometry and the symmetric geometry, and the Weibel symmetric model was found to be insufficient for predicting aerosol deposition in the human lungs.
Recognizing the need for a more accurate description of the airway bifurcation than is provided by symmetric models, Hegedus [76] presented a mathematical description of a morphologically realistic airway bifurcation, designed for CFD study, and used their method to merge several bifurcations into multiple airway geometries. One important feature of the model was to enforce a smooth transition between the airways, and rounding at the carina. Farkas et al. [77] used the model from [76] to piece together a model from generation 1 to generation 5 in the right upper lobe. They found that aerosol deposition is highly dependent on airway geometry, breathing parameters, and particle characteristics.
Lin et al. [21] demonstrated the process of constructing a realistic geometry of the upper respiratory tract from MDCT images measured from a subject in the Human Lung Atlas. The geometry included a mouth piece, the mouth, the oropharynx, the larynx, and the airways of ~6 generations. Constructing this mesh involved triangulation of the surface geometry in volumetric MDCT imaging and exporting to an STL file, which is a standard data format used in the rapid prototyping industry. The original lung geometry in this format required surface repairing, remeshing, and clipping due to rough surfaces and bad edges. Numerical simulations of airflow in the mouth-to-airway geometry were computed to study the dependence of airflow in the intra-thoracic airways on the complex oropharynx and larynx geometry. Results were compared with simulations in a model comprising only the intra-thoracic airway tree of the same subject. Most prior numerical simulations are based on idealized airway models without including the oropharynx region, therefore requiring some sort of inlet boundary condition to be specified at the trachea. Comparison of results from the two geometries suggested that turbulence induced by the laryngeal jet (and therefore only present in the mouth-to-airway model) can significantly affect airway flow patterns. In the mouth-to-airway model, a curved sheet-like turbulent laryngeal jet was formed, impinging on the rear side of the trachea with high turbulence intensity in the subglottic space and the upper trachea. The velocity distribution in the intra-thoracic airway model was a parabola with its maximum located along the centerline of the trachea and the turbulence intensity essentially zero, thus the flow was laminar. The velocity characteristics in the left and right main-stem bronchi between the two cases were also different.
Several other studies have also used imaging-based central airway geometries for analysis, [22, 23, 66], however the study of airflow in the lung must ultimately be able to span from the mouth to the alveolated airways in the lung periphery. The smaller airways – beyond approximately generations 6 to 9 in the human lung – cannot usually be visualized with current clinical imaging. Lin et al. [68] presented a method for creating subject-specific 3D and 1D coupled airway mesh structures with seamless transition between the 3D and 1D scales, incorporating the desired level of geometric detail wherever it is needed in the airway tree. Subject-specific 1D models for the entire conducting airway tree [4] are converted to a high-order (cubic Hermite) 2D surface mesh of the entire domain. The parent and child branches merge at the bifurcations with a smooth, continuous surface. The uppermost airways – for which there is MDCT surface data - are geometry fitted to enforce accurate airway surface geometry. The resulting 2D surface mesh is continuous with the surface of the algorithm-based airways. Any portion of this surface mesh can be converted to a 3D CFD-ready mesh by selecting a region of interest to study in detail. The 3D mesh is created only within those airways, and the remainder of the domain is the original 1D tree. The 3D and 1D trees are a single continuous model that has a different dimension in specified regions. An advantage of this approach is that transport can be studied in - for example – models that include successive generations, to define the conditions under which a 1D model representation will suffice.
Figure 2 illustrates the creation of a 3D CFD mesh for the subject in Figure 1. In Figure 2a a subset of airways are isolated from the full conducting airway tree (in this case every airway in generations 1 to 11), and two selected pathways that extend to the terminal bronchioles (one each in the right upper and right lower lobes). Figure 2b and c illustrate a coarse 3D CFD mesh generated within a single bifurcation structure.
Figure 2.

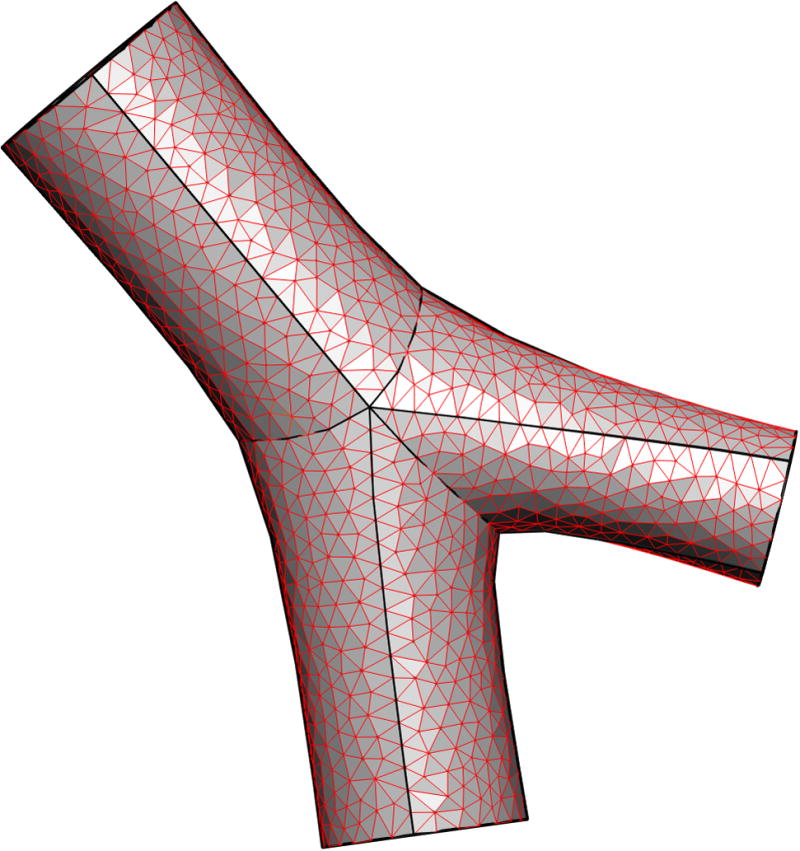
Deriving a subject-specific multiscale model for the airway tree. a) all airways from trachea to generation 11, and two paths to the terminal bronchioles, for a subject from the Human Lung Atlas database, b) a coarse 3D CFD mesh generated over a single bifurcation from a portion of the tree in a), c) enlargement of the CFD mesh for the single bifurcation.
Idealized models of the airway structure generally assume a circular cross-section. The airway cross-section can be quite irregular in shape, particularly in the trachea [78, 79], and would perhaps be better represented by an elliptical cross-section. The impact that this might have on simulation results remains to be studied.
Turbulent flow
Finlay [80] estimated the Reynolds number in various generations of simplified cylinder-based airway models, showing that the Reynolds number may be above 2,000 in the larynx - in the turbulent regime - and that the turbulence produced in the oropharynx can be convected to several generations of the tracheobronchial tree.
One approach to avoid computing complex turbulent flows is to simulate flow in small airways that are presumably well into the laminar regime [50–52, 61, 71]. This is not entirely satisfactory for two reasons: 1) in relatively short airways the flow may never be fully developed, and turbulent eddies or flow disturbance may propagate into small airways that would nominally carry laminar flow, and 2) developing an understanding of flow transport phenomena in the airway tree ultimately requires inclusion of all structures from the mouth to the most distal airways. Airway CFD studies that have included turbulence have almost all adopted Reynolds-Averaged Navier-Stokes models (RANS) models. RANS solves the Reynolds-Averaged Navier-Stokes equations, in which only the mean velocity field is resolved and all of the unsteadiness is averaged out. Thus turbulent structures are completely absent; they are simply represented by the Reynolds stress tensor. This tensor can be modeled, for example, by the k-ε model, where k is the turbulent kinetic energy and ε is the turbulent dissipation rate [81]. Experimental and numerical studies have shown that RANS models lack accuracy for this type of study. For example, Heenan et al. [82] compared measurements of the velocity field in the central plane of the human oropharynx – captured using particle image velocimetry - with numerical results computed using CFX-Tascflow® (AEA Technology Engineering) software, which is based on the RANS model. They found that although the RANS model reproduced the basic features of the flow, it did not capture the increased viscous effects at lower Reynolds numbers, suggesting the need for more development and validation of the RANS CFD methods. Stapleton et al. [72] also evaluated the applicability of the RANS approach in a model of the oropharynx, and concluded that the RANS k-ε model of turbulence is not accurate for particle tracking in the range of Reynolds numbers found in the oropharynx.
Lin et al. [21] computed flow in two imaging-based models (mouth-to-airway and intra-thoracic airway) using both Direct Numerical Simulation (DNS) and Large Eddy Simulation (LES) to resolve the turbulent structures. DNS directly solves the Navier-Stokes equations to resolve turbulent eddies at all scales, and has previously been applied to simulate low Reynolds number turbulent flows [83]. LES solves the space-filtered Navier-Stokes equations to resolve only large-scale energy-containing turbulent eddies in turbulent flows, but parameterizes small-scale ones that are not resolved with the given grid size. The effect of unresolved eddies is accounted for by the Sub Grid-Scale (SGS) Reynolds stress, which is modeled by a SGS model [76]. In Lin et al. [21], the comparison of DNS and LES results suggested that LES is sufficient to capture the turbulent laryngeal jet at a Reynolds number of 1,700 in the trachea. The presence of turbulence was found to increase the maximum localized wall shear stress three fold. To understand turbulent coherent spatial structures and their spectral signatures in a deterministic manner, the proper orthogonal decomposition technique [84] was applied to the velocity fields, showing that the turbulence was primarily attributable to Taylor-Görtler-like vortices. This study demonstrated that turbulence induced by the laryngeal jet could significantly affect airway flow patterns as well as tracheal wall shear stress, which may have pathophysiologic implications. To demonstrate the notion of subject-specific variability and the importance of individualized CFD analysis, Figure 3 shows the characteristics of the turbulent laryngeal jet in two human subjects at inspiration. Due to variations in the tracheal geometrical structure, the jet flow in the subject of Figure 3a impinges on the front side of the tracheal wall, whereas that of Figure 3b [21] impinges on the rear side. As a result, the location of the maximum wall shear stress is subject-dependent. It is also noted that the jet speed in the subject of Figure 3a is much higher than that of Figure 3b because the former has a much narrower glottis than the latter.
Figure 3.
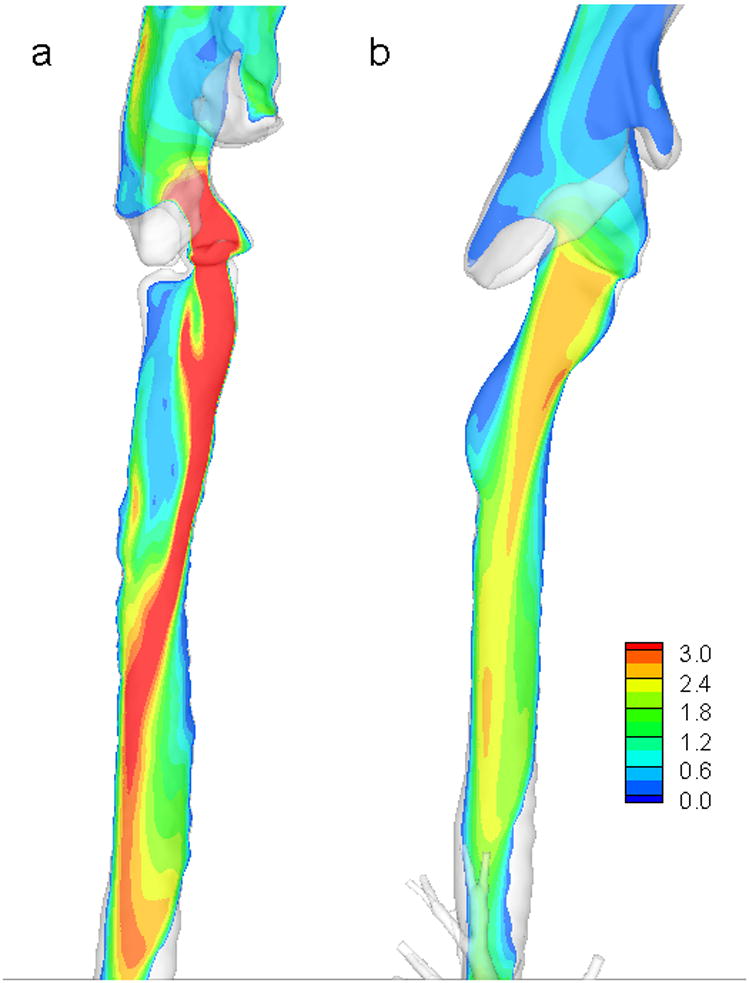
Contours of LES (large eddy simulation)-computed mean velocity magnitude of airflow in MDCT-based airway models in a vertical plane cutting through the vocal cord and the trachea for two human subjects a) and b).
To account for the multi-scale effects of pulmonary airflow and to predict realistic regional ventilation, a 1D–3D coupled CFD simulation has been demonstrated by Lin et al. [68]. For this type of simulation - assuming use of a 3D CT-based airway tree model that contains about 6 generations of airways and 5 million tetrahedral elements - the computational time needed for a breathing cycle of 4.8 seconds is approximately 90 hours running on 128 parallel CPU cores.
Further integration with the Lung Physiome
Airway CFD is a multi-scale problem, computed in what is in reality a deforming body that interacts with the surrounding tissue as the lung expands and recoils during ventilation. Predicting realistic distribution of inspired air and particulates therefore requires consideration of airway-tissue coupling through simulation of fluid structure interaction (FSI) [68] or by linking to continuum models for the tissue stress and strain [5]. This essentially provides an organ-to-tissue link. While this is an extremely important issue for realistic simulation of air flow, to date it has not been addressed in any published CFD modeling studies. To model airway deformation, Lin et al. [68] proposed two approaches. The first is achieved by mapping CT images at various lung volumes via numerical optimization, which may be most suitable for the study of structure-function relationships at the organ scale; the second approach is based upon an FSI solver, which may be most appropriate for study of interplay between gas flow and lung tissue at the local scale. The 1D–3D modeling approach proposed by Lin et al. [68] holds promise for efficient coupling with other phenomena in the lung. For example, coupling with models of lung soft tissue mechanics, or distributed models of cell function. These types of coupled model lend themselves to studying how airflow distribution is altered by changes to the regional tissue properties in the lung: an important analysis for understanding delivery of aerosolized medicine to subjects with different pathologies. As noted by Lin et al. [68], maximum localized airway wall shear stress is increased three-fold by turbulence. This may have pathophysiologic implications for reactive inflammation and fibrosis. Linking down another scale to – interactions with the epithelial cell – is therefore an essential next step. Warren et al. [85, 86] have developed a model of airway epithelial cell regulation of the periciliary liquid. The epithelial cell is known to respond to shear, so interaction between the organ and tissue level models (airway CFD, computational tissue mechanics, and FSI) and the model of the epithelial cell (a system of ordinary differential equations) will provide a whole lung prediction of how regional alteration to ventilation distribution impacts on cellular regulation of the surface liquid, and therefore determines regional clearance of mucus.
A further example of a Physiomic model of the pulmonary system that was partly developed from the Human Lung Atlas and that spans organ to cell is the work by Burrowes et al. [2, 87–89] studying perfusion of the lung. In this series of papers blood is modeled as a two-phase fluid in a morphometrically based segmented (tube) model of the alveolo-capillary network, and as a Newtonian fluid in the arteries and veins. Flow in the elastic large vessels is estimated using 1D Navier-Stokes equations, and includes a gravitational term. The transit time for blood cells through the microcirculation is calculated for different regional pressure boundary conditions. A current limitation of the work is that the microcirculatory and arterial/venous models remain as separate entities; coupling these systems is necessary for studying regional gas exchange [90].
Conclusion
The Human Lung Atlas and the Lung Physiome are two major synergistic projects that together and individually are providing new insights into lung structure and function. The Atlas provides a comprehensive database of subjects with different pathologies from which computational models can be developed to predict disease-specific function and to interrogate hypotheses such as the principles that govern the regional distribution of ventilation and perfusion [2]. Anatomical customized models of different individuals or different species can be used to probe the sensitivity of predictions to differences in geometry, whether subtle (normal temporal change in airway caliber of an individual) or major (between species). An important feature of an anatomically-based model is that it should be able to be reduced to a more simplified form, to facilitate understanding of the more complex model via analytic solutions or established mathematical analysis [91]. The anatomical models reviewed here are not the ‘best’ tool for all computational studies, but they are necessary for airway CFD and other situations where heterogeneity in the tree structure [49], or spatially-dependent interaction with the surrounding tissue [5], is important.
Acknowledgments
This work was supported in part by NIH Grants R01-HL-064368 and R01-EB-005823.
Contributor Information
Merryn H Tawhai, Email: m.tawhai@auckland.ac.nz, The University of Auckland.
Eric A Hoffman, Email: eric-hoffman@uiowa.edu, The University of Iowa.
Ching-Long Lin, Email: ching-long-lin@uiowa.edu, The University of Iowa.
References
- 1.Hoffman EA, Reinhardt JM, Sonka M, Simon BA, Guo J, Saba O, Chon D, Samrah S, Shikata H, Tschirren J, Palagyi K, Beck KC, McLennan G. Characterization of the interstitial lung diseases via density-based and texture-based analysis of computed tomography images of lung structure and function. Acad Radiol. 2003;10(10):1104–1118. doi: 10.1016/s1076-6332(03)00330-1. [DOI] [PubMed] [Google Scholar]
- 2.Burrowes K, Tawhai M. Computational predictions of pulmonary blood flow gradients: gravity versus structure. Respir Physiol Neuro. 2006;154(3):515–23. doi: 10.1016/j.resp.2005.11.007. [DOI] [PubMed] [Google Scholar]
- 3.Burrowes KS, Hunter PJ, Tawhai MH. Anatomically-based finite element models of the human pulmonary arterial and venous trees including supernumerary vessels. J Appl Physiol. 2005;99:731–738. doi: 10.1152/japplphysiol.01033.2004. [DOI] [PubMed] [Google Scholar]
- 4.Tawhai MH, Hunter PJ, Tschirren J, Reinhardt JM, McLennan G, Hoffman EA. CT-based geometry analysis and finite element models of the human and ovine bronchial tree. J Appl Physiol. 2004;97(6):2310–2321. doi: 10.1152/japplphysiol.00520.2004. [DOI] [PubMed] [Google Scholar]
- 5.Tawhai MH, Nash MP, Hoffman EA. An imaging-based computational approach to model ventilation distribution and soft tissue deformation in the ovine lung. Acad Radiol. 2006;13(1):113–120. doi: 10.1016/j.acra.2005.09.088. [DOI] [PubMed] [Google Scholar]
- 6.Gauderman WJ, Avol E, Gilliland F, Vora H, Thomas D, Berhane K, McConnell R, Kuenzli N, Lurmann F, Rappaport E, Margolis H, Bates D, Peters J. The effect of air pollution on lung development from 10 to 18 years of age. New Engl J Med. 2004;351(11):1057–1067. doi: 10.1056/NEJMoa040610. [DOI] [PubMed] [Google Scholar]
- 7.Hoffman EA, Clough AV, Christensen GE, Lin CL, McLennan G, Reinhardt JM, Simon BA, Sonka M, Tawhai MH, Beek EJv, Wang G. The comprehensive imaging-based analysis of the lung: a forum for team science (1) Acad Radiol. 2004;11(12):1370–1380. doi: 10.1016/j.acra.2004.09.005. [DOI] [PubMed] [Google Scholar]
- 8.Li B, Christensen GE, McLennan G, Hoffman EA, Reinhardt JM. Establishing a normative atlas of the human lung: Inter-subject warping and registration of volumetric CT. Acad Radiol. 2003;10(3):255–265. doi: 10.1016/s1076-6332(03)80099-5. [DOI] [PubMed] [Google Scholar]
- 9.Zhang L, Hoffman EA, Reinhardt JM. Atlas-driven lung lobe segmentation in volumetric X-ray CT images. IEEE T Med Imaging. 2006;25(1):1–16. doi: 10.1109/TMI.2005.859209. [DOI] [PubMed] [Google Scholar]
- 10.Ukil S, Reinhardt JM. Smoothing lung segmentation surfaces in three-dimensional X-ray CT images using anatomic guidance. Acad Radiol. 2005;12(12):1502–1511. doi: 10.1016/j.acra.2005.08.008. [DOI] [PubMed] [Google Scholar]
- 11.Weibel ER. Morphometry of the Human Lung. Springer-Verlag; Berlin: p. 1963. [Google Scholar]
- 12.Horsfield K, Dart G, Olson DE, Filley GF, Cumming G. Models of the human bronchial tree. J Appl Physiol. 1971;31:207–217. doi: 10.1152/jappl.1971.31.2.207. [DOI] [PubMed] [Google Scholar]
- 13.Tawhai MH, Hunter PJ. Multibreath washout analysis: modelling the influence of conducting airway asymmetry. Resp Physiol. 2001;127(2–3):249–258. doi: 10.1016/s0034-5687(01)00239-0. [DOI] [PubMed] [Google Scholar]
- 14.Tawhai MH, Pullan AJ, Hunter PJ. Generation of an anatomically based three-dimensional model of the conducting airways. Ann Biomed Eng. 2000;28(7):793–802. doi: 10.1114/1.1289457. [DOI] [PubMed] [Google Scholar]
- 15.Tawhai MH, Hunter PJ. Modeling water vapor and heat transfer in the normal and the intubated airway. Ann Biomed Eng. 2004;32(4):609–622. doi: 10.1023/b:abme.0000019180.03565.7e. [DOI] [PubMed] [Google Scholar]
- 16.Nowak N, Kakade PP, Annapragada AV. Computational fluid dynamics simulation of airflow and aerosol deposition in human lungs. Ann Biomed Eng. 2003;31(4):374–390. doi: 10.1114/1.1560632. [DOI] [PubMed] [Google Scholar]
- 17.van Ertbruggen C, Hirsch C, Paiva M. Anatomically based three-dimensional model of airways to simulate flow and particle transport using computational fluid dynamics. J Appl Physiol. 2005;98:970–980. doi: 10.1152/japplphysiol.00795.2004. [DOI] [PubMed] [Google Scholar]
- 18.Horsfield K, Cumming G. Morphology of the bronchial tree in man. J Appl Physiol. 1968;24:373–383. doi: 10.1152/jappl.1968.24.3.373. [DOI] [PubMed] [Google Scholar]
- 19.Sauret V, Halson PM, Brown IW, Fleming JS, Bailey AG. Study of the three-dimensional geometry of the central conducting airways in man using computed tomographic (CT) images. J Anat. 2000;200:123–134. doi: 10.1046/j.0021-8782.2001.00018.x. [DOI] [PMC free article] [PubMed] [Google Scholar]
- 20.Schmidt A, Zidowitz S, Kriete A, Denhard T, Krass S, Peitgen H. A digital reference model of the human bronchial tree. Comput Med Imag Grap. 2004;28:203–211. doi: 10.1016/j.compmedimag.2004.01.001. [DOI] [PubMed] [Google Scholar]
- 21.Lin C-L, Tawhai MH, McLennan G, Hoffman EA. Characteristics of the turbulent laryngeal jet and its effect on airflow in the human intra-thoracic airways. Respir Physiol Neuro. 2007;157(2–3):295–309. doi: 10.1016/j.resp.2007.02.006. [DOI] [PMC free article] [PubMed] [Google Scholar]
- 22.Vial L, Perchet D, Fodil R, Caillibotte G, Fetita C, Prêteux F, Beigelman-Aubry C, Grenier P, Thiriet M, Isabey D, Sbirlea-Apiou G. Airflow modeling of steady inspiration in two realistic proximal airway trees reconstructed from human thoracic tomodensitometric images. Comput Methods Biomech Biomed Engin. 2005;8(4):267–277. doi: 10.1080/10255840512331389280. [DOI] [PubMed] [Google Scholar]
- 23.de Rochefort L, Vial L, Fodil R, Maître X, Louis B, Isabey D, Caillibotte G, Thiriet M, Bittoun J, Durand E, Sbirlea-Apiou G. In vitro validation of computational fluid dynamic simulation in human proximal airways with hyperpolarized 3He magnetic resonance phase-contrast velocimetry. J Appl Physiol. 2007;102:2012–2023. doi: 10.1152/japplphysiol.01610.2005. [DOI] [PubMed] [Google Scholar]
- 24.Hoffman EA, Simon BA, McLennan G. State of the Art. A structural and functional assessment of the lung via multidetector-row computed tomography: phenotyping chronic obstructive pulmonary disease. Proc Am Thorac Soc. 2006;3:519–532. doi: 10.1513/pats.200603-086MS. [DOI] [PMC free article] [PubMed] [Google Scholar]
- 25.Chon D, Beck KC, Simon BA, Shikata H, Saba OI, Hoffman EA. Effect of low-xenon and krypton supplementation on signal/noise of regional CT-based ventilation measurements. J Appl Physiol. 2007;102:1535–1544. doi: 10.1152/japplphysiol.01235.2005. [DOI] [PubMed] [Google Scholar]
- 26.Chon D, Simon BA, Beck KC, Shikata H, Saba OI, Won C, Hoffman EA. Differences in regional wash-in and wash-out time constants for xenon-CT ventilation studies. Respir Physiol Neuro. 2005;148(1–2):65–83. doi: 10.1016/j.resp.2005.06.003. [DOI] [PubMed] [Google Scholar]
- 27.Marcucci C, Nyhan D, Simon BA. Distribution of pulmonary ventilation using Xe-enhanced computed tomography in prone and supine dogs. J Appl Physiol. 2001;90(2):421–430. doi: 10.1152/jappl.2001.90.2.421. [DOI] [PubMed] [Google Scholar]
- 28.Chon D, Beck KC, Larsen RL, Shikata H, Hoffman EA. Regional pulmonary blood flow in dogs by 4D- x-ray CT. J Appl Physiol. 2006;101(5):1451–1465. doi: 10.1152/japplphysiol.01131.2005. [DOI] [PubMed] [Google Scholar]
- 29.Sanders C, Nath PH, Bailey WC. Detection of emphysema with computed tomography correlation with pulmonary function tests and chest radiography. Invest Radiol. 1988;23:262–266. doi: 10.1097/00004424-198804000-00004. [DOI] [PubMed] [Google Scholar]
- 30.Wollmer P, Albrechtsson U, Brauer K, Eriksson L, Jonson B, Tylen U. Measurement of pulmonary density by means of x-ray computerized tomography. Chest. 1986;90:387–391. doi: 10.1378/chest.90.3.387. [DOI] [PubMed] [Google Scholar]
- 31.Vock P, Salzmann C. Comparison of computed tomographic lung density with haemodynamic data of the pulmonary circulation. Clin Radiol. 1986;37:459–464. doi: 10.1016/s0009-9260(86)80054-x. [DOI] [PubMed] [Google Scholar]
- 32.Hopkins SR, Harms CA. Gender and pulmonary gas exchange during exercise. Exercise Sport Sci R. 2004;32(2):50–56. doi: 10.1097/00003677-200404000-00003. [DOI] [PubMed] [Google Scholar]
- 33.Harms CA, Rosenkranz S. Sex differences in pulmonary function during exercise. Med Sci Sport Exer. 2008;40(4):664–668. doi: 10.1249/MSS.0b013e3181621325. [DOI] [PubMed] [Google Scholar]
- 34.Harms CA. Does gender affect pulmonary function and exercise capacity? Respir. Physiol Neuro. 2006;151(2–3):124–131. doi: 10.1016/j.resp.2005.10.010. [DOI] [PubMed] [Google Scholar]
- 35.Keller JM, Edwards FM, Rundle R. Automatic outlining of regions on CT scans. J Comput Assist Tomo. 1981;5:240–245. doi: 10.1097/00004728-198104000-00015. [DOI] [PubMed] [Google Scholar]
- 36.Hu S, Hoffman EA, Reinhardt JM. Automatic lung segmentation for accurate quantitation of volumetric X-ray CT images. IEEE T Med Imaging. 2001;20:490–498. doi: 10.1109/42.929615. [DOI] [PubMed] [Google Scholar]
- 37.Zhang L, Hoffman EA, Reinhardt JM. Lung lobar segmentation by graph search with 3D shape constraints. Proc SPIE Medical Imaging. 2001;4321:204–215. [Google Scholar]
- 38.Hoffman EA, Gnanaprakasam D, Gupta KB, Hoford JD, Kugelmass SD, Kulawiec RS. VIDA: An environment for multidimensional image display and analysis. Proc SPIE Medical Imaging. 1992;1660:694–711. [Google Scholar]
- 39.Aykac D, Hoffman EA, McLennan G, Reinhardt JM. Segmentation and analysis of human airway tree from 3D X-ray images. IEEE T Med Imaging. 2003;22(8):940–950. doi: 10.1109/TMI.2003.815905. [DOI] [PubMed] [Google Scholar]
- 40.Tschirren J, Hoffman EA, McLennan G, Sonka M. Intrathoracic airway trees: segmentation and airway morphology analysis from low-dose CT scans. IEEE T Med Imaging. 2005;24:1529–1539. doi: 10.1109/TMI.2005.857654. [DOI] [PMC free article] [PubMed] [Google Scholar]
- 41.Wood SA, Zerhouni EA, Hoford JD, Hoffman EA, Mitzner W. Measurement of three-dimensional lung tree structures by using computed tomography. J Appl Physiol. 1995;79:1687–1697. doi: 10.1152/jappl.1995.79.5.1687. [DOI] [PubMed] [Google Scholar]
- 42.Pisupati C, Wolff L, Mitzner W, Zerhouni E. Geometric tree matching with applications to 3D lung structures. Proc ACM Symposium on Computational Geometry 1996 [Google Scholar]
- 43.Palagyi K, Tschirren J, Hoffman EA, Beck K, Sonka M. Quantitative assessment of segmental volume and radii of intrathoracic airway trees imaged by multi-row detector spiral CT. Am J Resp Crit Care Med. 2003;167:A846. [Google Scholar]
- 44.Palagyi K, Tschirren J, Hoffman EA, Sonka M. Quantitative analysis of pulmonary airway tree structures. Comput Biol Med. 2006;36(9):974–996. doi: 10.1016/j.compbiomed.2005.05.004. [DOI] [PubMed] [Google Scholar]
- 45.Tschirren J, McLennan G, Palagyi K, Hoffman EA, Sonka M. Matching and anatomical labeling of human airway tree. IEEE T Med Imaging. 2005;24:1540–1547. doi: 10.1109/TMI.2005.857653. [DOI] [PMC free article] [PubMed] [Google Scholar]
- 46.Tschirren J. Segmentation, anatomical labeling, branch-point matching, and quantitative analysis of human airway tree in volumetric CT Iimages. The University of Iowa; Iowa City, IA: 2003. [Google Scholar]
- 47.Tschirren J. Segmentation, Anatomical Labeling, Branch-point Matching, and Quantitative Analysis of Human Airway Tree in Volumetric CT Images. The University of Iowa; Iowa City, IA: 2003. [Google Scholar]
- 48.Phalen RF, Yeh HC, Schum GM, Raabe OG. Application of an idealized model to morphometry of the mammalian tracheobronchial tree. Anat Rec. 1978;190:167–176. doi: 10.1002/ar.1091900202. [DOI] [PubMed] [Google Scholar]
- 49.Tgavalekos N, Tawhai MH, Harris RS, Venegas J, Lutchen KR. Identifying airways responsible for heterogeneous ventilation and mechanical dysfunction in asthma: an image-functional modeling approach. J Appl Physiol. 2005;99(6):2388–2397. doi: 10.1152/japplphysiol.00391.2005. [DOI] [PubMed] [Google Scholar]
- 50.Comer JK, Kleinstreuer C, Zhang Z. Flow structures and particle deposition patterns in double-bifurcation airway models. Part 1. Airflow fields. J Fluid Mech. 2001;435:25–54. [Google Scholar]
- 51.Comer JK, Kleinstreuer C, Zhang Z. Flow structures and particle deposition patterns in double-bifurcation airway models. Part 2. Aerosol transport and deposition. J Fluid Mech. 2001;435:55–80. [Google Scholar]
- 52.Zhang Z, Kleinstreuer C. Transient airflow structures and particle transport in a sequentially branching lung airway model. Phys Fluids. 2002;14(2):862–880. [Google Scholar]
- 53.Zhang Z, Kleinstreuer C, Kim CS, Hickey AJ. Aerosol transport and deposition in a triple bifurcation bronchial airway model with local tumors. Inhal Toxicol. 2002;14:1111–1133. doi: 10.1080/08958370290084809. [DOI] [PubMed] [Google Scholar]
- 54.Hollander PA, Blonde L, Rowe R, Mehta AE, Milburn JL, Hershon KS, Chiasson JL, Levin SR. Efficacy and safety of inhaled insulin (exubera) compared with subcutaneous insulin therapy in patients with type 2 diabetes: results of a 6-month, randomized, comparative trial. Diabetes Care. 2004;27:2356–2362. doi: 10.2337/diacare.27.10.2356. [DOI] [PubMed] [Google Scholar]
- 55.Lippmann M, Esch JL. Effect of lung airway branching pattern and gas composition on particle deposition. I. background and literature review. Exp Lung Res. 1988;14:311–320. doi: 10.3109/01902148809087811. [DOI] [PubMed] [Google Scholar]
- 56.Tajik JK, Tran BQ, Hoffman EA. Xenon enhanced CT imaging of local pulmonary ventilation. Proc SPIE Medical Imaging. 1996;2709:40–54. [Google Scholar]
- 57.Albert MS, Cates GD, Driehuys B, Happer WB, Springer CSJ, Wishnia A. Biological magnetic resonance imaging using laser-polarized 129Xe. Nature. 1994;370(6486):199–201. doi: 10.1038/370199a0. [DOI] [PubMed] [Google Scholar]
- 58.Black RD, Middleton HL, Cates GD, Cofer GP, Driehuys B, Happer W, Hedlund LW, Johnson GA, Shattuck MD, Swartz JC. In vivo He-3 MR images of guinea pig lungs. Radiology. 1996;199:867–870. doi: 10.1148/radiology.199.3.8638019. [DOI] [PubMed] [Google Scholar]
- 59.Middleton H, Black RD, Saam B, Cates GD, Cofer GP, Guenther R, Happer W, Hedlund LW, Johnson GA, Juvan K, Swartz J. MR imaging with hyperpolarized 3He gas. Magnet Reson Med. 1995;33:271–275. doi: 10.1002/mrm.1910330219. [DOI] [PubMed] [Google Scholar]
- 60.EvB, Wild J, Schreiber W, Kauczor H, Mugler JP, de Lange EE. Functional MRI of the lungs using hyperpolarized 3-helium gas. J Magn Reson Im. 2004;20:540–554. doi: 10.1002/jmri.20154. [DOI] [PubMed] [Google Scholar]
- 61.Balásházy I, Hofmann W, Heistracher T. Local particle deposition patterns may play a key role in the development of lung cancer. J Appl Physiol. 2003;94:1719–1725. doi: 10.1152/japplphysiol.00527.2002. [DOI] [PubMed] [Google Scholar]
- 62.Zhang Z, Kleinstreuer C. Airflow structures and nano-particle deposition in a human upper airway model. J Comput Phys. 2004;198:178–210. [Google Scholar]
- 63.Luo HY, Liu Y, Yang XL. Particle deposition in obstructed airways. J Biomech. 2007;40:3096–3104. doi: 10.1016/j.jbiomech.2007.03.027. [DOI] [PubMed] [Google Scholar]
- 64.Yang XL, Liu Y, Luo HY. Respiratory flow in obstructed airways. J Biomech. 2006;39:2743–2751. doi: 10.1016/j.jbiomech.2005.10.009. [DOI] [PubMed] [Google Scholar]
- 65.Yang XL, Liu Y, So RMC, Yang JM. The effect of inlet velocity profile on the bifurcation COPD airway flow. Comput Biol Med. 2006;36:181–194. doi: 10.1016/j.compbiomed.2004.11.002. [DOI] [PubMed] [Google Scholar]
- 66.Choi LT, Tu JY, Li HF, Thien F. Flow and particle deposition patterns in a realistic human double bifurcation airway model. Inhal Toxicol. 2007;19(2):117–131. doi: 10.1080/08958370601051719. [DOI] [PubMed] [Google Scholar]
- 67.Lin C-L, Hoffman EA. A numerical study of gas transport in human lung models. Proc SPIE Medical Imaging. 2005;5746:92–100. [Google Scholar]
- 68.Lin C-L, Tawhai MH, McLennan G, Hoffman EA. Multiscale simulation of gas flow in subject-specific models of the human lung. IEEE Eng Med Biol. 2008 in press. [Google Scholar]
- 69.Longest PW, Vinchurkar S. Effects of mesh style and grid convergence on particle deposition in bifurcating airway models with comparisons to experimental data. Med Eng Phys. 2007;29:350–366. doi: 10.1016/j.medengphy.2006.05.012. [DOI] [PubMed] [Google Scholar]
- 70.Robinson RJ, Snyder P, Oldham MJ. Comparison of particle tracking algorithms in commercial CFD packages: sedimentation and diffusion. Inhal Toxicol. 2007;19(6):517–531. doi: 10.1080/08958370701260889. [DOI] [PubMed] [Google Scholar]
- 71.Comer JK, Kleinstreuer C, Hyun S, Kim CS. Aerosol transport and deposition in sequentially bifurcating airways. J Biomech Eng - T ASME. 2000;122:152–158. doi: 10.1115/1.429636. [DOI] [PubMed] [Google Scholar]
- 72.Stapleton K, Guentsch E, Hoskinson MK, Finlay WH. On the suitability of k-ε turbulence modeling for aerosol deposition in the mouth and throat. J Aerosol Sci. 2000;31(6):739–749. [Google Scholar]
- 73.Löhner R, Cebral J, Soto O, Yim P, Burgess JE. Applications of patient-specific CFD in medicine and life science. International Journal for Numerical Methods in Fluids. 2003;43(6–7):637–650. [Google Scholar]
- 74.Heenan AF, Finlay WH, Grgic B, Pollard A, Burnell PKP. An investigation of the relationship between the flow field and regional deposition in realistic extra-thoracic airways. J Aerosol Sci. 2004;35:1013–1023. [Google Scholar]
- 75.Caro C. Swirling steady inspiratory flow in models of human bronchial airways (abstract of presentation at BMES annual meeting, RTP 2001) Ann Biomed Eng. 2001;29(S1):S138. [Google Scholar]
- 76.Hegedûs CJ, Balásházy I, Farkas Á. Detailed mathematical description of the geometry of airway bifurcations. Respir Physiol Neuro. 2004;141(1):99–114. doi: 10.1016/j.resp.2004.03.004. [DOI] [PubMed] [Google Scholar]
- 77.Farkas A, Balashazy I, Szocs K. Characterization of regional and local deposition of inhaled eerosol drugs in the respiratory system by computational fluid and particle dynamics methods. J Aerosol Med. 2006;19(3):329–343. doi: 10.1089/jam.2006.19.329. [DOI] [PubMed] [Google Scholar]
- 78.Baer GA, Terho M, Tiensuu T. Morphologic study of the adult trachea at the 7th and 12th ring: a study on specimens from 205 autopsies. Surg Radiol Anat. 1987;9:169–172. doi: 10.1007/BF02086602. [DOI] [PubMed] [Google Scholar]
- 79.Gamsu G, Webb WR. Computed tomography of the trachea: normal and abnormal. Am J Roentgenol. 1982;139:321–326. doi: 10.2214/ajr.139.2.321. [DOI] [PubMed] [Google Scholar]
- 80.Finlay WH. The Mechanics of Inhaled Pharmaceutical Aerosols (An Introduction) Academic Press; 2001. [Google Scholar]
- 81.Wilcox DC. Turbulence Modeling for CFD. DCW Industries, Inc; 1994. [Google Scholar]
- 82.Heenan AF, Matida E, Pollard A, Finlay WH. Experimental measurements and computational modeling of the flow field in an idealized human oropharynx. Exp Fluids. 2003;35:70–84. [Google Scholar]
- 83.Pope SB. Turbulent flows. Cambridge University Press; 2003. [Google Scholar]
- 84.Holmes P, Lumley JL, Berkooz G. Turbulence, coherent structures, dynamical systems and symmetry. Cambridge University Press; 1996. [Google Scholar]
- 85.Warren NJ, Nielsen P, Tawhai MH. Computational model of airway surface liquid regulation. Respirology. 2007;12(Supplement 1):A7. [Google Scholar]
- 86.Warren NJ, Nielsen PM, Tawhai MH. Description of airway periciliary height liquid regulation via a multi-scale computational model of coupled cellular kinetics and geometrical airway conditions. Am J Resp Crit Care Med. 2007:175. Abstracts Issue. [Google Scholar]
- 87.Burrowes KS, Tawhai MHHPJ. Evaluation of arterial blood flow heterogeneity via an image-based computational model. Proc SPIE Medical Imaging. 2005;5746:257–266. [Google Scholar]
- 88.Burrowes KS, Tawhai MH, Hunter PJ. Modeling RBC and neutrophil distribution through an anatomically based pulmonary capillary network. Ann Biomed Eng. 2004;32(4):585–595. doi: 10.1023/b:abme.0000019178.95185.ad. [DOI] [PubMed] [Google Scholar]
- 89.Burrowes KS, Tawhai MH. The effect of lung orientation on functional imaging of blood flow. Proc SPIE Medical Imaging: Physiology, Structure, and Function from Medical Images. 2007:6511. [Google Scholar]
- 90.Swan A, Hunter PJ, Tawhai mH. Pulmonary gas exchange in anatomically-based models of the lung. Adv Exp Med Biol. 2008;605:184–189. doi: 10.1007/978-0-387-73693-8_32. [DOI] [PubMed] [Google Scholar]
- 91.Tawhai MH, Ben-Tal A. Multi-scale modeling for the Lung Physiome. Cardiovascular Engineering. 2004;3(1):19–26. [Google Scholar]