Abstract
Purpose
Cardiac CT scans for the assessment of coronary calcium scores include approximately 70% of the lung volume and may be useful for the quantitative assessment of emphysema. The reproducibility of lung density measures from cardiac CTs and their validity compared to lung density measures from full-lung scans is unknown.
Methods and Methods
The Multi-Ethnic Study of Atherosclerosis (MESA) performed paired cardiac CT scans for 6,814 participants at baseline and at follow-up. The MESA-Lung Study assessed lung density measures in the lung fields of these cardiac scans, counting voxels below -910 HU as moderate-to-severe emphysema-like lung regions. We evaluated: 1) the reproducibility of lung density measures among 120 randomly selected participants, 2) the comparability of measures acquired on electron-beam CT (EBT) and multidetector CT (MDCT) scanners among 10 participants; and 3) the validity of these measures compared to full-lung scans among 42 participants. Limits of agreement were determined using Bland-Altman approaches.
Results
Percent emphysema measures from paired cardiac scans were highly correlated (r=0.92-0.95) with mean difference of -0.05% (95% limits of agreement: -8.3, 8.4%). Measures from EBT and MDCT scanners were comparable (mean difference -0.9%; 95% limits of agreement: -5.1, 3.3%). Percent emphysema measures from MDCT cardiac and MDCT full-lung scans were highly correlated (r=0.93) and demonstrated reasonable agreement (mean difference 2.2%; 95% limits of agreement: -9.2, 13.8%).
Conclusion
While full-lung imaging is preferred for the quantification of emphysema, the lung imaging from paired cardiac CTs provided a reproducible and valid quantitative assessment of emphysema in a population-based sample.
Introduction
Chronic obstructive pulmonary disease (COPD) is the fourth leading cause of death in the United States. Morbidity and mortality from COPD continue to rise – in contrast to declines in mortality from cardiovascular disease, cancer and stroke.1 COPD is defined by airflow obstruction on post-bronchodilator spirometry testing; however, millions of Americans have symptomatic COPD that is undiagnosed 2 due to difficulties with access, testing and interpretation of spirometry.3, 4 Emphysema is defined by a loss of lung tissue in the absence of fibrosis, and overlaps considerably with COPD. Emphysema can be quantitated on full-lung computed tomography (CT) scans by various measures of CT lung density,5-15 which provide supplemental information to spirometry.15
Cardiac CT scans for the assessment of coronary calcium scores can be obtained rapidly with low radiation exposure.16 Coronary calcium scores strongly predict near-term risk of coronary heart disease independent of established risk factors.17 Cardiac CT scans might provide an opportunity for the assessment of emphysema since they image about 70% of the lung volume (approximately the carina to T11). Cardiac CT scans differ, however, from full-lung CT scans that are performed for lung density measurements not just by the volume of the lung imaged but also by coaching of the patient to full inspiration, cardiac gating, and the image acquisition protocol itself. It is therefore uncertain if lung density measures from cardiac scans are reproducible and valid measures of full-lung emphysema.
We performed three prospectively designed studies to evaluate: 1) the reproducibility of lung density measures from pairs of cardiac CT scans, 2) the comparability of lung density measures from cardiac CT scans performed on a electron-beam (EBT) and 64-slice multidetector (MDCT) scanner, and 3) the validity of lung density measures from paired cardiac CT scans compared to full-lung CT scans.
Materials and Methods
Study Sample
The Multi-Ethnic Study of Atherosclerosis (MESA) is a multicenter prospective cohort study to investigate the prevalence, correlates and progression of subclinical cardiovascular disease in individuals without clinical cardiovascular disease. The protocol and recruitment has been previously described.18 MESA recruited 6,814 participants, ages 45-84 years old of non-Hispanic white, African-American, Hispanic or Chinese race/ethnicity from six U.S. communities in 2000-2002. Major exclusion criteria included clinical cardiovascular disease, weight >300 lbs, CT scan in the prior year and other serious medical conditions. The protocols of MESA and all studies described herein were approved by the Institutional Review Boards of all collaborating institutions and the National Heart Lung and Blood Institute (NHLBI).
The MESA-Lung Study assessed CT lung density measures from the lung fields of the MESA cardiac CT scans among 3,965 participants who were sampled randomly among MESA participants who consented to genetic analyses, underwent baseline measures of endothelial function, and attended an examination during MESA-Lung recruitment in 2004-2006.
The MESA Coordinating Center selected three samples within the MESA-Lung Study for the evaluation of CT lung density measures:
for the reproducibility study, a random sample of 120 participants at all six centers, stratified on center, smoking status and weight (less or greater than 220 lbs), who underwent two cardiac CT scans at baseline in 2000-2002 and two cardiac CT scans at follow-up in 2003-2005;
for the comparability study, a convenience sample of 10 participants at one site who underwent one EBT cardiac CT scan and one 64-slice MDCT cardiac CT scan, each on the same day in 2006;
for the validation study, a random sample of an additional 42 participants at two centers, stratified on smoking status and weight, who underwent two cardiac CT scans and one full-lung CT scan in 2004-2005. Participants at one center underwent the cardiac and full-lung CT scans on the same MDCT scanner on the same day. Participants at the other center underwent the two cardiac CT scans on an EBT scanner followed by a full-lung CT scan on a 64-slice MDCT scanner about 6 months later.
Computed Tomography Scanning Protocols
MESA Cardiac CT Protocol
Cardiac scans were performed under a standardized protocol (Table 1) by designated, MESA-certified, experienced radiology technologists, under the supervision of the reading center co-investigator.16 Two sequential axial scans with prospective cardiac gating were performed in succession on each participant at each visit. The participant was asked to take three deep breaths and then hold lung volume at end-inspiration. At the time of baseline scanning, three MESA sites had MDCT scanners and the other three had EBT scanners. For MDCT scanners, the mA was increased by 25% for participants who weighed >220 lbs.
Table 1.
CT protocols of coronary calcium and full-lung scans in the Multi-Ethnic Study of Atherosclerosis.
| Scanner | Rotation time | kVp | mA/mAs | Speed | Collimation | Reconstruction | Filter |
|---|---|---|---|---|---|---|---|
| Cardiac Scans | |||||||
| GE Light Speed 4 | 800 msec | 120 | 200 mA | 0.8 s | 4×2.5 mm | Segmented | Standard |
| GE Light Speed 4 | 500 msec | 120 | 320 mA | 0.5 s | 4×2.5 mm | Segmented | Standard |
| Siemens Volume Zoom | 140 | 139 mA | 0.361 s | 4×2.5 mm | Standard | ||
| 50 mAs | |||||||
| Imatron C-150 | 130 | 630 mA | 0.100 s | 3 mm | Sharp | ||
| Siemens Sensation 64 (comparability study) | 120 | 50 mAs | 0.220 s | 30×0.6 mm | B30F | ||
| GE Lightspeed Pro 16 (validation study) | 500 msec | 120 | 320 mA | 0.5 s | 4×2.5 mm | Segmented | Standard |
| Full-Lung Scans | |||||||
| GE Lightspeed Pro 16 | 120 | 75 mAs | 0.5 | 0.75 mm | 1.8 mm increment | Standard, High Resolution | |
| Siemens Sensation 64 | 120 | 50 mAs | 0.5 | 0.75 mm | 1.8 mm increment | Standard, High Resolution |
Full-Lung Chest CT Protocol
The MDCT full-lung chest protocol (Table 1) in the validation study was similar to the NHLBI-funded National Lung Screening Trial protocol,19 except for a slightly higher effective dose to better image the lung parenchyma. The scan imaged the chest from 1 cm above the lung apices to 1 cm below the diaphragm, following instruction for a very deep breath hold. Following the MESA cardiac CT protocol, the mA was increased by 25% for subjects who weighed > 220 lbs.
Lung Density Measures
Images were assigned to one of several trained image analysts who assessed lung density using the Pulmonary Analysis Software Suite (PASS),20 which was used in the NHLBI-funded National Emphysema Treatment Trial.21-25 The software was modified for use with cardiac scans. In some cases, image analysts manually removed over-lapping slices or corrected lung segmentation on slices where image artifacts caused errors in the automatic lung segmentation. These corrections were noted in the quality control (QC) log.
Based upon pathology comparisons 5 and literature-based consensus we reported the percent emphysema as the percentage of the total voxels in the whole lung, as well as in the apical and basal lung, which fell below -950, -910, and -850 HU. -910 HU was specified a priori as the threshold for primary analyses. These thresholds are used to identify severe, moderate and mild emphysema-like lung regions respectively. For the full-lung scans, apical and basal lung was defined as the cephalad and caudal thirds of the lung, respectively, according to the distance between the apical and basal most slices. For the cardiac scans, the apical or basal lung was defined as the cephalad or caudal eighth of the z-axis extent of the scan.
Based upon the studies of Mishima et al.,26 we also defined lung holes as connected voxels within a scanned slice falling below -950, -910, or -850 and reported the slope of the log-log plot of hole size (x-axis) vs. percent of holes (y-axis). Mishima reasoned that if the initial onset of emphysema was fractal in nature then the slope of the log-log relationship would be linear and would become less negative as emphysema progressed with multiple small holes merging to form fewer larger holes. Thus the negative of the slope of this log-log relationship, termed here as alpha, would decrease as emphysema advances.
Lung density measures were performed in random order and blinded to paired results in the reproducibility study. In the validation study, lung density was assessed blinded to full-lung images. Attenuation of air was measured outside the chest on a random sample of scans to confirm scanner calibration at -1,000 HU. In the one case of mis-calibration (the MDCT scanner in the comparability study), thresholds were adjusted by the difference in measured air from -1,000.
Additional Measures
Age, self-identified race/ethnicity, and smoking status were assessed by questionnaires. Height and weight were measured using calibrated scales and stands; body mass index was calculated as weight (kg) / height (m)2. Spirometry was measured following and meeting ATS standards,27 as previously described.28, 29
Statistical Analysis
The distribution of percent emphysema was markedly skewed, violating the assumptions underlying standard reproducibility metrics such as coefficient of variation (CV). Instead, the data were plotted following the method of Bland-Altman,30 Spearman correlation coefficients, and intraclass correlation coefficient (ICC). Ninety-five percent limits of agreement were calculated, allowing for proportionality of error.31 The impact on reproducibility of possible sources of error noted in the QC log was evaluated with linear regression models.
For the validation of lung density measures from cardiac CT scans, lung density measures from full-lung scans were assumed to represent the gold standard measure. Since two cardiac scans were available for each participant, the scan with the greater air volume (assumed to be the closer to total lung capacity [TLC]) was used unless there was a significant discordance in a QC metric as identified in the reproducibility study, in which case the better quality scan, defined by these QC metrics, was picked. Measures from full-lung scans were regressed on measures from cardiac scans and the results were plotted. The target number of participants in the validation study was estimated at 23 per scanner type, which resulted in 95% power to obtain a 95% confidence intervals (CI) for alpha of half-width 0.1, given a standard deviation of 0.33 and correlation of 0.85. SAS Version 9.1 (SAS Institute, Cary, NC) was used for statistical analyses.
Results
Table 2 shows the characteristics of participants in the reproducibility study of cardiac CT scans, the comparability study of EBT vs. MDCT cardiac CT scans, and the validation study of cardiac vs. full-lung CT scans. One participant selected for the reproducibility study underwent one instead of two baseline scans and was excluded from baseline analyses; two participants were excluded from follow-up analyses for the same reason. Participants ranged in age from 45 to 84 years. A majority had smoked but few had significant lung disease.
Table 2.
Characteristics of patients included in the reproducibility study of cardiac CT scans, comparability study of EBT vs. MDCT cardiac CT scans, and validation study of cardiac vs. full-lung CT scans.
| Reproducibility Study (n = 119) | Comparability Study (n=10) | Validation Study (n = 42) | |
|---|---|---|---|
| Age, years, mean ± SD | 58.9±9.1 | 63.8±9.9 | 62.3±10.7 |
| Male, % | 42.0 | 60 | 57.1 |
| Race/Ethnicity, % | |||
| Caucasian | 31.1 | 60 | 14.3 |
| African-American | 37.8 | 20 | 76.2 |
| Hispanic | 21.9 | 20 | 9.5 |
| Chinese | 9.2 | 0 | 0 |
| Smoking Status, % | |||
| Never | 37.3 | 20 | 51.2 |
| Former | 37.3 | 60 | 39.0 |
| Current | 25.4 | 20 | 9.8 |
| Pack-years among ever smokers, mean ± SD | 21.6±23.2 | 15.7±17.3 | 25.9±32.6 |
| Height, cm, mean ± SD | 167±10.2 | 169±10.1 | 169±9.6 |
| Weight >220 lbs, % | 19.3 | 10 | 23.8 |
| BMI, kg/m2, mean ± SD | 29.5±5.8 | 27.2±3.7 | 30.1±5.7 |
| FVC %predicted, mean ± SD | 96.9±15.5 | 95.1±15.6 | 88.7±15.8 |
| FEV1 %predicted, mean ± SD | 94.4 ± 15.1 | 89.6±18.2 | 85.9 ±18.3 |
| FEV1/FVC %, mean ± SD | 75.3 ± 6.6 | 71.0±8.3 | 73.8 ± 9.6 |
| Airflow obstruction,* % | 5.4 | 30 | 12.5 |
| CT % emphysema-910 HU,† median (interquartile range) | 13.6 (5.88, 25.2) | 10.9 (6.94, 18.5) | 18.4 (8.23, 28.9) |
| CT alpha-910 HU,† median (interquartile range) | 1.25 (1.01, 1.50) | 1.45 (1.26, 1.61) | 1.27 (0.96, 1.58) |
| Apical-basilar difference in %emphysema-910 HU,† median (interquartile range) | 0.08 (-4.04, 3.26) | -3.27 (-6.58, -1.00) | 0.98 (-1.10, 6.00) |
| Apical-basilar difference in alpha-910 HU,† median (interquartile range) | 0.14 (-0.02, 0.29) | 0.11 (0.07, 0.13) | 0.04 (-0.14, 0.24) |
Defined as pre-bronchodilator FEV1/FVC ratio<0.7 and FEV1<80% of predicted
Measured from CT scan with greater air volume in Reproducibility Study, MDCT scan in Comparability Study, and full-lung scan in Validation Study, all at -910 HU.
The 172 participants in these three studies underwent a total of 581 cardiac CT scans, all of which were read successfully for lung density measures. Figure 1a shows representative caudal views from full-lung and cardiac CT scans on the same participant. The most frequent QC problems were breath artifact (22% of scans; Figure 1b), voxel size errors (7.7%), partial clipping of the lung tissue (2.1%), and cephalad or caudal shifts in the scan field (0.5%). Seventy percent of scans with breath artifact were acquired on EBT scanners.
Figure 1.
Figure 1a. Lung windows from full-lung and cardiac CT scans in the validation study
Figure 1b. Double diaphragm on cardiac scan due to breath artifact
Reproducibility of Lung Density Measures from Cardiac CT Scans
Table 3 shows the reproducibility of lung density measures from paired cardiac CT scans at baseline and on follow-up 18-36 months later. Spearman correlation coefficients and the ICC for percent emphysema and alpha were high. The distribution of alpha was approximately normal and the CV of alpha was 4.3% at baseline and 5.0% at follow-up. Bland-Altman plots of difference vs. mean %emphysema and alpha are shown in Figure 2.
Table 3.
Reproducibility of lung density measures from pairs of cardiac CT scans at baseline and at follow-up.
| Paired Cardiac CT Scans at Baseline (n=119 participants) |
Paired Cardiac CT Scans at Follow-up (n=118 participants) |
|||||||
|---|---|---|---|---|---|---|---|---|
| Spearman's correlation coefficient |
Mean difference (95%CI) |
Intraclass correlation coefficient* |
95% limits of agreement |
Spearman's correlation coefficient |
Mean difference (95% CI) |
Intraclass correlation coefficient* |
95% limits of agreement |
|
| %emphysema-910 HU | 0.92 | 0.05 (-0.71, 0.81) | 0.93 | -8.28, 8.38 | 0.93 | 0.41 (-0.66, 1.48) | 0.89 | -11.2, 12.0 |
| Alpha-910 HU | 0.91 | -0.012 (-0.04, 0.01) | 0.88 | -0.31, 0.28 | 0.93 | -0.03 (-0.05, -0.008) | 0.91 | -0.28, -0.22 |
| Apical-basilar difference in %Emphysema-910 HU | 0.82 | 0.05 (-0.63, 0.74) | 0.84 | -7.40, 7.50 | 0.76 | 0.85 (-0.15, 1.84) | 0.70 | -9.98, 11.7 |
| Apical-basilar difference in alpha-910 HU | 0.71 | -0.006 (-0.05, 0.04) | 0.68 | -0.46, 0.45 | 0.68 | -0.003 (-0.05, 0.04) | 0.64 | -0.50, 0.50 |
Intraclass correlation coefficient = between-person variance/(between-person variance + within-person variance)
Figure 2.
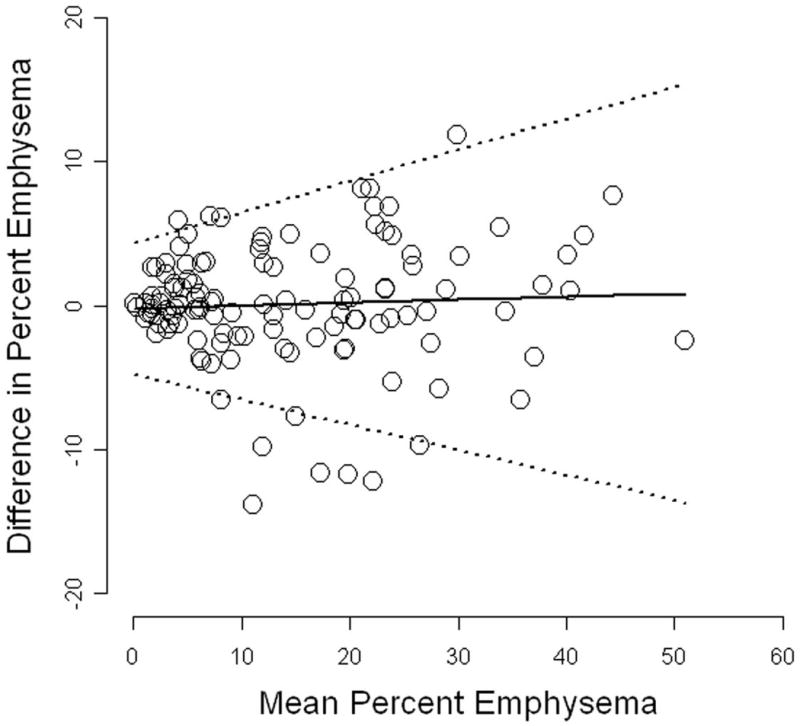
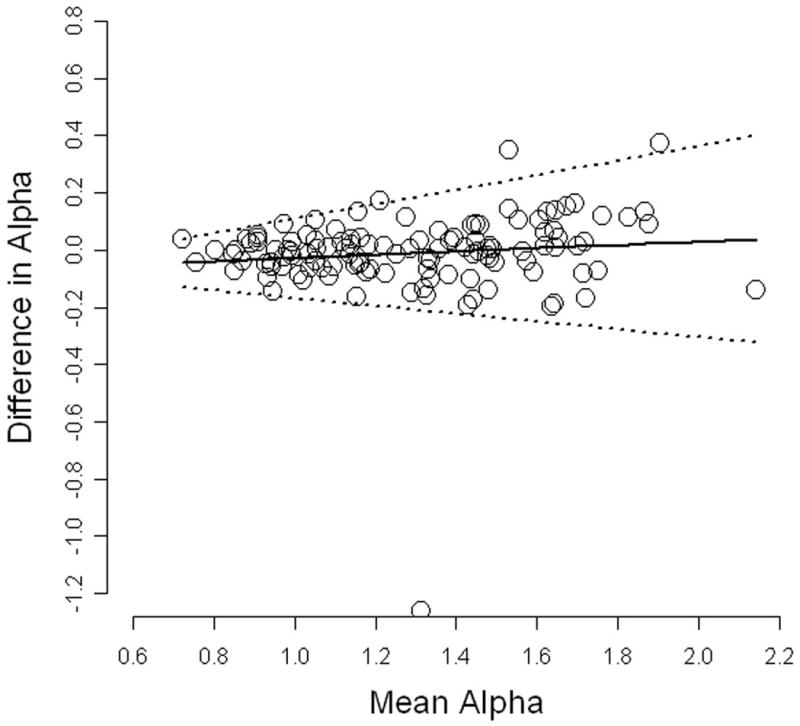
Reproducibility of lung density measures from pairs of cardiac CT scans at baseline. Solid line = mean difference; dashed lines = 95% limits of agreement
Apical-basilar differences were less reproducible than percent emphysema and alpha. However, the reproducibility of the components of these differences (i.e., the apical measures and the basilar measures) was similar to that for overall percent emphysema and alpha. For example, Spearman correlation coefficients for apical percent emphysema were 0.93 at baseline and 0.91 at follow-up.
Reproducibility of all lung density measures – and particularly the apical-basilar measures – was higher among participants with 10 or more pack-years of smoking compared to participants with lighter or no smoking histories (P<0.05). Agreement varied slightly by HU threshold and was generally slightly better at -910 HU than at other thresholds such as -950 and -850 HU (data not shown).
Reproducibility of lung density measures on EBT scanners was lower than that of MDCT scanners at baseline but not at follow-up (Table 4). The improvement in EBT reproducibility at follow-up was similar at all the three sites with EBT scanners.
Table 4.
Reproducibility of lung density measures from pairs of cardiac CT scans, stratified by scanner type
| Paired Cardiac CT Scans at Baseline |
Paired Cardiac CT Scans at Follow-up |
|||||||
|---|---|---|---|---|---|---|---|---|
| Electron Beam Computed Tomography EBT (n = 59) |
Multi-Detector Sub- Second Computed Tomography MDCT* (n = 60) |
Electron Beam Computed Tomography EBT (n = 58) |
Multi-Detector Sub- Second Computed Tomography MDCT* (n = 60) |
|||||
| Spearman's correlation coefficient |
Intraclass correlation coefficient† |
Spearman's correlation coefficient |
Intraclass correlation coefficient† |
Spearman's correlation coefficient |
Intraclass correlation coefficient† |
Spearman's correlation coefficient |
Intraclass correlation coefficient† |
|
| %emphysema-910 HU | 0.87 | 0.93 | 0.94 | 0.93 | 0.93 | 0.91 | 0.91 | 0.88 |
| Alpha-910 HU | 0.83 | 0.80 | 0.96 | 0.96 | 0.92 | 0.92 | 0.93 | 0.90 |
| Apical-basilar difference in %Emphysema-910 HU | 0.80 | 0.78 | 0.84 | 0.87 | 0.80 | 0.75 | 0.73 | 0.68 |
| Apical-basilar difference in alpha-910 HU | 0.71 | 0.53 | 0.68 | 0.78 | 0.64 | 0.49 | 0.73 | 0.72 |
GE Lightspeed 16-slice and Siemens 4 and 16-slice MDCTs
Intraclass correlation coefficient = between-person variance/(between-person variance + within-person variance)
Exclusion of pairs of scans with discordant breath artifacts and discordant voxel size improved reproducibility for percent emphysema (P=0.017 and P=0.076, respectively) to a correlation of 0.93 and ICC of 0.94 at baseline and a correlation of 0.95 and ICC of 0.92 at follow-up. Other QC problems, such as clipping of lung tissue and shifts in the lung field, had minimal effects on reproducibility.
Comparability of Lung Density Measures from EBT vs. MDCT Cardiac CT Scans
Lung density measures from EBT and MDCT cardiac scans are shown in the first two columns in Table 5. Correlations for %emphysema and alpha were high, mean differences were close to zero, and 95% limits of agreement were good (Table 5 and Figure 3). Results were generally similar to those from the reproducibility study. The correlation for apical-basilar difference in alpha was low, predominantly due to one outlier scan.
Table 5.
Comparability of lung density measures from cardiac CT scans on EBT vs. MDCT scanners
| n=10 | Median value from EBT cardiac scan (interquartile range) | Median value from MDCT* cardiac scan (interquartile range) | Spearman's correlation coefficient | Mean difference† (95% CI) | 95% limits of agreement |
|---|---|---|---|---|---|
| %emphysema-910 HU | 10.8 (7.35, 16.9) | 10.9 (6.94, 18.5) | 0.94 | -0.87 (-2.20, 0.46) | -5.07, 3.34 |
| Alpha-910 HU | 1.38 (1.19, 1.59) | 1.45 (1.26, 1.61) | 0.83 | -0.04 (-0.10, 0.02) | -0.23, 0.14 |
| Apical-basilar difference in %Emphysema-910 HU | 0.12 (-4.35, 1.63) | -3.27 (-6.58, -1.00) | 0.75 | 2.04 (0.05, 4.03) | -4.25, 8.33 |
| Apical-basilar difference in alpha-910 HU | 0.13 (0.09, 0.35) | 0.11 (0.07, 0.13) | 0.22 | 0.09 (-0.03, 0.22) | -0.30, 0.49 |
Siemens 64-slice multidetector CT scanner
Mean difference calculated as EBT value – MDCT value
Figure 3.
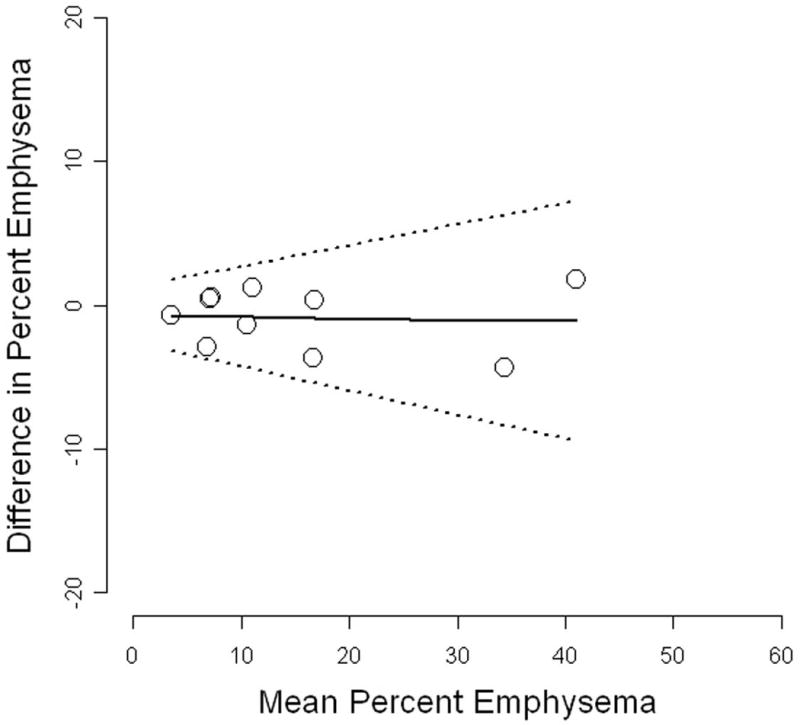
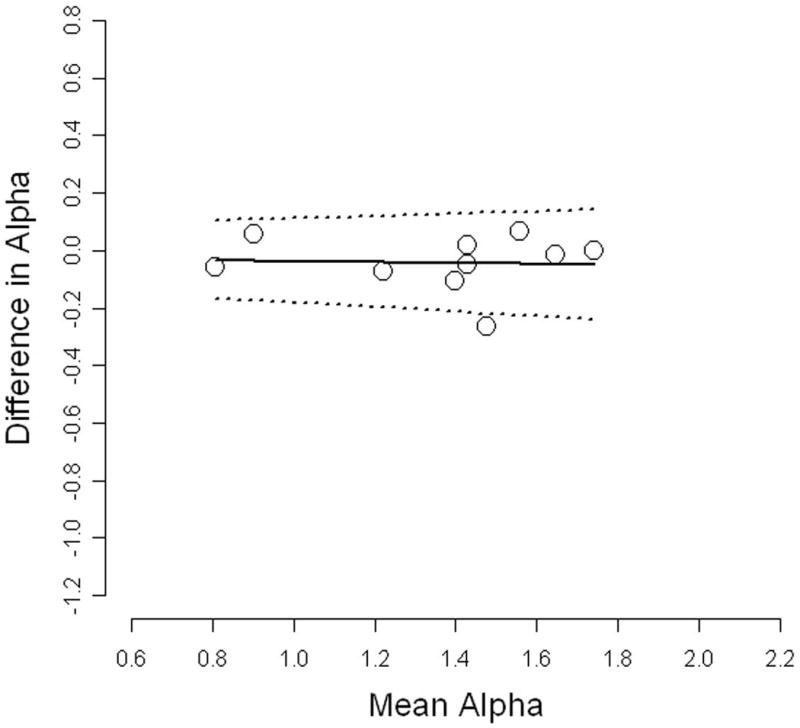
Comparability of lung density measures from cardiac CT scans on EBT vs. Siemens 64-slice MDCT scanners. Solid line = mean difference; dashed lines = 95% limits of agreement
Validation of Lung Density Measures from Cardiac vs. Full-lung CT Scans
Lung density measures from MDCT cardiac axial CT scans and MDCT full-lung helical CT scans are shown in the first two columns of Table 6. Measures of percent emphysema and alpha were highly correlated. Percent emphysema was slightly higher on the cardiac scan compared to the full-lung, although these differences did not attain statistical significance. Figure 4 shows regression plots of the cardiac vs. full-lung results for percent emphysema and alpha.
Table 6.
Validation of lung density measures from cardiac CT scan on MDCT scanner vs. full-lung CT scan on MDCT scanner
| n=24 | Median value from MDCT* cardiac scan (interquartile range) | Median value from MDCT* full-lung scan (interquartile range) | Spearman's correlation coefficient | Mean difference (95% CI) | 95% limits of agreement |
|---|---|---|---|---|---|
| %emphysema-910 HU | 22.6 (5.88, 34.9) | 20.4 (9.59, 29.5) | 0.93 | 2.25 (-0.10, 4.60) | -9.25, 13.8 |
| Alpha-910 HU | 1.01 (0.82, 1.43) | 1.24 (0.96, 1.65) | 0.88 | -0.25 (-0.35, -0.15) | -0.75, 0.25 |
| Apical-basilar difference in %Emphysema-910 HU | 3.02 (-0.19, 14.1) | 4.74 (-0.66, 11.2) | 0.76 | -0.57 (-3.83, 2.40) | -15.1, 13.9 |
| Apical-basilar difference in alpha-910 HU | -0.01 (-0.13, 0.11) | -0.03 (-0.18, 0.18) | 0.65 | 0.01 (-0.09, 0.12) | -0.51, 0.54 |
GE Lightspeed 16-slice multidetector CT scanner
Figure 4.
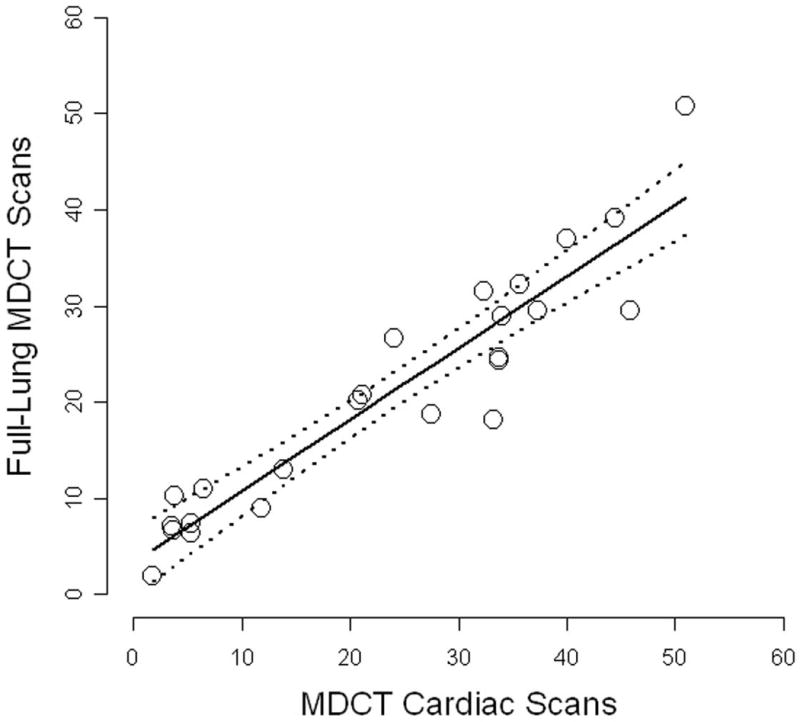
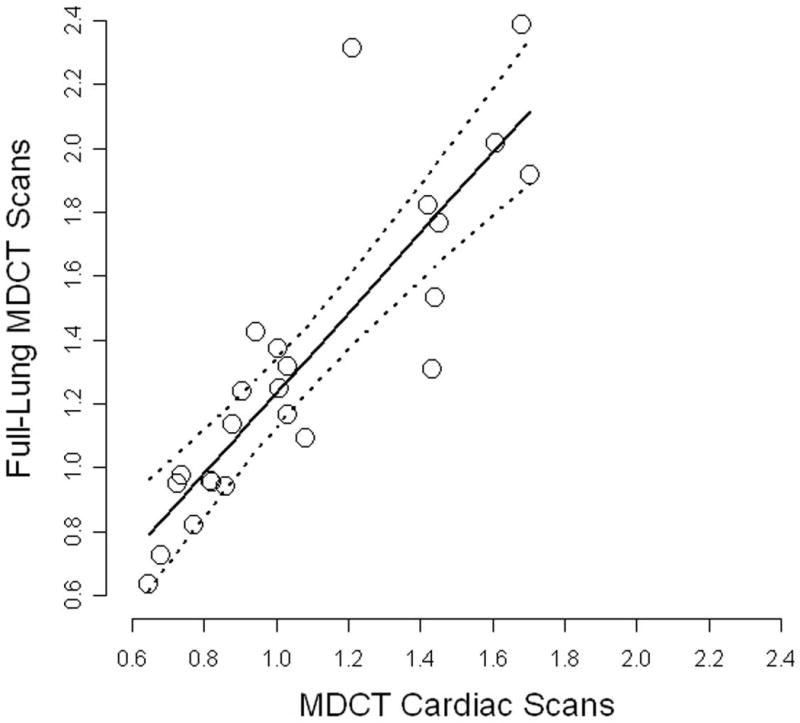
Validation of MDCT cardiac scans compared to full-lung MDCT scans on the same machine on same day. Solid line = regression line; dashed lines = 95% confidence intervals
The correlation for apical-basilar differences in percent emphysema was lower than for overall percent emphysema. Results for the components of the apical-basilar difference, however, were similar to those for overall percent emphysema. For example, the correlation of apical percent emphysema on cardiac and full-lung CTs was 0.91.
Lung density measures from EBT cardiac CT scans and MDCT full-lung scans acquired six months later are shown in the first two columns of Table 7. These showed a weaker correlation (Table 7 and Figure 5) than the MDCT comparisons. Mean differences were small and did not differ significantly from zero, although they had a larger scatter.
Table 7.
Validation of lung density measures from cardiac CT scan on EBT scanner vs. full-lung CT scan on MDCT scanner
| n=18 | Median value from EBT cardiac scan (interquartile range) | Median value from MDCT* full-lung scan (interquartile range) | Spearman's correlation coefficient | Mean difference (95% CI) | 95% limits of agreement |
|---|---|---|---|---|---|
| %emphysema-910 HU | 10.6 (8.00, 18.9) | 12.7 (3.68, 22.6) | 0.70 | -2.99 (-7.12, 1.15) | -20.5, 14.6 |
| Alpha-910 HU | 1.49 (1.28, 1.65) | 1.29 (1.03, 1.58) | 0.69 | 0.08 (-0.05, 0.21) | -0.46, 0.62 |
| Apical-basilar difference in %Emphysema-910 HU | 3.81 (-2.12, 5.74) | -0.38 (-4.11, 2.19) | 0.67 | 2.23 (-0.26, 4.92) | -8.68, 13.3 |
| Apical-basilar difference in alpha-910 HU | 0.12 (-0.08, 0.32) | 0.06 (-0.03, 0.24) | 0.49 | 0.00 (-0.12, 0.12) | -0.51, 0.52 |
Siemens 64-slice multidetector CT scanner
Figure 5.
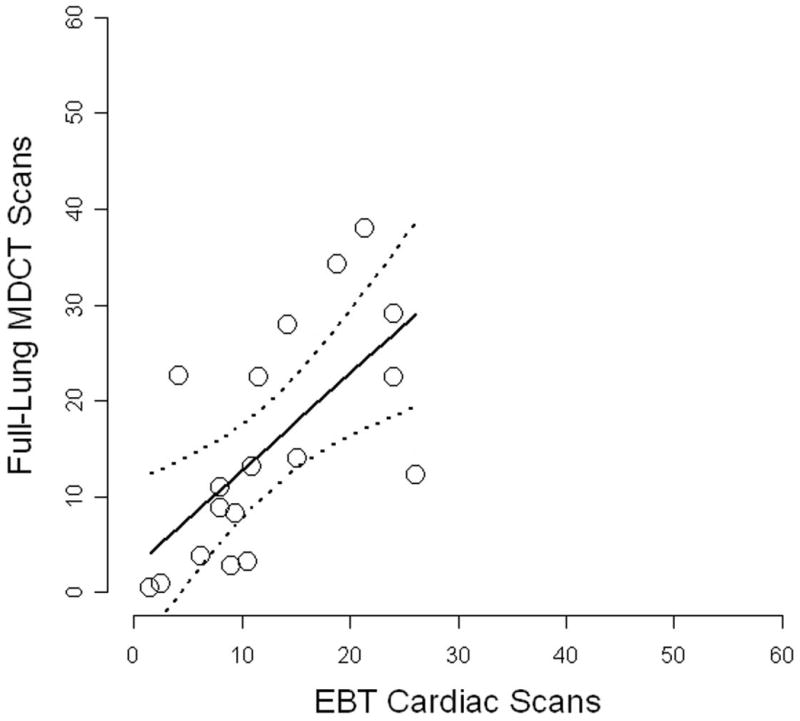
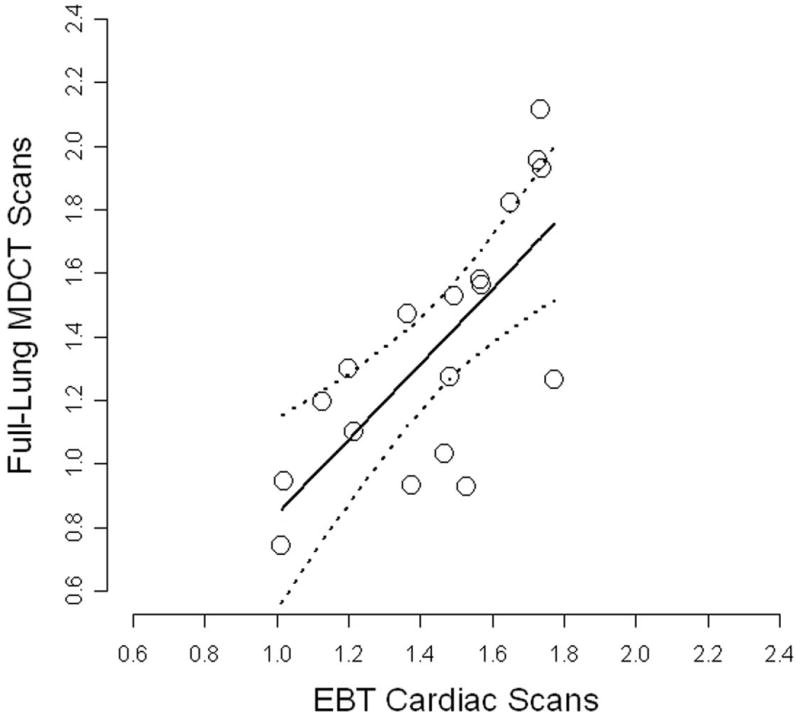
Validation of EBT cardiac scans compared to full-lung MDCT scans at separate session. Solid line = regression line; dashed lines = 95% confidence intervals
We also examined the correlation of air volumes on the cardiac compared to full-lung scans. Air volumes from cardiac scans were not surprisingly lower than full lung scans (mean -1.4 L MDCT and -1.3 L for EBT scans) but the measures were nonetheless correlated (r=0.88 for MDCT and 0.74 for EBT scans).
Discussion
Percent emphysema and alpha ascertained from cardiac CT scans were reproducible and yielded similar results, on average, to lung density measures from full-lung scans among relatively healthy participants. Reproducibility did not differ consistently by scanner type and values of percent emphysema and alpha from cardiac scans acquired on an EBT scanner were comparable to those acquired on an MDCT scanner.
The reproducibility of lung density measures from paired cardiac scans in this multicenter study was comparable to prior reports of repeated full-lung scans at single centers. The CV for alpha in the current study was similar to that for the 15th percentile density (PD-15) and percent emphysema in a study of 50 patients with emphysema (3.7% and 6.8%, respectively).12 The ICCs for percent emphysema and alpha in our relatively healthy sample were only slightly lower than those found for PD-15 and percent emphysema among 10 patients with alpha-1-antitrypsin deficiency (0.96 and 0.94, respectively).13 And the 95% limits of agreement for percent emphysema were narrower than those in a recent study of 157 smokers undergoing full-lung scans for CT screening (-13.4%, 12.6% at a -910 HU threshold).32
Reproducibility of apical-basilar differences was lower than that of the overall measures; however, the reproducibility of the apical measures and basilar measures was the same as for the overall measures. This suggests that the lower reproducibility of the apical-basilar difference was principally due to the aggregation of errors from the separate apical and basilar measures.
Various aspects of the cardiac CT protocol may have affected the reproducibility of lung density measurements. The major source of error was breath holding. Depth of inspiration may not have been reinforced as strictly as in a dedicated pulmonary study, although all subjects were instructed to inspire to TLC, and scan times were relatively long due to cardiac gating (particularly on EBT scanners). Images acquired below TLC provide an inaccurate representation of the amount of emphysema in the lung,15 and not holding the breath for the entire scan can introduce motion artifact. On the other hand, cardiac motion can affect lung density measures,33 so the cardiac gating in the MESA protocol may have improved reproducibility, and MESA employed extensive QC procedures.16
Percent emphysema and alpha measures from both EBT and MDCT scanners had good reproducibility, despite the greater prevalence of breath-holding problems on EBT scanners. Results from the comparability study showed similar lung density values on EBT and MDCT scanners.
Lung density measurements obtained from MDCT cardiac CTs using an axial scan mode with ECG gating and those obtained from standard chest CT scans using a helical thin-slice protocol were highly correlated, despite the frequently heterogeneous distribution of emphysema. Agreement was lower for apical-basilar measures. Notably, however, agreement for apical measures and basilar measures on cardiac vs. full-lung scans was as good as for overall percent emphysema, which suggests that the lower agreement for apical-basilar differences was mainly due to aggregation of error in the composite measure rather than the lack of imaging of the apices. This line of reasoning is reinforced by prior work that showed that that percent emphysema from carina-to-T11 sections of full-lung CT scans and those from full-lung sections of the same CT scans are very highly correlated among smokers (r=0.99).34 Furthermore, lung density values from the central parts of the lungs but not from the apex are known to correlate well with full-lung measurements.35
Agreement in lung density measures from EBT cardiac and MDCT full-lung scans was lower than that from MDCT cardiac and MDCT full-lung scans. Although different protocols on different types of scanners may have a large impact,14 part of the poorer agreement in the EBT group may have been due to its smaller sample size, the 6-month delay in acquisition of the MDCT scan, and the lower values for percent emphysema.
The present study had good power to assess the reproducibility of lung density measures but modest power to validate them, particularly in the EBT sample in which recruitment was curtailed for logistical reasons. The scans were mostly acquired on earlier-generation scanners with relatively long acquisition times. Our results may therefore underestimate those obtained on newer scanners with shorter acquisition times, given that the major source of error was breath-holding. The results apply to research-quality cardiac CT scans among relatively healthy participants and may not apply to clinical cardiac CT scans in all settings.
We conclude that partial lung imaging from cardiac CT scans provides a reproducible quantitative assessment of emphysema. While full-lung imaging is preferred for the quantification of emphysema, the lung imaging from paired cardiac CTs provided a reproducible and valid quantitative assessment of emphysema in a population-based sample.
Acknowledgments
This research was supported by contracts R01 HL-077612, R01 HL-075476, N01-HC-95159 through N01-HC-95165 and N01-HC-95169 from the National Heart, Lung, and Blood Institute. The authors thank the other investigators, the staff, and the participants of the MESA and MESA-Lung studies for their valuable contributions, and particularly acknowledge the assistance of Matthew Budoff, MD PhD, W. Craig Johnson, MS and Angel Solano for assistance with the completion of the study. A full list of participating MESA investigators and institutions can be found at http://www.mesa-nhlbi.org.
Funded By: National Institutes of Health: R01-HL077612, R01-HL075476, N01-HC95159-HC95165, N01-HC95169
Footnotes
- CT lung density measures from the lung windows of cardiac CT scans in a large cohort study of relatively healthy participants are reproducible.
- Cardiac CTs acquired on electron-beam CT (EBT) and multidetector CT (MDCT) scanners yield similar values of CT lung density.
- CT lung density measures from the lung windows of cardiac CT scans are generally valid compared to full-lung measures.
- CT lung density measures from the lung windows of cardiac CT scans can provide a reproducible and valid assessment of pulmonary emphysema.
Publisher's Disclaimer: This is a PDF file of an unedited manuscript that has been accepted for publication. As a service to our customers we are providing this early version of the manuscript. The manuscript will undergo copyediting, typesetting, and review of the resulting proof before it is published in its final citable form. Please note that during the production process errors may be discovered which could affect the content, and all legal disclaimers that apply to the journal pertain.
References
- 1.Petty TL, Weinmann GG. Building a national strategy for the prevention and management of and research in chronic obstructive pulmonary disease. National Heart, Lung, and Blood Institute Workshop Summary. JAMA. 1997;277:246–53. doi: 10.1001/jama.277.3.246. [DOI] [PubMed] [Google Scholar]
- 2.Mannino DM, Homa DM, Akinbami LJ, Ford ES, Redd SC. Chronic obstructive pulmonary disease surveillance -- United States, 1971-2000. Surveillance Summaries, August 2, 2002. MMWR. 2002;51:1–8. [PubMed] [Google Scholar]
- 3.Ferguson GT, Enright PL, Buist AS, Higgins MW. Office spirometry for lung health assessment in adults: A consensus statement from the National Lung Health Education Program. Chest. 2000;117:1146–61. doi: 10.1378/chest.117.4.1146. [DOI] [PubMed] [Google Scholar]
- 4.Enright PL, Kaminsky DA. Strategies for screening for chronic obstructive pulmonary disease. Respir Care. 2003;48:1194–201. [PubMed] [Google Scholar]
- 5.Coxson HO, Mayo JR, Behzad H, et al. Measurement of lung expansion with computed tomography and comparison with quantitative histology. Journal of Applied Physiology. 1995;79:1525–30. doi: 10.1152/jappl.1995.79.5.1525. [DOI] [PubMed] [Google Scholar]
- 6.Gevenois PA, de Maertelaer V, De Vuyst P, Zanen J, Yernault JC. Comparison of computed density and macroscopic morphometry in pulmonary emphysema. American Journal of Respiratory & Critical Care Medicine. 1995;152:653–7. doi: 10.1164/ajrccm.152.2.7633722. [DOI] [PubMed] [Google Scholar]
- 7.Gevenois PA, Scillia P, de Maertelaer V, Michils A, De Vuyst P, Yernault JC. The effects of age, sex, lung size, and hyperinflation on CT lung densitometry. American Journal of Roentgenology. 1996;167:1169–73. doi: 10.2214/ajr.167.5.8911175. [DOI] [PubMed] [Google Scholar]
- 8.Kauczor HU, Hast J, Heussel CP, Schlegel J, Mildenberger P, Thelen M. CT attenuation of paired HRCT scans obtained at full inspiratory/expiratory position: comparison with pulmonary function tests. European Radiology. 2002;12:2757–63. doi: 10.1007/s00330-002-1514-z. [DOI] [PubMed] [Google Scholar]
- 9.Nakano Y, Sakai H, Muro S, et al. Comparison of low attenuation areas on computed tomographic scans between inner and outer segments of the lung in patients with chronic obstructive pulmonary disease: incidence and contribution to lung function. Thorax. 1999;54:384–9. doi: 10.1136/thx.54.5.384. [DOI] [PMC free article] [PubMed] [Google Scholar]
- 10.Nishimura K, Murata K, Yamagishi M, et al. Comparison of different computed tomography scanning methods for quantifying emphysema. Journal of Thoracic Imaging. 1998;13:193–8. doi: 10.1097/00005382-199807000-00006. [DOI] [PubMed] [Google Scholar]
- 11.Parr DG, Stoel BC, Stolk J, Stockley RA. Validation of computed tomographic lung densitometry for monitoring emphysema in alpha1-antitrypsin deficiency. Thorax. 2006;61:485–90. doi: 10.1136/thx.2005.054890. [DOI] [PMC free article] [PubMed] [Google Scholar]
- 12.Shaker SB, Dirksen A, Laursen LC, et al. Short-term reproducibility of computed tomography-based lung density measurements in alpha-1 antitrypsin deficiency and smokers with emphysema. Acta Radiologica. 2004;45:424–30. doi: 10.1080/02841850410005642. [DOI] [PubMed] [Google Scholar]
- 13.Stolk J, Dirksen A, van der Lugt AA, et al. Repeatability of lung density measurements with low-dose computed tomography in subjects with alpha-1-antitrypsin deficiency-associated emphysema. Investigative Radiology. 2001;36:648–51. doi: 10.1097/00004424-200111000-00004. [DOI] [PubMed] [Google Scholar]
- 14.Yuan R, Mayo JR, Hogg JC, et al. The effects of radiation dose and CT manufacturer on measurements of lung densitometry. Chest. 2007;132:617–23. doi: 10.1378/chest.06-2325. [DOI] [PubMed] [Google Scholar]
- 15.Hoffman EA, Simon BA, McLennan G. A structural and functional assessment of the lung vai multidetector-row computed tomography: phenotyping chronic obstructive pulmonary disease. Proc Am Thorac Soc. 2006;3:519–34. doi: 10.1513/pats.200603-086MS. [DOI] [PMC free article] [PubMed] [Google Scholar]
- 16.Carr JJ, Nelson JC, Wong ND, et al. Calcified coronary artery plaque measurement with cardiac CT in population-based studies: standardized protocol of Multi-Ethnic Study of Atherosclerosis (MESA) and Coronary Artery Risk Development in Young Adults (CARDIA) study. Radiology. 2005;234:35–43. doi: 10.1148/radiol.2341040439. [DOI] [PubMed] [Google Scholar]
- 17.Detrano R, Guerci A, Carr JJ, et al. Coronary calcium as a predictor of coronary events in four racial or ethnic groups. N Engl J Med. 2008;358:1336–45. doi: 10.1056/NEJMoa072100. [DOI] [PubMed] [Google Scholar]
- 18.Bild DE, Bluemke DA, Burke GL, et al. Multi-ethnic study of atherosclerosis: objectives and design. American Journal of Epidemiology. 2002;156:871–81. doi: 10.1093/aje/kwf113. [DOI] [PubMed] [Google Scholar]
- 19.Aberle DR, Gamsu G, Henschke CI, Naidich DP, Swensen SJ. A consensus statement of the Society of Thoracic Radiology: screening for lung cancer with helical computed tomography. Journal of Thoracic Imaging. 2001;16:65–8. doi: 10.1097/00005382-200101000-00010. [DOI] [PubMed] [Google Scholar]
- 20.Guo J, Reinhardt JM, Kitaoka H, et al. Integrated system for CT-based assessment of Parenchymal lung disease; International Symposium on Biomedical Imaging; 2002. pp. 871–74. [Google Scholar]
- 21.Rationale and design of The National Emphysema Treatment Trial: a prospective randomized trial of lung volume reduction surgery. The National Emphysema Treatment Trial Research Group. Chest. 1999;116:1750–61. doi: 10.1378/chest.116.6.1750. [DOI] [PubMed] [Google Scholar]
- 22.Fishman A, Martinez F, Naunheim K, et al. A randomized trial comparing lung-volume-reduction surgery with medical therapy for severe emphysema. New England Journal of Medicine. 2003;348:2059–73. doi: 10.1056/NEJMoa030287. [DOI] [PubMed] [Google Scholar]
- 23.Tschirren J, McLennan G, Palagyi K, Hoffman EA, Sonka M. Matching and anatomical labeling of human airway tree. IEEE Transactions on Medical Imaging. 2005;24:1540–7. doi: 10.1109/TMI.2005.857653. [DOI] [PMC free article] [PubMed] [Google Scholar]
- 24.Hu S, Hoffman EA, Reinhardt JM. Automatic lung segmentation for accurate quantitation of volumetric X-ray CT images. IEEE Transactions on Medical Imaging. 2001;20:490–8. doi: 10.1109/42.929615. [DOI] [PubMed] [Google Scholar]
- 25.Zhang L, Hoffman EA, Reinhardt JM. Atlas-driven lung lobe segmentation in volumetric X-ray CT images. IEEE Transactions on Medical Imaging. 2006;25:1–16. doi: 10.1109/TMI.2005.859209. [DOI] [PubMed] [Google Scholar]
- 26.Mishima M, Hirai T, Itoh H, et al. Complexity of terminal airspace geometry assessed by lung computed tomography in normal subjects and patients with chronic obstructive pulmonary disease. Proceedings of the National Academy of Sciences of the United States of America. 1999;96:8829–34. doi: 10.1073/pnas.96.16.8829. [DOI] [PMC free article] [PubMed] [Google Scholar]
- 27.Miller MR, Hankinson J, Brusasco V, et al. Standardisation of spirometry. Eur Respir J. 2005;26:319–38. doi: 10.1183/09031936.05.00034805. [DOI] [PubMed] [Google Scholar]
- 28.Stukovsky K, Hankinson JH, Jiang R, et al. Participant and technician predictors of spirometry quality factors in the Multi-Ethnic Study of Atherosclerosis (MESA)-Lung Study (abstract) Eur Respir J. 2006 [Google Scholar]
- 29.Hankinson JL, Kawut SM, Shahar E, Smith LJ, Stukovsky KH, Barr RG. Performance of spirometry reference values in a multiethnic population. The Mesa-Lung Study. Am J Respir Crit Care Med. 2007;175:A605. abstract. [Google Scholar]
- 30.Bland JM, Altman DG. Statistical method for assessing agreement between two methods of clinical measurement. The Lancet. 1986;i:307–10. [PubMed] [Google Scholar]
- 31.Bland JM, Altman DG. Measuring agreement in method comparison studies. Statistical Methods in Medical Research. 1999;8:135–60. doi: 10.1177/096228029900800204. [DOI] [PubMed] [Google Scholar]
- 32.Gietema HA, Schilham AM, van Ginneken B, van Klaveren RJ, Lammers JW, Prokop M. Monitoring of smoking-induced emphysema with CT in a lung cancer screening setting: detection of real increase in extent of emphysema. Radiology. 2007;244:890–7. doi: 10.1148/radiol.2443061330. [DOI] [PubMed] [Google Scholar]
- 33.Wei JH, Hoffman EA, Ritman EL, Wood EH. Cardiogenic motion of right lung parenchyma in anesthetized intact dogs. J Appl Physiol. 1985;58:384–91. doi: 10.1152/jappl.1985.58.2.384. [DOI] [PubMed] [Google Scholar]
- 34.Reddy S, Barr RG, Berbaum K, McLennan G, van Beek E, Hoffman EA. Quantitative evaluation of emphysema presence and distribution via coronary calcium CT compared with full lung study (abstract). Presented at the international conference of the Radiological Society of North America; 2005. [Google Scholar]
- 35.Haraguchi M, Shimura S, Hida W, Shirato K. Pulmonary function and regional distribution of emphysema as determined by high-resolution computed tomography. Respiration. 1998;65:125–9. doi: 10.1159/000029243. [DOI] [PubMed] [Google Scholar]


