

Abstract
An anthropomorphic airway tree phantom was imaged with both hyperpolarized (HP) 3He MRI using a dynamic projection scan and computed tomography (CT). Airway diameter measurements from the HP 3He MR images obtained using a newly developed model-based algorithm were compared against their corresponding CT values quantified with a well-established method. Of the 45 airway segments that could be evaluated with CT, only 14 airway segments (31%) could be evaluated using HP 3He MRI. No airway segments smaller than ~4 mm in diameter and distal to the fourth generation were adequate for analysis in MRI. For the 14 airway segments measured, only two airway segments yielded a non-equivalent comparison between the two imaging modalities, while eight more had inconclusive comparison results, leaving only four airway segments (29%) that satisfied the designed equivalence criteria. Some of the potential problems in airway diameter quantification described in the formulation of the model-based algorithm were observed in this study. These results suggest that dynamic projection HP 3He MRI may have limited utility for measuring airway segment diameters, particularly those of the central airways.
Keywords: hyperpolarized 3He MRI, lungs, airways
Hyperpolarized (HP) 3He MRI is an emerging modality for imaging the lungs. By introducing into the lungs 3He gas hyperpolarized by five orders of magnitude, one can use HP 3He MRI to visualize ventilation distribution in both animals (1–3) and humans (4 – 6). Its clinical potential for diagnosing lung ailments was clearly demonstrated when lung ventilation patterns of subjects with lung disease visibly differed from those of healthy subjects (6,7).
One of the respiratory diseases particularly suited for investigation with HP 3He MRI is asthma. Asthma is a chronic respiratory disease characterized by inflammation, hyperresponsiveness, remodeling, and irreversible heterogeneous constriction of the airways. Because of airway constriction, regions within the lung may be deprived of ventilation. However, to date, HP 3He MRI studies of asthma have focused on the resulting ventilation distribution (2,8,9) rather than the actual airway constriction.
Through dynamic imaging protocols, the ability of HP 3He MRI to image airways has been demonstrated in both animals (10 –13) and humans (13–16). However, no work prior to that of Lewis et al. (17) attempted to measure airway caliber from HP 3He MR images. Now, encouraged by the promising results from Lewis et al.’s (17) preliminary airway diameter measurements, a rigorous model-based algorithm for quantifying airway caliber has been developed and validated on a phantom consisting of plastic tubes in series (18). The algorithm is capable of subpixel resolution, but its performance in measuring airway diameters from projection images may be hampered by the overlap of airway profiles.
While the quantification of airway diameters using HP 3He MRI is still in its infancy, computed tomography (CT) has been used to measure airway luminal area and wall thickness in both asthmatic and nonasthmatic subjects since the early 1990s (19 –23). Having had more than a decade to develop and mature, CT is the established imaging modality for quantifying airway diameters. Unfortunately, CT also uses ionizing radiation, which is an undesirable trait if repeated imaging is necessary in the event that disease development must be tracked. HP 3He MRI utilizes no ionizing radiation and is being explored as an alternative to CT for airway imaging. The credibility of HP 3He MRI for measuring airway diameters has not yet been established, but would be greatly improved if the diameters it quantifies can be shown to vary little from CT-derived values.
This study seeks to examine the accuracy of diameters measured with the application of a model-based algorithm on HP 3He MR images of respiratory airways by comparing them against their CT-based counterparts. The measurements are limited to the airway segments that can be unambiguously identified in HP 3He MR images. A successful trial would justify the extension of both the imaging technique and the quantification algorithm to human studies, especially those involving airway luminal changes such as asthma.
MATERIALS AND METHODS
Airway Tree Phantom
An anthropomorphic airway tree phantom was created from the CT data of a human subject using the rapid prototyping technique.
X-ray CT data were acquired from a normal human volunteer imaged under a separate protocol with University of Iowa IRB approval. The lung was scanned during breath-hold at total lung capacity using a four-slice multi-detector row CT scanner (MX8000; Philips, Cleveland, OH, USA). The scanner settings were: pitch = 1.5, slice thickness = 1.2 mm, slice increment = 0.62 mm, 120 kV, and 100 mAs.
A method that utilized grayscale mathematical morphology was then used to detect the airway tree (24). In this grayscale reconstruction method, a set of varying size structuring elements from two to 15 pixels was used to detect different-sized airways. After the difference image between the original and reconstructed images was computed, histogram stretching was applied to the difference image, followed by thresholding to eliminate non-airway regions and extract possible airways. Further elimination of non-airway regions was accomplished through a six-connected bounded space dilation process. Thus, the possible airway regions found by the segmentation process were connected in 3D, enabling construction of the primary airway tree. After automatic airway segmentation was completed, interactive manual segmentation was performed to add missed airways segments or subtract airway segments that were deemed erroneous. This process was performed by visual inspection and 3D region-growing of 27 neighborhoods to investigate the discontinuous regions of segmented airway segments, which came primarily from the fifth- and sixth-generation airways. When erroneous branches were found, resegmentations were carried out repeatedly to ensure that an exact replica of the airway tree will be created through rapid prototyping.
A rapid prototyping machine (FDM 2000; Stratasys, Minneapolis, MN, USA) was used to produce a physical 3D airway tree model. This machine uses a computer-controlled arm connected to a plastic extrusion device to build volumetric structures layer by layer. The machine has two heads (one to lay down the plastic compound for the structure of interest, and a second head to lay down needed support material) that can later be separated for the structure as it is being built. Using this method, a hollow airway cast was manufactured out of acrylonitrile butadiene styrene. The strength of the rapid prototyping material allows the phantom to remain rigid when laid on a flat surface.
The airway phantom consists of a total of 85 airways spanning 11 airway generations. The exact distribution of airways among these 11 generations is given in Table 1. All terminal airways of this airway phantom were open to permit gas flow.
Table 1.
Number of Airways in Each Airway Generation of the Airway Tree Cast
| Airway generation |
|||||||||||
|---|---|---|---|---|---|---|---|---|---|---|---|
| 0 | 1 | 2 | 3 | 4 | 5 | 6 | 7 | 8 | 9 | 10 | |
| Number of airways in this generation | 1 | 2 | 4 | 7 | 15 | 20 | 14 | 10 | 6 | 4 | 2 |
| Number of airways amenable to CT analysis | 1 | 2 | 4 | 7 | 14 | 12 | 4 | — | — | — | — |
| Number of airways amenable to MRI analysis | 1 | 2a | 3 | 3 | 4 | 0 | 0 | — | — | — | — |
Due to bending, one first-generation airway was processed as two separate segments.
CT Imaging
The phantom was within a fraction of a millimeter accurate to the original in vivo airway tree. This was established by rescanning the phantom using CT, remeasuring constructed diameters, and comparing the measurements to those from the in vivo CT scan. The rescan of the phantom cast was carried out with the same parameters used for the in vivo scan. The diameter measurements from this single rescan of the airway phantom were used for comparison against the MRI-quantified values.
MRI
MRI was carried out on a General Electric Signa LX 1.5T MRI scanner. For HP 3He MRI, a heterodyne system was appended to the MRI system to enable imaging at the 3He Larmor frequency. The airway tree phantom was placed inside a flexible quadrature wrap-around lung coil (Clinical MR Solutions, Brookfield, WI, USA) tuned to 3He frequency, and then positioned on the MRI scanner table in approximately the same orientation as a human lung. A series of tubing connectors and short tubing of various sizes were appended to the tracheal opening of the airway tree phantom to facilitate the injection of HP 3He using a 150-ml glass syringe. Vials containing water were placed around the airway tree model to confirm that it was within the FOV during proton coronal locator scans. No effort was made to remove the room air within the phantom or substitute it with another gas.
3He was hyperpolarized via collisional spin exchange with optically-pumped rubidium using a 3He polarizer built in-house, achieving polarizations between 10 –20%. During the experiment, pure HP 3He was first introduced into a 150-ml glass syringe. The glass syringe was then taken into the MRI room, where it was attached to the tracheal opening of the airway tree phantom and manually operated to inject the gas over a 5– 8-s time period. At the beginning of gas injection, the HP 3He MRI scan was initiated. The scan employed a fast gradient-echo (FGRE) pulse sequence acquiring coronal projection images with the following parameters: FOV = 46 cm, phase FOV = 0.75, matrix = 128 × 256, flip angle = 13–14°, TE/TR = 1.2/4.4 ms, bandwidth = 62.5 kHz, minimum delay after acquisition as permitted by the scanner software (50 ms), 25 phases/location, and sequential phase acquisition order (resulting in 25 consecutive projection images acquired). The scan took approximately 11 s, resulting in an acquisition time for each image of about 400 ms. Only one experiment was carried out.
Image Post-Processing
An image was selected from the dynamic projection MR images based on airway visibility. In this image, features judged to be clear and isolated airway segments were chosen for processing. For each airway segment, the start and end positions of the processed sections were prescribed to be distant enough from airway bifurcations, such that according to the user’s judgment the local rates of area change should be negligible. The term “one airway section” refers to a single cross-section that can be distinguished by the imaging modality. The diameters of the chosen airway sections were measured using the model-based least-squares-fit approach detailed by Tzeng et al. (18).
From the CT images, the airway segments corresponding to those measured in the 3He MR images were identified and measured as described by Tschirren et al. (24,25) using the airway visualization and 3D airway measurement software package Pulmonary Workstation (VIDA Diagnostics, Inc., Iowa City, IA, USA). This measurement methodology identifies the centerline of the 3D airway tree. The centerline defines branch points, which in turn define the airway segments. The middle two-thirds of the airway segments were assessed by calculating oblique sections that have been determined to be perpendicular to the segment centerline. Airway luminal edges were then determined to subvoxel resolution based on a method that takes into consideration the measured point spread function (PSF) of the scanner and reconstruction method employed (26). Airway section parameters were then measured from these airway sections perpendicular to the airway segment centerline.
Statistical Analysis
The 3He-MRI-measured diameters (DMRI) were evaluated in the context of the CT-measured major (Dmaj) and minor (Dmin) diameters for the same airway segment. The airway section within the region measured was the unit of analysis. For each airway segment, the amount of airway section that is quantifiable by CT and HP 3He MRI depends on the length of the airway segment as well as the resolution of the imaging modality. Since the slice thickness acquired with CT is less than the pixel dimension of the HP 3He MRI method, it correspondingly yields more measurements.
To compare the airway diameter measurements obtained using the two imaging modalities, an equivalence analysis was performed (27,28). The 95% confidence intervals (CIs) for the means of Dmaj, Dmin, and DMRI were calculated. Defining the diameter range of CT measurements to be that bordered by the upper bound of 95% CI for Dmax and the lower bound of 95% CI for Dmin, if the 95% CI for DMRI fell within the CT diameter range, equivalence was claimed. If the 95% CI for DMRI was completely outside the CT diameter range, the MRI and CT measurements were deemed inequivalent. Concordance between MRI and CT measurements was judged inconclusive if the 95% CI for DMRI and the CT diameter range had a partial overlap. SPSS version 14.0 was used for the statistical analysis. This software package employs t-statistics instead of z-statistics for cases in which the standard error of the parameter analyzed is unknown.
RESULTS
The derived shaded surface display of the resultant cast is shown in Fig. 1a. The negative of a transverse CT image of the airway phantom as visualized through the Pulmonary Workstation is shown in Fig. 1b.
FIG. 1.

Airway tree cast. a: CT-derived shaded surface display. b: Negative image of the transverse section.
The HP 3He MR image selected for processing is shown in Fig. 2. Because of the features’ low contrast, Fig. 2a presents the negative to improve the visibility of the airways without having to manipulate the image’s brightness or contrast. Figure 2b redisplays the same image, with the airway segments selected for measurement marked. The quadrilaterals in Fig. 2b are shown only to indicate which airway segments were measured; these edges are not intended to pinpoint the start and end measurement sections. Not every physical airway segment is amenable to diameter quantification through imaging. The number of airways in the first seven airway generations that lend themselves to diameter measurement using CT and MRI are listed in Table 1. Even though 15 airway segments (one first-generation airway had significant bending and had to be processed as two airway segments) are identified in Fig. 2b, only 14 were amenable to diameter measurement using MRI. The last airway segment, labeled G3-RLL, had a pixel intensity distribution across its diameter that strayed significantly from the circular model, and thus could not be processed for diameter quantification.
FIG. 2.
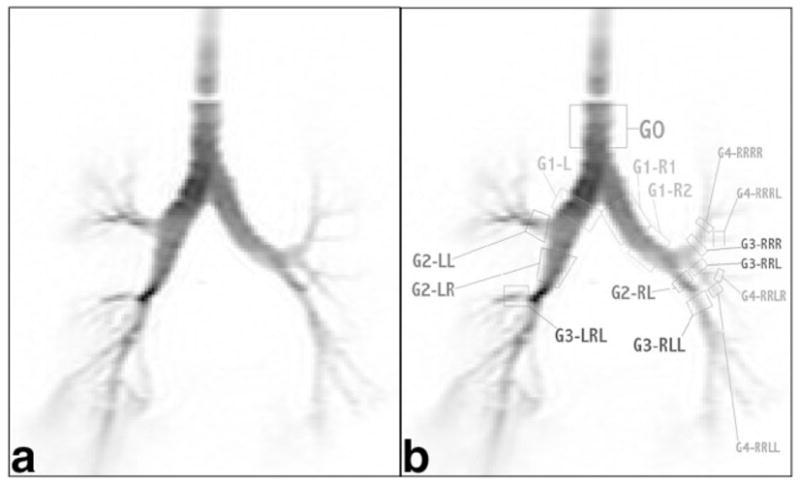
Negative HP 3He MR image of the airway tree phantom: (a) original and (b) labeled.
Figure 3 graphically compares the diameter measurements from HP 3He MRI and CT for the 14 airway segments amenable to diameter measurement by both imaging modalities, and Table 2 lists the number of measurements per airway segment made to arrive at the final values. Diameters are plotted as the mean ± 95% CI. In four of the 14 airway segments compared (G1-L, G1-R1, G2-LL, and G4-RRRL), the measurements obtained using HP 3He MRI are equivalent to CT measurements based on the definition of equivalence as prescribed in Materials and Methods. The MRI measurements of two airway segments, G3-LRL and G2-RL, completely fall beyond the 95% CI for the CT-based measurements. The equivalences between MRI-based and CT-based diameter measurements for the remaining eight airway segments are inconclusive. It should be noted that due to the resolution constraints of MRI, the airway segments compared in this study were limited to the central airways no further than the fourth-generation airway, and no smaller than ~4 mm. Even in the fourth-generation airways, only a small fraction of the airways that could be analyzed by CT were viable for analysis by MRI.
FIG. 3.

Comparison of diameter measurements from HP 3He MRI and CT (mean ± 95% CI, E = equivalent, N = non-equivalent, I = inconclusive).
Table 2.
Number of Measurements Per Airway Segment and the Resulting Means and SDs
| HP 3He MRI |
CT |
||||
|---|---|---|---|---|---|
| Sections measured | DMRI, mean (SD) | Sections measured | Dmax, mean (SD) | Dmin, mean (SD) | |
| G0 | 12 | 17.25 (0.64) | 54 | 20.38 (1.60) | 17.49 (0.49) |
| G1-L | 8 | 17.59 (0.82) | 37 | 18.97 (1.51) | 13.56 (2.49) |
| G1-R1 | 12 | 14.96 (0.47) | 40 | 15.92 (1.71) | 12.92 (1.12) |
| G1-R2 | 9 | 13.95 (0.42) | 39 | 13.75 (0.68) | 9.98 (1.15) |
| G2-LR | 10 | 13.22 (1.80) | 35 | 13.38 (1.73) | 9.57 (0.58) |
| G2-LL | 5 | 8.09 (0.73) | 23 | 10.70 (0.99) | 5.42 (0.20) |
| G2-RL | 14 | 7.37 (0.66) | 62 | 6.39 (0.37) | 4.91 (0.19) |
| G3-RRR | 3 | 6.50 (0.27) | 8 | 7.34 (0.44) | 6.18 (0.08) |
| G3-RRL | 3 | 5.89 (0.88) | 21 | 7.08 (1.82) | 5.48 (0.56) |
| G3-LRL | 6 | 5.51 (0.43) | 12 | 4.50 (0.32) | 3.40 (0.41) |
| G4-RRLL | 3 | 5.12 (0.49) | 16 | 4.85 (0.34) | 4.23 (0.21) |
| G4-RRLR | 3 | 4.18 (0.18) | 11 | 3.86 (0.18) | 3.33 (0.35) |
| G4-RRRL | 3 | 4.28 (0.09) | 13 | 4.06 (0.90) | 2.87 (0.50) |
| G4-RRRR | 3 | 6.10 (0.37) | 14 | 5.55 (1.16) | 3.37 (0.27) |
DISCUSSION
The result that of the 14 airway segments measured and compared, only two airway segments were found to be non-equivalent (being unable to satisfy the predefined criteria for equivalence between MRI- and CT-based measurements) is very encouraging. It must be emphasized, however, that we are not aware of any established or widely accepted statistical approach for evaluating equivalence. Statistical analyses, such as Student’s t-test, were developed to evaluate whether sets of numbers are different from each other, and equivalence cannot be claimed in the event that difference cannot be established. Nevertheless, since CT is the established modality for airway imaging and measurement, the MRI measurements that exceeded the limits set by the CT measurements (the eight inconclusive and two non-equivalent segments) are interpreted as deficiencies on the part of HP 3He MRI. However, visual inspection shows that there is considerable overlap between the 95% CI ranges of the MRI measurements and the range bound by the 95% CI of the CT minor and major measurements for five of these airway segments (G1-R2, G2-LR, G3-RRR, G3-RRL, and G4-RRRR).
CT scans enjoy the advantage of having much higher spatial and temporal resolution compared to HP 3He MRI. It is for this reason that CT can acquire finer, 3D data on the lung, while HP 3He MRI is limited to relatively coarser, 2D projection images. Furthermore, the algorithm that measures diameters from CT data quantifies luminal area by treating an airway section orthogonal to the centerline of the airway segment, and thus can identify and measure the long and short dimensions of the section. The information used to determine airway diameters with HP 3He MRI is the individual 1D pixel intensity profiles. Ideally, as shown in Fig. 4, if all individual airway sections are circular or elliptical, diameters measured from HP 3He MR projection images would be between the major and minor diameters measured using CT, approaching either value depending on whether the long or short axis was being projected (as θ approaches 0° or 90°). The option for comparing the MRI-measured diameter against an arithmetic or geometric mean of the CT-measured diameters is available, but this would ignore the 2D advantage provided by the CT measurement approach. The option of comparing the mean of the CT major and minor diameters does deserve consideration when evaluating changes in the airway segments’ calibers in response to treatment or stimuli. A geometric mean for the CT-measured major and minor diameters can serve as a surrogate for the airway segments’ cross-sectional areas in much the same way as the MRI-measured value is. The fractional changes in these surrogates translate easily to constriction or dilation of the airways. However, as the focus of this study is on the accuracy of the diameter measurements and not physiological changes, the means of the major and minor diameters were not evaluated.
FIG. 4.

The MRI-measured diameter should be between the CT-measured major and minor diameters, approaching either depending on the elliptical section’s angular position with the direction of projection.
Although human airway cross-sections, as seen using various imaging modalities, are generally convex, they are also frequently distorted and irregular. While this does not pose a difficulty for CT-based measurements, since any elliptical airway section would continue to have major and minor dimensions, the algorithm for measuring diameters from MR images relies on the assumption that airway sections can be well-approximated as circular or elliptical. The further airway sections deviate from circular, the more likely MRI-based measurements would cease to stay between the CT-set bounds. Since the anthropomorphic airway phantom was constructed from the CT scans of a human subject, its geometry is close to that of actual human airway trees. Thus, noncircular airway cross-sections are expected to be a contributing factor to discrepancies between MRI- and CT-measured diameters. This was foreseen by Tzeng et al. (18) during the formulation of the model-based approach for measuring diameters from projection MR images.
It would have been ideal to quantify the accuracy of HP 3He MRI relative to CT for measuring airway segment diameters by comparing the measured values section by section. Unfortunately, for each airway section pinpointed in one imaging modality, the exact corresponding airway section in the other imaging modality could not be identified with certainty. Furthermore, due to the higher spatial resolution of CT, each airway section identified in the MR images corresponds to several sections in the CT scans.
The presence of overlapping airways has also proven to be a concern for HP 3He MRI. Difficulty was encountered in identifying the CT counterparts of the airway segments chosen for diameter measurement (Fig. 2b). This is because some airway segments selected in the HP 3He MR projection image have more than one candidate in the CT images that may be the corresponding feature. This implies that a feature identified as an airway segment in the HP 3He MR image could be the result of signal coming from overlapping airways. A partial overlap of two nearly parallel airways with similar caliber could occur if two daughter airways bifurcating from the same mother airway defined a plane parallel to the direction of projection. The resultant image feature would be a misrepresentation of both daughter airways. An overlap of a smaller-caliber airway with a larger-caliber airway, whether complete or partial, will obscure the smaller airway and cause inaccuracies in the measurement of the larger airway diameter due to perturbations in the larger airway’s section pixel intensity profiles. Given the inherently smaller area of smaller airways, and the expectation that the 3He reaching the smaller airways should have less remaining polarization as a result of the dynamic imaging procedure, the perturbation to the larger airway’s pixel intensity profile is not expected to be large. However, the exact degree of this effect has not been quantified.
A potential solution to the issue of overlapping airways would be to acquire dynamic multislice images of the lung. For airways that would otherwise overlap in a projection image, multislice images could enable the differentiation of airways separated by at least one slice thickness. This solution is not without its own problems, though. Because multislice imaging excites one imaging plane at a time, coupled with a moving gas bolus, it results in the nonuniform and incomplete consumption of gas polarization. Gas polarization surviving to the lung periphery, higher compared to that in dynamic projection imaging, reduces the contrast between airways and their background.
Another potential solution to address the issue of overlapping airways without reducing the signal-to-noise ratio (SNR) due to multislice imaging is 3D imaging. Instead of acquiring 2D k-space information for each slice of finite thickness, one could employ a 3D k-space imaging protocol with a radial acquisition pulse sequence. This would achieve 3D feature resolution in the spatial domain while maintaining the contrast of 2D projection images due to uniform consumption of gas polarization. Studies are under way to investigate the options by which this approach can be implemented.
The T1 decay properties of HP 3He have not previously been studied in containers constructed from the material of the airway phantom, nor have they specifically been investigated in airway trees in vivo. While the accuracy of CT-based diameter measurements is almost unaffected by the material that encloses the 3He flow path, HP 3He MRI is sensitive to surface-induced signal relaxation. It is possible that with the low residence time of the 3He as it passes the major airways, the T1 relaxation is negligible. However, this cannot be stated with certainty for either the airway phantom tested in this study or actual human air- ways. In the event that T1 relaxation is not negligible, the manner and degree to which it affects airway diameter measurements is also unknown.
Additional difficulties may be encountered when the airway imaging and measuring technique developed herein is applied to human subjects. Introducing HP 3He into the airway tree of human subjects will require inhalation on the part of the subjects, and the expansion of individual airway segments and the overall chest, as well as heart beats, will probably lead to motion artifacts in the images, which is not an issue when dealing with an inanimate airway phantom. Furthermore, while the flowing HP 3He will eventually escape from the distal airways and disperse into the atmosphere for the airway phantom, HP 3He inhaled by a human will collect in the alveoli, where its remaining polarization may form regions of signal in the acquired images. This signal may make it harder to identify airway segments, as well as reduce the accuracy of the diameter measurements by perturbing the pixel intensity profiles. By adjusting the scanning flip angle, one can reduce the alveolar signal, but this comes with a trade-off of further limiting the airways visualized to only the central airways.
While the prevailing school of thought assigns the primary role in asthma to the distal airways, the exact contributions of both the central and distal airways remains unclear (29). Thus, the results of this trial remain encouraging for the purpose of studying asthma, even though it investigated the output from only one HP 3He MRI experiment against only one CT experiment, and only partial agreement between the two methods was obtained. Should the central airways have a role in asthmatic airway reaction, HP 3He MRI has the resolution that may quantify this role down to the fourth-generation airways, although this exercise shows that around 29% of the airways at the fourth generation were amenable to MRI evaluation. However, if the relevant airway activity occurs beyond the fourth-generation airways, HP 3He MRI will be an inadequate tool.
Except for cases in which the larger airways are completely constricted, airway diameters are expected to stay in the same size regime before and after an asthma attack. While the airway segment diameter measurements we extracted from the images may be inaccurate, we expect both the MRI modality and the model-based algorithm to be consistent. Thus, it is our opinion that errors should be in the same direction for airway segments in the same size neighborhood, i.e., if our technique overestimates airway segment diameters for small-diameter airways, it should overestimate airway segment diameters similarly for an airway before and after constriction or dilation. Since the quantities of interest for studying asthma are the changes in airway caliber before and after bronchoconstriction and bronchodilation, we believe that such bias errors should cancel out once differences are taken between airway segment diameters in various states.
SUMMARY AND CONCLUSIONS
An anthropomorphic airway tree phantom was imaged using HP 3He MRI and CT. The manner by which CT images are acquired and processed allows the airway sections to deviate from a perfect circular shape, while the circular cross-section is a basic assumption for airways imaged with HP 3He MRI. Of the 85 airways in the airway tree phantom, 45 airway segments (from 44 airways, 52% of 85) could be measured using CT, of which only 14 (31% of 45) airway segments could be evaluated using MRI. Of the 14 airway segments that were amenable to diameter measurement by both imaging modalities, comparing the 95% CI of diameter values obtained using the two different imaging modalities, four airway segments completely satisfied the equivalence criteria, eight airway segments had partial overlap of the 95% CIs, and only two airway segments were determined to be non-equivalent. The discrepancy may be due to realistic airway cross-sections that were not circular or elliptical in shape. The difficulties brought about by overlapping features in the projection HP 3He MR image were discussed, and the merits of potential solutions enumerated. The uncertainties associated with surface-induced T1 relaxation were also mentioned. When applied to human subjects, the results are likely to be poorer due to motion artifacts as well as incomplete 3He polarization consumption. Studies applying the techniques described herein to asthma research are in progress, and will enable further evaluation of the utility and accuracy of HP 3He MRI and the model-based algorithm for measuring airway segment diameters. Since asthma is currently believed to be a primarily distal airway disease, the significance of the present results remains to be determined in clinical trials, as the data gathered would be limited by the resolution of the MRI technique to the larger central airways no further than fourth generation. With the partial success achieved in this study, MRI of the respiratory airways and quantification of broncho-responses remains a field in which much progress may still be made.
Acknowledgments
Grant sponsor: National Institutes of Health; Grant number: R33-EB001689; Grant sponsor: National Aeronautics and Space Administration; Grant number: NAG9-1469.
References
- 1.Viallon M, Berthezene Y, Decorps M, Wiart M, Callot V, Bourgeois M, Humblot H, Briguet A, Cremillieux Y. Laser-polarized 3He as a probe for dynamic regional measurements of lung perfusion and ventilation using magnetic resonance imaging. Magn Reson Med. 2000;44:1–4. doi: 10.1002/1522-2594(200007)44:1<1::aid-mrm1>3.0.co;2-u. [DOI] [PubMed] [Google Scholar]
- 2.Dupuich D, Berthezene Y, Clouet P-L, Stupar V, Canet E, Cremillieux Y. Dynamic 3He imaging for quantification of regional lung ventilation parameters. Magn Reson Med. 2003;50:777–783. doi: 10.1002/mrm.10590. [DOI] [PubMed] [Google Scholar]
- 3.Viallon M, Berthezene Y, Callot V, Bourgeois M, Humblot H, Briguet A, Cremillieux Y. Dynamic imaging of hyperpolarized 3He distribution in rat lungs using interleaved-spiral scans. NMR Biomed. 2000;13:207–213. doi: 10.1002/1099-1492(200006)13:4<207::aid-nbm641>3.0.co;2-g. [DOI] [PubMed] [Google Scholar]
- 4.MacFall JR, Charles HC, Black RD, Middleton H, Swartz JC, Saam B, Driehuys B, Erickson C, Happer W, Cates GD, Johnson GA, Ravin CE. Human lung air spaces: potential for MR imaging with hyperpolarized He-3. Radiology. 1996;200:553–558. doi: 10.1148/radiology.200.2.8685356. [DOI] [PubMed] [Google Scholar]
- 5.Guenther D, Eberle B, Hast J, Lill J, Markstaller K, Puderbach M, Schreiber WG, Hanisch G, Heussel CP, Surkau R, Grossmann T, Weiler N, Thelen M, Kauczor H-U. 3He MRI in healthy volunteers: preliminary correlation with smoking history and lung volumes. NMR Biomed. 2000;13:182–189. doi: 10.1002/1099-1492(200006)13:4<182::aid-nbm642>3.0.co;2-n. [DOI] [PubMed] [Google Scholar]
- 6.Kauczor H-U, Hofmann D, Kreitner K-F, Nilgens H, Surkau R, Heil W, Potthast A, Knopp MV, Otten EW, Thelen M. Normal and abnormal pulmonary ventilation: visualization at hyperpolarized He-3 MR imaging. Radiology. 1996;201:564–568. doi: 10.1148/radiology.201.2.8888259. [DOI] [PubMed] [Google Scholar]
- 7.Gierada DS, Saam B, Yablonskiy D, Cooper JD, Lefrak SS, Conradi MS. Dynamic echo planar MR imaging of lung ventilation with hyperpolarized 3He in normal subjects and patients with severe emphysema. NMR Biomed. 2000;13:176–181. doi: 10.1002/1099-1492(200006)13:4<176::aid-nbm640>3.0.co;2-i. [DOI] [PubMed] [Google Scholar]
- 8.Altes TA, Powers PL, Knight-Scott J, Rakes G, Platts-Mills TAE, de Lange EE, Alford BA, Mugler JP, III, Brookeman JR. Hyperpolarized 3He MR lung ventilation imaging in asthmatics: preliminary findings. J Magn Reson Imaging. 2001;13:378–384. doi: 10.1002/jmri.1054. [DOI] [PubMed] [Google Scholar]
- 9.Samee S, Altes T, Powers P, de Lange EE, Knight-Scott J, Rakes G, Mugler JP, III, Ciambotti JM, Alford BA, Brookeman JR, Platts-Mills TAE. Imaging the lungs in asthmatic patients by using hyperpolarized helium-3 magnetic resonance: assessment of response to methacholine and exercise challenge. J Allergy Clin Immunol. 2003;111(6):1205–1211. doi: 10.1067/mai.2003.1544. [DOI] [PubMed] [Google Scholar]
- 10.Moller HE, Chen XJ, Chawla MS, Cofer GP, Driehuys B, Hedlund LW, Suddarth SA, Johnson GA. Sensitivity and resolution in 3D NMR microscopy of the lung with hyperpolarized noble gases. Magn Reson Med. 1999;41:800–808. doi: 10.1002/(sici)1522-2594(199904)41:4<800::aid-mrm20>3.0.co;2-k. [DOI] [PubMed] [Google Scholar]
- 11.Chen BT, Brau ACS, Johnson GA. Measurement of regional lung function in rats using hyperpolarized 3helium dynamic MRI. Magn Reson Med. 2003;49:78–88. doi: 10.1002/mrm.10336. [DOI] [PubMed] [Google Scholar]
- 12.Moller HE, Chen XJ, Chawla MS, Driehuys B, Hedlund LW, Johnson GA. Signal dynamics in magnetic resonance imaging of the lung with hyperpolarized noble gases. JMR. 1998;135:133–143. doi: 10.1006/jmre.1998.1563. [DOI] [PubMed] [Google Scholar]
- 13.Chen XJ, Chawla MS, Hedlund LW, Moller HE, MacFall JR, Johnson GA. MR microscopy of lung airways with hyperpolarized 3He. Magn Reson Med. 1998;39:79–84. doi: 10.1002/mrm.1910390113. [DOI] [PubMed] [Google Scholar]
- 14.Salerno M, Altes TA, Brookeman JR, de Lange EE, Mugler JP., III Dynamic spiral MRI of pulmonary gas flow using hyperpolarized 3He: preliminary studies in healthy and diseased lungs. Magn Reson Med. 2001;46:667–677. doi: 10.1002/mrm.1244. [DOI] [PubMed] [Google Scholar]
- 15.Wild JM, Paley MNJ, Kasuboski L, Swift A, Fichele S, Woodhouse N, Griffiths PD, van Beek EJR. Dynamic radial projection MRI of inhaled hyperpolarized 3He gas. Magn Reson Med. 2001;49:991–997. doi: 10.1002/mrm.10477. [DOI] [PubMed] [Google Scholar]
- 16.Tooker AC, Hong KS, McKinstry EL, Costello P, Jolesz FA, Albert MS. Distal airways in humans: dynamic hyperpolarized 3He MR imaging—feasibility. Radiology. 2003;227:575–579. doi: 10.1148/radiol.2272012146. [DOI] [PubMed] [Google Scholar]
- 17.Lewis TA, Tzeng Y-S, McKinstry EL, Tooker AC, Hong K, Sun Y, Mansour J, Handler Z, Albert MS. Quantification of airway diameters and 3D airway tree rendering from dynamic hyperpolarized 3He magnetic resonance imaging. Magn Reson Med. 2005;53:474–478. doi: 10.1002/mrm.20349. [DOI] [PMC free article] [PubMed] [Google Scholar]
- 18.Tzeng Y-S, Mansour J, Handler Z, Gereige J, Shah N, Zhou X, Albert MS. Measurement of the internal diameter of plastic tubes from projection MR images using a model-based least-squares fit approach. Med Phys. 2006;33:1643–1653. doi: 10.1118/1.2194427. [DOI] [PMC free article] [PubMed] [Google Scholar]
- 19.Amirav I, Kramer SS, Grunstein MM, Hoffman EA. Assessment of methacholine-induced airway constriction by ultrafast high-resolution computed tomography. J Appl Physiol. 1993;75:2239–2250. doi: 10.1152/jappl.1993.75.5.2239. [DOI] [PubMed] [Google Scholar]
- 20.Awadh N, Müller NL, Park CS, Abboud RT, FitzGerald MJ. Airway wall thickness in patients with near fatal asthma and control groups: assessment with high resolution computed tomographic scanning. Thorax. 1998;53:248–253. doi: 10.1136/thx.53.4.248. [DOI] [PMC free article] [PubMed] [Google Scholar]
- 21.King GG, Müller NL, Whitall KP, Xiang Q-S, Paré PD. An analysis algorithm for measuring airway lumen and wall areas from high-resolution computed tomographic data. Am J Respir Crit Care Med. 2000;161:574–580. doi: 10.1164/ajrccm.161.2.9812073. [DOI] [PubMed] [Google Scholar]
- 22.Brown RH, Croisille P, Mudge B, Diemer FB, Permutt S, Togias A. Airway narrowing in healthy humans inhaling methacholine without deep inspirations demonstrated by HRCT. Am J Respir Crit Care Med. 2000;161:1256–1263. doi: 10.1164/ajrccm.161.4.9806051. [DOI] [PubMed] [Google Scholar]
- 23.Little SA, Sproule MW, Cowan MD, Macleod KJ, Robertson M, Love JG, Chalmers GW, McSharry CP, Thomson NC. High resolution computed tomographic assessment of airway wall thickness in chronic asthma: reproducibility and relationship with lung function and severity. Thorax. 2002;57:247–253. doi: 10.1136/thorax.57.3.247. [DOI] [PMC free article] [PubMed] [Google Scholar]
- 24.Tschirren J, Hoffman EA, McLennan G, Sonka M. Intrathoracic airway trees: segmentation and airway morphology analysis from low dose CT scans. IEEE Trans Med Imaging. 2005;24:1529–1539. doi: 10.1109/TMI.2005.857654. [DOI] [PMC free article] [PubMed] [Google Scholar]
- 25.Tschirren J, McLennan G, Palagyi K, Hoffman EA, Sonka M. Matching and anatomical labeling of human airway tree. IEEE Trans Med Imaging. 2005;24:1540–1547. doi: 10.1109/TMI.2005.857653. [DOI] [PMC free article] [PubMed] [Google Scholar]
- 26.Reinhardt JM, D’Souza ND, Hoffman EA. Accurate measurement of intrathoracic airways. IEEE Trans Med Imaging. 1998;16:820–827. doi: 10.1109/42.650878. [DOI] [PubMed] [Google Scholar]
- 27.Blackwelder WC. “Proving the null hypothesis” in clinical trials. Controlled Clin Trials. 1982;3:345–353. doi: 10.1016/0197-2456(82)90024-1. [DOI] [PubMed] [Google Scholar]
- 28.Jones B, Jarvis P, Lewis JA, Ebbutt AF. Trials to assess equivalence: the importance of rigorous methods. Brit Med J. 1996;313:36–39. doi: 10.1136/bmj.313.7048.36. [DOI] [PMC free article] [PubMed] [Google Scholar]
- 29.Verbanck S, Schuermans D, Paiva M, Vincken W. Nonreversible conductive airway ventilation heterogeneity in mild asthma. J Appl Physiol. 2003;94:1380–1386. doi: 10.1152/japplphysiol.00588.2002. [DOI] [PubMed] [Google Scholar]