

Abstract
During mitochondrial replication, spontaneous mutations occur and accumulate asymmetrically during the time spent single stranded by the heavy strand (DssH). The predominant mutations appear to be deaminations from adenine to hypoxanthine (A → H, which leads to an A → G substitution) and cytosine to thymine (C → T). Previous findings indicated that C → T substitutions accumulate rapidly and then saturate at high DssH, suggesting protection or repair, whereas A → G accumulates linearly with DssH. We describe here the implementation of a simple hidden Markov model (HMM) of among-site rate correlations to provide an almost continuous profile of the asymmetry in substitution response for any particular substitution type. We implement this model using a phylogeny-based Bayesian Markov chain Monte Carlo (MCMC) approach. We compare and contrast the relative asymmetries in all 12 possible substitution types, and find that the observed transition substitution responses determined using our new method agree quite well with previous predictions of a saturating curve for C → T transition substitutions and a linear accumulation of A → G transitions. The patterns seen in transversion substitutions show much lower among-site variation, and are nonlinear and more complex than those seen in transitions. We also find that, after accounting for the principal linear effect, some of the residual variation in A → G/G → A response ratios is explained by the average predicted nucleic acid secondary structure propensity at a site, possibly due to protection from mutation when secondary structure forms.
INTRODUCTION
Vertebrate mitochondrial DNA (mtDNA) have an asymmetric replication mechanism that leads to asymmetry in nucleotide frequencies (Clayton, 1992a; Tanaka and Ozawa, 1994; Reyes et al., 1998; Yang et al., 2002). Recent studies suggest that these nucleotide asymmetries are caused by asymmetries in the probabilities of various, specific substitutions types (Reyes et al., 1998; Bielawski and Gold, 2002; Faith and Pollock, 2003). The major enzyme responsible for DNA replication in mitochondria is gamma polymerase (Copeland and Longley, 2003; Copeland et al., 2003), which initiates DNA synthesis directionally and asymmetrically from origins of heavy- and light-strand replication (OH and OL) that are separated by about two-thirds of the length of the genome (Clayton, 1992b; Graziewicz et al., 2002).
According to the classic model, replication of the heavy strand begins first, and proceeds from the OH towards Cytochrome b (Cyt-b) along the circular genome (Fig. 1). When the replication fork reaches the OL, a short ~30-bp stem-loop structure, replication of the light strand starts in the opposite direction, back towards Cytochrome c oxidase I (COI). After the heavy-strand replication fork has passed, the original heavy strand remains single-stranded until the light strand replication fork passes, and as a result, different portions of the genome spend different amounts of time single stranded, depending on their location on the circular mitochondrial chromosome and their distance from the OL. Since COI is close to the OL and the first gene passed by the light-strand replication fork, it spends the least amount of time single stranded, whereas Cyt-b is farthest and spends the longest time single stranded. Assuming constant average movement of the replication forks, estimates of the times spent single stranded (DssH) can easily be made (see Materials and Methods for further details). Hydrolytic deaminations occur in the single-stranded state at much higher rates than in the double-stranded state (Frederico et al., 1990, 1993; Francino and Ochman, 1997), causing a notable increase in substitutions of A → G and C → T on the heavy strand. These accumulate over the amount of time the heavy strand spends single stranded (Reyes et al., 1998; Tanaka and Ozawa, 1994), resulting in an asymmetric skew in base frequencies within single genomes, and cause asymmetry in substitution processes over evolutionary time (Bielawski and Gold, 2002; Faith and Pollock, 2003).
FIG. 1.
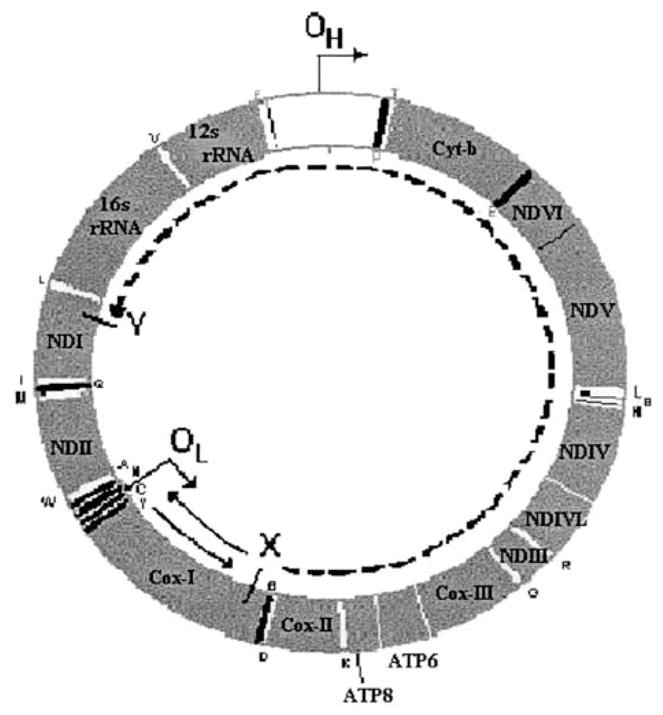
Time spent single stranded during replication of vertebrate mitochondria. The time that a site spends single stranded is determined by the site’s location. If a site is located after the origin of heavy-strand replication, OH (in the direction of heavy strand synthesis), but before the light-strand origin, OL (e.g., point X; this is case 1), then it will be single stranded for the time that it takes the heavy-strand replication fork to pass OL, plus the time for light-strand replication to begin, plus the time it takes for the light-strand replication fork to travel in the opposite direction and pass the site (e.g., return past point X). If one again assumes that initiation of light-strand synthesis is essentially instantaneous, and that the rate of movement of replication forks is constant, then the time that point X spends single stranded will be proportional to twice the distance from X to OL (solid lines.) If a site is past OL, however (e.g., point Y; case 2), then it will be single stranded for the time it takes for the light-strand replication fork to travel from wherever it is at that time to that point. If one assumes that the rate of movement of the replication forks is constant, then, for example, in the case of point Y, which is as distant from OL as is point X, then the time that point Y spends single stranded will be proportional to the distance from X to Y, in the direction of light-strand synthesis (dashed line). Since X and Y are equidistant from OL, this distance is proportional to the length of the genome minus twice the distance from X (or Y) to OL. The direction of replication from each of the origins is indicated by an arrow, protein-coding, and rRNA genes are labeled by their standard abbreviations, and tRNAs are labeled with their standard single-letter abbreviations.
Different types of substitutions respond differently to time spent single stranded (Faith and Pollock, 2003). The number of A → G substitutions appears to increase almost linearly with DssH (Faith and Pollock, 2003), and we have used linear models to estimate the slope and intercept for A → G gradients, and to provide credible intervals for these estimators (Krishnan et al., 2004a; Raina et al., in review). For C → T substitutions, there is apparently a steep initial rise with increasing DssH followed by saturation for the rest of the genome (Faith and Pollock, 2003). The gene-level analysis in this study did not provide a clear description of the C → T substitution response curve because the quick increase in substitution rates occurs mainly within COI.
Here, we introduce a method that allows the asymmetric component of the substitution probability matrix to differ among sites without imposing a linear relationship (or any other prespecified relationship) on the DssH response curve. We assume that sites with similar DssH values tend to evolve at similar rates, and this is embodied in our model through a simple hidden Markov model (HMM) component, with the strength of the asymmetric component as the hidden state, and a transition probability such that the difference between substitution probabilities at adjacent sites in the alignment is distributed as a Gaussian with mean zero. Since our purpose is to understand the substitution process, we employed a Bayesian analysis that assumed a constant phylogeny, and which relied on likely distributions for ancestral reconstructions at each node and each site considered (Krishnan et al., 2004c). The model used to obtain ancestral reconstructions was the simpler general-time-reversible (GTR) model, which introduces an unknown but conservative degree of bias towards reversibility and equal substitution probabilities among sites. The use of these simply generated ancestral state distributions allowed us to build more complicated models that varied at each site with relatively little computational costs. The base model (Bielawski and Gold, 2002) assumed symmetric rates on both strands (Lobry and Sueoka, 2002; Sueoka, 1995), and asymmetry (Bielawski and Gold, 2002) was incorporated into probabilities for specific substitution types as the “hidden” component that was variable among sites. We evaluated results using available complete primate mitochondrial genomes (plus two near outgroups) for all eight transversion types as well as the four transition substitutions.
MATERIALS AND METHODS
Genome sequences, alignment, phylogenetics, and filtering the data
We used 18 complete mitochondrial genomes for our study, mostly primates, 15 of which (13 primates and two outgroups) were available from GenBank when this study was initiated. These are: Cebus albifrons (NC_002763, Arnason et al., 2000), Gorilla gorilla (NC_001645, Horai et al., 1995); Homo sapiens (NC_001807, Ingman et al., 2000); Hylobates lar (NC_002082, Arnason et al., 1996); Lemur catta (NC_004025, Arnason et al., 2002); Macaca sylvanus (NC_002764, Arnason et al., 2000); Nycticebus coucang (NC_002765, Arnason et al., 2000); Pan paniscus (NC_001644, Horai et al., 1995); Pan troglodytes (NC_001643, Horai et al., 1995); Papio hamadryas (NC_001992, Arnason et al., 1998); Pongo pygmaeus pygmaeus (NC_001646, Horai et al., 1995); Pongo pygmaeus abelii (NC_002083, Xu and Arnason, 1996); and Tarsius bancanus (NC_002811, Schmitz et al., 2002) and outgroups Tupaia belangeri (NC_002521, Schmitz et al., 2000) and Cynocephalus variegatus (NC_004031, Arnason and Janke, 2002). Our colleagues (Raaum et al., in review) provided us with three other primate genomes, Cercopithecus aethiops, Colobus guereza, and Trachypithecus obscurus.
Gene alignments were obtained using ClustalW (Thompson et al., 1994), and a neighbor-joining (NJ) tree was obtained in PAUP* 4.0 (Swofford, 2001) using a GTR model applied to concatenated alignments of all tRNAs, rRNAs, and protein-coding genes. This tree (Fig. 2) was used in all further analyses. To analyze substitution rates that were as unaffected by selective processes as possible, we used the third codon positions in all 13 aligned regions of protein-coding genes and only from codons that were in the fourfold redundancy class in all species in the alignment. Since asymmetric mutations appear to occur on the heavy strand, we considered the substitution process for the heavy strand, rather than the coding strand (in contrast to Faith and Pollock, 2003, and many other publications).
FIG. 2.

Phylogeny of 16 primate species and two near out-groups used in this study. The neighbor-joining algorithm and distances based on the general-time reversible (GTR) model were used on a concatenation of all tRNA, rRNA, and protein coding genes. This tree, including topology and branch lengths, was used in all analyses.
Calculation of time spent single stranded
Each aligned site, s, in each genome, g, is associated with a position number, pg, which is based on the arbitrary designation of the beginning of the tRNA adjacent to the control region as position 1. The calculation of time spent single stranded at a site in a genome ( ) depends upon whether that site is located before (case 1) or after (case 2) the light-strand origin of replication, with respect to the direction of movement of the heavy-strand replication fork (Fig. 1). Calculations used the following rules:
| (1) |
where OLg is the position of the origin of light-strand replication in genome g, Lg is the length of genome g, and units are proportional to genome length (that is, in units of genomes divided by the unknown replication rate per genome). If the first position in the arbitrary numbering system of the circular genome lies between OLg and a position under consideration (Fig. 1), then a correction must be made to get the distance in nucleotides between OLg and the position. For each site, the DssHp were then averaged over all 18 species. For simplicity’s sake, in future reference we will define DssH to mean DssHp.
Posterior predictive of reconstructed ancestral states
Bayesian analyses that simplify computational complexity by assuming two substitutions per branch have been developed and used to obtain a posterior distribution of ancestral sequences, and have been tested and described elsewhere (Krishnan et al., 2004c). Here, we used this method with a GTR model and the NJ phylogeny to reconstruct a posterior distribution of ancestral states for all nodes for the third codon positions of conserved fourfold redundant codons (see Materials and Methods section). The ancestral states mapped onto internal nodes were treated as augmented data along with the original sequence data and updated during MCMC runs using a Gibbs Sampling scheme (Krishnan et al., 2004c). The distribution of ancestral sequences obtained in this fashion has been compared with other methods (i.e., ML and parsimony in PAUP*; Swofford, 2000), and relatively low frequency biases were found (Krishnan et al., 2004c).
Samples from the posterior probability distribution of these augmented data then served as the first stage of a posterior predictive distribution to relatively easily calculate our more complex model, in which the substitution matrix varied among all the sites (Krishnan et al., 2004a, 2004b; Nielsen, 2002). A full posterior predictive approach involves evaluating the accuracy of the model-based data by obtaining distributions of test-statistics such as likelihood ratio (Gelman et al., 1996). Previous studies on among-site or among-gene variation of average rates assume context dependence (Pedersen and Jensen, 2001; Robinson et al., 2003), correlation of rates among genes (Thorne and Kishino, 2003), or adjust for rate variation among genes and lineages (Hasegawa et al., 2003). None of these actually vary the substitution probability matrix (as opposed to the average rate) among sites, since with most standard methods there would be an exorbitant computational expense involved in doing so. Here, the calculation of likelihoods is feasible since the ancestral states at internal nodes are known (that is, the posterior predictive ancestral states from the simpler model are known) and used for all calculations involving the complex model.
Incorporation of a different asymmetric mutation component at each site
Our complex model starts with a symmetric “base” model that is the same at all sites and assumes strand symmetric rates of evolution (Bielawski and Gold, 2002; Lobry and Sueoka, 2002; Sueoka, 1995). This symmetric model is not necessarily reversible (in contrast to most commonly used models of evolution), and has fewer free parameters than the reversible model (Yang, 1994), since it assumes equal rates of complementary substitutions. An asymmetric component was included by adding a site-specific parameter, cp, to a particular prespecified substitution rate (e.g., A → G). This “hidden” component was also subtracted from the rate of self-change at each site for the appropriate nucleotide (e.g., A → A). The values of cp at each site were not dependent upon the magnitudes of DssH, but values of cp at consecutive sites considered were related by a Markovian component dependent on Δ, the difference in DssH at consecutive sites (when sites are ordered according to DssH), such that
| (2) |
where N is the normal distribution and α is a variable parameter that determined the magnitude of the variance; it is adjusted over the course of the Markov chain, and is constant among sites. Thus, the probability distribution of the asymmetric component at a site was a normally distributed random variable with mean equal to the asymmetric component at the previous site, and variance estimated as a function of Δ and the free parameter a. There was no specific a priori linear or nonlinear response built into this HMM. An MCMC analysis was run on the parameters of the symmetric model, the site-specific hyperparameters cp, and the HMM component α. Posterior distributions of each of these parameters were obtained using flat, uninformative priors for all parameters and symmetric, uniform, and bounded proposal distributions centered around the previous parameter value for each step in the Metropolis-Hastings algorithm (Metropolis et al., 1953; Hastings, 1970). To determine the optimal proposal ranges, simulations were run from the starting values based on the average of a short preliminary MCMC run, and using different proposal ranges. The range for each parameter proposal distribution that corresponded to 60–80% acceptance was then fixed for the subsequent runs (Krishnan et al., 2004c).
MCMC analyses with this HMM model were performed on all 12 substitution types in 12 separate runs, and site-specific response curves of substitution rates (relative to the symmetric rate for the same substitution type) versus DssH were obtained (Fig. 3).
FIG. 3.

Relative asymmetric substitution response profiles versus time spent single stranded. Asymmetric substitution rates, relative to the magnitude of the same substitution rate in the symmetric “base” model (see Materials and Methods), are plotted versus predicted time spent single stranded. The analysis of each substitution type was done separately. Substitution profiles are plotted with their reverse substitution profiles as follows (a) A → G and G → A; (b) C → T and T → C; (c) C → G and G → C; (d) A → C, and C → A; (e) T → G and G → T and (f) A → T and T → A. The substitution in each pair with the highest average relative asymmetric rate was arbitrarily designated the “forward” substitution.
Average site-specific mRNA secondary structure
The online interface mfold (Zuker, 2003) was used to predict secondary structures for each predicted mRNA for each of the eighteen species, and the “loopiness” of each site in the alignment considered (see Materials and Methods section) was estimated as the proportion of alternative structures for which that site forms a “loop” rather than a “stem.” Although biological effects may occur based on DNA structure, we used RNA structure predictions because they are more developed and probably more accurate, and take into account higher order interactions among sites (Zuker, 2003). We considered all predicted alternative secondary structures that were at least half as stable as the optimal structure, and the “loopiness” of a site was averaged across the 18 species. For analysis of the correlation between loopiness and the asymmetric substitution component for A → G substitutions, the expectation for the component was calculated based on a linear regression of the posterior average A → G/G → A ratio at each site, treating DssH as an independent variable. Residuals were then calculated as deviations from expectation. Sites were grouped into 17 categories based on degree of average loopiness, and residuals were averaged for all sites in a category. We tested for association between loopiness and average residual A → G/G → A ratio using a weighted regression analysis with loopiness as the independent variable.
RESULTS
Analysis of transition substitution response gradients
The approach outlined here is innovative in that it does not specify the precise nature of the relationship between substitution rates and time spent single stranded, and in that it allows for variation in the rate of individual substitution types at every point in the genome. We were able to evaluate a continuous response that did not require arbitrary choice of window sizes for averaging and which enabled us to detect both site-specific deviations and regional trends. The nature of each substitution response is not built into the HMM model a priori, and there is no equation, linear or otherwise, which determines the type of response visualized. Therefore, any linear or nonlinear response observed in our results is a direct reflection of trends in the data. Our use of a posterior distribution of ancestral states from a simpler model makes it feasible to create this site-specific model complexity with relatively little computational effort, and thus allow exploratory statistical analysis of complex site-specific substitution behavior.
We first demonstrated the utility of this method by analyzing transition substitution probabilities. As previously predicted (Faith and Pollock, 2003), substitution probabilities from A → G increase linearly with time spent single stranded, and C → T substitutions increase rapidly at low single-strandedness values and then remain approximately constant over the rest of the genome (Fig. 3a and b). In contrast, the reverse substitutions (G → A and T → C) remain relatively constant and the asymmetric components remain at relatively low levels (Fig. 3a and 3b). Expanded views of the number of reverse transition substitutions relative to the symmetric base model (Fig. 4a and 4b) show that there are trends in these substitutions: G → A substitutions decrease in approximately linear fashion with increasing time spent single stranded, whereas T → C substitutions increase approximately linearly, then appear to level off at about DssH = 0.9. We must caution here that relative rates below 1.0 do not make clear biological sense, since this implies that fewer mutations occur due to time spent in the single-stranded state; the observed trend in G → A substitutions may instead be due to a tendency to confound backward (G → A) substitutions with the much more prevalent forward (A → G) substitutions.
FIG. 4.

Expanded views of relative asymmetric substitution response profiles versus time spent single-stranded. We present, on appropriately expanded scales, the profiles that appear approximately flat in Figure 3 due to the scale. For the two transitions (a) G → A and (b) T → C, these are the reverse relative rates, whereas for the four transversions (c) C → G (d) A → C (e) T → G (f) A → T, these are the forward relative rates. The four reverse relative transversion rates are essentially flat on any scale.
In addition to the main trends, there is also variation in the ratios of substitution probabilities in the form of local dips and rises in the average posterior probability. It is likely that various factors, including codon bias, dinucleotide bias, and nucleic acid secondary structural features, affect substitution rates in addition to the effect of time spent single stranded. We are currently addressing these factors by combining them into even more complex phylogeny-based evolutionary models; we show preliminary results on the effect of one of these factors (nucleic acid secondary structure) below.
Analysis of transversion substitution response gradients
The relative levels of transversion substitutions tend to be much closer to 1.0 than for transitions (Fig. 3c–f), with the notable exceptions of C → G and A → C substitutions, which average around 3.3 and 1.6 times as much (respectively) as their rates in the symmetric base model and vary somewhat along the genome (Fig. 3c and 3d). Arbitrarily referring to the transversion substitutions with a greater asymmetric component as “forward” substitutions (C → G, A → C, T → G, and A → T), all four reverse substitutions are nearly constant along the genome. Furthermore, the forward T → G and A → T relative substitution rates, although on average close to 1.0, can be seen to vary considerably with time spent single stranded when the scale is expanded (Fig. 4e and 4f). Posterior means for α (the parameter that controls correlation between adjacent sites) are much higher for forward transitions (C → T and A → G) compared to backward transitions (T → C and G → A) and all transversions.
The variation in forward transversion response curves with time spent single stranded is intriguing in that they tend to increase after a short lag, peak around DssH = 0.9, then decrease (Fig. 4). Again, we are cautious about overinterpreting this, since the observed trend may be due to a tendency to confound the transversion substitutions with the more strongly biased and variable G → A and C → T substitutions. It is also hard to see a plausible biological reason why mutation rates should decrease with longer times spent single stranded, and a complicated interactive bias caused by both transition types seems more likely. Transcription could be invoked, but there is no clear difference in the transition responses for ND6, which is transcribed on the opposite side as the other protein-coding genes (Fig. 3; Faith and Pollock, 2003). This interpretation is supported by the shape of the T → G curve, which is almost exactly the opposite of the A → T curve, and reaches a minimum at the same point the others reach a maximum. This point corresponds to the ND4 gene, which has been previously noted to have unusually strong asymmetric features for undetermined reasons (Bielawski and Gold, 2002). If taken at face value, the situation with transversions appears to be complex, and in future studies we will incorporate simulations to determine the strength of biases that strongly asymmetric substitution process may have on inferring other substitution processes.
Correlation of secondary structure and residual transition bias
To determine whether nucleic acid secondary structure has a detectable effect on asymmetric transition rates, we looked for a correlation between secondary structure and residual transition asymmetry. Since the average A → G/G → A ratio (ρ) has an approximately linear relationship with time spent single stranded, we performed a linear regression on this average, treating DssH as an independent variable. Residuals were then taken as differences from the expectation, ρ = 1.2839 * DssH + 1.2242. The residuals are larger when there is more loopiness (less secondary structure) at a site (Fig. 5). A possible explanation for this preliminary result is that formation of secondary structure in the “single-stranded” DNA decreases the effective time spent single stranded (Seligmann et al., in review), thus decreasing the A → G mutation rate.
FIG. 5.

Excess purine transition asymmetry as a function of loopiness. Residual A → G/G → A ratios were calculated assuming DssH as an independent variable in a standard linear regression analysis. The loopiness at each site was calculated as the fraction of structures in which that site was part of a loop (rather than a stem); all predicted mRNA secondary structures that were at least half as stable as the optimal structure in each species were considered. Sites were grouped into 17 categories based on their loopiness values, and the correlation coefficient (r = 0.564, p = 0.015) was calculated with points weighted by the number of sites in each category. Points are labeled with the number of sites in each category.
DISCUSSION
We have shown here that individual asymmetric mutation processes can be detected and evaluated at a site-specific level along the mitochondrial genome. Such evaluation will be important in developing a more complete and unified model of evolution in mitochondrial genomes. We have obtained an indirect indication that secondary structure may modify mutation and substitution processes, and in other work we are also incorporating the effects of adjacent nucleotides (which can strongly modify substitution rates) and codon bias. Many transversions show no indication of asymmetric substitution bias due to single strandedness, and only two of them show strong asymmetric bias. Interestingly, the two most biased transversions (C → G and A → C) do not correspond to the best-characterized lesion from oxidative damage, the conversion of the guanine to 8-oxoguanosine, which can mispair with adenine leading to a G → T transversion substitution. There are indications, however, that methylglyoxyl (a major product of DNA oxidation), readily produces C → G transversions in vivo (Murata-Kamiya et al., 2000). The variation in the transversion substitution response curves is not simple, and may well be the result of fairly simple mutation response curves (linear or saturating) combined with inference bias introduced by the much stronger transition response curves.
Future work should determine how much inference bias can be expected with these methods, and whether such bias can be corrected for in a combined analysis. It will also be important to expand the analysis to do comparative analysis of other taxon groups and larger taxon groups. The primates were chosen partly because they were the vertebrate family with the largest representation of complete genomes, but presuming that the rapid rate of increase in complete genomes continues (from 67 to over 300 in the last 4 years), expanded comparative analyses will soon be feasible. The results of the work presented here may be useful for improving phylogenetic analysis, for carrying out refined comparative analysis of substitution processes and replicative mechanisms, and in improving estimates of synonymous DNA substitution processes for incorporation into and comparison with amino acid substitution models, which may allow more accurate detection of selection and functional divergence.
Acknowledgments
We thank T. Disotell’s group for sharing genomes prior to publication. This work was supported by grants from the National Institutes of Health (GM065612-01 and GM065580-01), and the State of Louisiana Board of Regents [Research Competitiveness Subprogram LEQSF (2001-04)-RD-A-08 and the Millennium Research Program’s Biological Computation and Visualization Center] and Governor’s Biotechnology Initiative.
References
- ARNASON U, JANKE A. Mitogenomic analyses of eutherian relationships. Cytogenet Genome Res. 2002;96:20–32. doi: 10.1159/000063023. [DOI] [PubMed] [Google Scholar]
- ARNASON U, ADEGOKE JA, BODIN K, BORN EW, ESA YB, GULLBERG A, NILSSON M, SHORT RV, XU X, JANKE A. Mammalian mitogenomic relationships and the root of the eutherian tree. Proc Natl Acad Sci USA. 2002;99:8151–8156. doi: 10.1073/pnas.102164299. [DOI] [PMC free article] [PubMed] [Google Scholar]
- ARNASON U, GULLBERG A, BURGUETE AS, JANKE A. Molecular estimates of primate divergences and new hypotheses for primate dispersal and the origin of modern humans. Hereditas. 2000;133:217–228. doi: 10.1111/j.1601-5223.2000.00217.x. [DOI] [PubMed] [Google Scholar]
- ARNASON U, GULLBERG A, JANKE A. Molecular timing of primate divergences as estimated by two nonprimate calibration points. J Mol Evol. 1998;47:718–727. doi: 10.1007/pl00006431. [DOI] [PubMed] [Google Scholar]
- ARNASON U, GULLBERG A, XU X. A complete mitochondrial DNA molecule of the white-handed gibbon, Hylobates lar, and comparison among individual mitochondrial genes of all hominoid genera. Hereditas. 1996;124:185–189. [Google Scholar]
- BIELAWSKI JP, GOLD JR. Mutation patterns of mitochondrial H- and L-strand DNA in closely related Cyprinid fishes. Genetics. 2002;161:1589–1597. doi: 10.1093/genetics/161.4.1589. [DOI] [PMC free article] [PubMed] [Google Scholar]
- CLAYTON DA. Transcription and replication of animal mitochondrial DNAs. Int Rev Cytol. 1992a;141:217–232. doi: 10.1016/s0074-7696(08)62067-7. [DOI] [PubMed] [Google Scholar]
- CLAYTON DA. Structure and function of the mitochondrial genome. J Inherit Metab Dis. 1992b;15:439–447. doi: 10.1007/BF01799602. [DOI] [PubMed] [Google Scholar]
- COPELAND WC, LONGLEY MJ. DNA polymerase gamma in mitochondrial DNA replication and repair. Sci World J. 2003;3:34–44. doi: 10.1100/tsw.2003.09. [DOI] [PMC free article] [PubMed] [Google Scholar]
- COPELAND WC, PONAMAREV MV, NGUYEN D, KUNKEL TA, LONGLEY MJ. Mutations in DNA polymerase gamma cause error prone DNA synthesis in human mitochondrial disorders. Acta Biochim Pol. 2003;50:155–167. [PubMed] [Google Scholar]
- FAITH JJ, POLLOCK DD. Likelihood analysis of asymmetrical mutation bias gradients in vertebrate mitochondrial genomes. Genetics. 2003;165:735–745. doi: 10.1093/genetics/165.2.735. [DOI] [PMC free article] [PubMed] [Google Scholar]
- FRANCINO MP, OCHMAN H. Strand asymmetries in DNA evolution. TRIGS. 1997;13:240–245. doi: 10.1016/S0168-9525(97)01118-9. [DOI] [PubMed] [Google Scholar]
- FREDERICO LA, KUNKEL TA, SHAW BR. A sensitive genetic assay for the detection of cytosine deamination: Determination of rate constants and the activation energy. Biochemistry. 1990;29:160–174. doi: 10.1021/bi00462a015. [DOI] [PubMed] [Google Scholar]
- FREDERICO LA, KUNKEL TA, SHAW BR. Cytosine deamination in mismatched base-pairs. Biochemistry. 1993;32:6523–6530. doi: 10.1021/bi00077a005. [DOI] [PubMed] [Google Scholar]
- GELMAN A, MENG X, STERN H. Posterior predictive assessment of model fitness via realized discrepancies. Stat Sinica. 1996;6:733–807. [Google Scholar]
- GRAZIEWICZ MA, DAY BJ, COPELAND WC. The mitochondrial DNA polymerase as a target of oxidative damage. Nucleic Acids Res. 2002;30:2817–2824. doi: 10.1093/nar/gkf392. [DOI] [PMC free article] [PubMed] [Google Scholar]
- HASEGAWA M, THORNE JL, KISHINO H. Time scale of eutherian evolution estimated without assuming a constant rate of molecular evolution. Genes Genet Syst. 2003;78:267–283. doi: 10.1266/ggs.78.267. [DOI] [PubMed] [Google Scholar]
- HASTINGS WK. Monte Carlo sampling methods using Markov chains and their applications. Biometrika. 1970;57:97–109. [Google Scholar]
- HORAI S, HAYASAKA K, KONDO R, TSUGANE K, TAKAHATA N. Recent African origin of modern humans revealed by complete sequences of hominoid mitochondrial DNAs. Proc Natl Acad Sci USA. 1995;92:532–536. doi: 10.1073/pnas.92.2.532. [DOI] [PMC free article] [PubMed] [Google Scholar]
- INGMAN M, KAESSMANN H, PAABO S, GYLLENSTEN U. Mitochondrial genome variation and the origin of modern humans. Nature. 2000;408:708–713. doi: 10.1038/35047064. [DOI] [PubMed] [Google Scholar]
- KRISHNAN NM, RAINA SZ, POLLOCK DD. Analysis of among-site variation in asymmetric substitution patterns. Biol Proceed Online. 2004a;6:180–188. doi: 10.1251/bpo88. [DOI] [PMC free article] [PubMed] [Google Scholar]
- KRISHNAN NM, SELIGMANN H, RAINA SZ, POLLOCK DD. Phylogenetic analysis of site-specific perturbations in asymmetric mutation gradients. In: Gramada A, Bourne PE, editors. Currents in Computational Molecular Biology. ACM Press; San Diego, CA: 2004b. pp. 266–267. [Google Scholar]
- KRISHNAN NM, SELIGMANN H, STEWART CB, DE KONING APJ, POLLOCK DD. Ancestral sequence reconstruction in primate mitochondrial DNA: Compositional bias and effect on functional inference. Mol Biol Evol. 2004c;21:1871–1883. doi: 10.1093/molbev/msh198. [DOI] [PubMed] [Google Scholar]
- LOBRY JR, SUEOKA N. Asymmetric directional mutation pressures in bacteria. Genome Biol. 2002;3:research0058.1–research0058.14. doi: 10.1186/gb-2002-3-10-research0058. [DOI] [PMC free article] [PubMed] [Google Scholar]
- METROPOLIS N, ROSENBLUTH AW, ROSENBLUTH MN, TELLER AH, TELLER E. Equations of state calculations by fast computating machines. J Chem Phys. 1953;21:1087–1092. [Google Scholar]
- MURATA-KAMIYA N, KAMIYA H, KAJI H, KASAI H. Methylglyoxal induces G:C to C:G and G:C to T:A transversions in the supF gene on a shuttle vector plasmid replicated in mammalian cells. Mutat Res. 2000;468:173–182. doi: 10.1016/s1383-5718(00)00044-9. [DOI] [PubMed] [Google Scholar]
- NIELSEN R. Mapping mutations on phylogenies. Syst Biol. 2002;51:729–739. doi: 10.1080/10635150290102393. [DOI] [PubMed] [Google Scholar]
- PEDERSEN JL, JENSEN JL. A dependent-rates model and an MCMC-based methodology for the maximum-likelihood analysis of sequences with overlapping reading frames. Mol Biol Evol. 2001;18:763–776. doi: 10.1093/oxfordjournals.molbev.a003859. [DOI] [PubMed] [Google Scholar]
- REYES A, GISSI C, PESOLE G, SACCONE C. Asymmetrical directional mutation pressure in the mitochondrial genome of mammals. Mol Biol Evol. 1998;15:957–966. doi: 10.1093/oxfordjournals.molbev.a026011. [DOI] [PubMed] [Google Scholar]
- ROBINSON DM, JONES DT, KISHINO H, GOLDMAN N, THORNE JL. Protein evolution with dependence among codons due to tertiary structure. Mol Biol Evol. 2003;20:1692–1704. doi: 10.1093/molbev/msg184. [DOI] [PubMed] [Google Scholar]
- SCHMITZ J, OHME M, ZISCHLER H. The complete mitochondrial genome of Tupaia belangeri and the phylogenetic affiliation of scandentia to other eutherian orders. Mol Biol Evol. 2000;17:1334–1343. doi: 10.1093/oxfordjournals.molbev.a026417. [DOI] [PubMed] [Google Scholar]
- SCHMITZ J, OHME M, ZISCHLER H. The complete mitochondrial sequence of Tarsius bancanus: Evidence for an extensive nucleotide compositional plasticity of primate mitochondrial DNA. Mol Biol Evol. 2002;19:544–553. doi: 10.1093/oxfordjournals.molbev.a004110. [DOI] [PubMed] [Google Scholar]
- SUEOKA N. Intrastrand parity rules of DNA base composition and usage biases of synonymous codons. J Mol Evol. 1995;40:318–325. doi: 10.1007/BF00163236. [DOI] [PubMed] [Google Scholar]
- SWOFFORD DL. PAUP*. Phylogenetic Analysis Using Parsimony (*and Other Methods). Version 4. Sunderland, MA: Sinauer Associates; 2001. [Google Scholar]
- TANAKA M, OZAWA T. Strand asymmetry in human mitochondrial DNA mutations. Genomics. 1994;22:327–335. doi: 10.1006/geno.1994.1391. [DOI] [PubMed] [Google Scholar]
- THOMPSON JD, HIGGINS DG, GIBSON TJ. CLUSTAL W: Improving the sensitivity of progressive multiple sequence alignment through sequence weighting, position-specific gap penalties and weight matrix choice. Nucleic Acids Res. 1994;22:4673–4680. doi: 10.1093/nar/22.22.4673. [DOI] [PMC free article] [PubMed] [Google Scholar]
- THORNE JL, KISHINO H. Divergence time and evolutionary rate estimation with multilocus data. Syst Biol. 2002;51:689–702. doi: 10.1080/10635150290102456. [DOI] [PubMed] [Google Scholar]
- XU X, ARNASON U. A complete sequence of the mitochondrial genome of the western lowland gorilla. Mol Biol Evol. 1996;13:691–698. doi: 10.1093/oxfordjournals.molbev.a025630. [DOI] [PubMed] [Google Scholar]
- YANG MY, BOWMAKER M, REYES A, VERGANI L, ANGELI P, GRINGERI E, JACOBS HT, HOLT IJ. Biased incorporation of ribonucleotides on the mitochondrial L-strand. Cell. 2002;111:495–505. doi: 10.1016/s0092-8674(02)01075-9. [DOI] [PubMed] [Google Scholar]
- YANG Z. Estimating the patterns of nucleotide substitution. J Mol Evol. 1994;10:1396–1401. doi: 10.1007/BF00178256. [DOI] [PubMed] [Google Scholar]
- ZUKER M. Mfold web server for nucleic acid folding and hybridization prediction. Nucleic Acids Res. 2003;31:3406–3415. doi: 10.1093/nar/gkg595. [DOI] [PMC free article] [PubMed] [Google Scholar]