Abstract
Modern NMR spectrometers require receivers to work within their linear ranges to maintain high fidelity line-shape and peak integration. For better sensitivity, the receiver gain has to be optimized to detect dilute analytes; however, gain compression needs to be avoided. Here we explore if and how linear receiver performance can be achieved for a couple of representative gain settings on a spectrometer. In the case of slight receiver gain compression, not only will the peak integral be attenuated but a very small line-shape change can also be observed. Hence we can resort to resonance integration and line-shape analysis for gain compression diagnosis. As such, NMR signals, regardless of their observed amplitude difference in frequency domain, can be accurately compared in quantitative analysis.
Keywords: NMR, gain compression, line-shape, receiver gain function, quantitative analysis
The NMR experiment has been traditionally considered linear [1]. As a result, the observed FID is expected to be proportional to the number of spins (or effective transverse magnetization at the on-set of the observation). For most NMR active nuclei, the classic Bloch equations suggest that NMR signal amplitude (resonance integral in frequency domain) is indifferent to chemical shift or relaxation rate. Even for concentrated samples that may suffer from radiation damping, the Bloch equations can still retain their forms without major revisions if the excitation angle is kept small [2]. Hence a universal internal concentration standard becomes possible, regardless of the particular reference compound identity or its concentration.
Recently, we suggested the use of the solvent in a NMR sample as the concentration standard [3]. A protonated solvent offers an excellent primary standard because its concentration is frequently known or easily calculated. For an example, in a dilute biological sample, the total proton concentration of solvent water can be invariably treated as 111 M at room temperature (without consideration of deuterium for spectrometer locking), which can thus serve as a convenient internal concentration standard for any analyte in that solution. On the other hand, for a highly deuterated solvent, the residual proton signal can be used as an alternative reference [4]. Nevertheless, in the latter case, the residual proton concentration has to be calibrated independently and accurately. Again, a separate solvent, preferably fully protonated, provides a concentration standard not only for that residual solvent signal but also for any other secondary or artificial reference in general [5, 6].
While the solvent concentration referencing enjoys many undisputable merits such as stability, low cost and simplicity in terms of sample preparation and handling, there are some technical challenges in dealing with a high concentration solvent in NMR. Presumably, the solvent concentration can be easily thousands or even millions times higher than that of the analyte, leading to two potential issues: first, radiation damping for the strong solvent signal frequently causes distortions in the resonance phase and amplitude in frequency domain [7]; and second, the receiver may not detect the strong solvent signal as efficiently as the weak analyte.
For the first issue, the excitation pulse for the solvent can be limited to a very small angle so that the observed resonance integral is strictly proportional to the transverse magnetization or sine of the excitation angle [2]. On a modern spectrometer, almost any realistic excitation angle can be readily produced through the fine control of the pulse length and transmitter power attenuation. Hence the solvent signal, in spite of its source from a concentrated solvent, can always be generated linearly. Alternatively, the solvent’s 13C satellite peak, if it exists and is clearly separated from the analyte signals, can be utilized as the concentration reference [8].
The second issue calls for linear detection by the NMR receiver for the input FIDs (free induction decay) of different amplitudes. For strong FIDs, the NMR receiver (which can be treated as a cascade of analog amplifiers) may exhibit gain compression, which is a well known phenomenon for a typical analog amplifier: when the input exceeds certain level or a very large gain is attempted, the receiver output is attenuated compared to the expected based on a truly linear amplification. In extreme cases, the output FID signal is seen as clipped and the resulting spectrum may appear to have rolling baselines or images [9].
Assuming the receiver is linear for a modern NMR spectrometer, we have suggested the definition of receiver gain function so that spectra acquired with different receiver gains can be quantitatively compared [10, 11]. However, we still need to provide evidence showing that indeed the receiver gain function is independent of the input FID size to the accuracy of 2% or better. Here we will demonstrate if and how a linear receiver can be achieved on a typical commercial spectrometer. We further propose a simple NMR spectroscopic method that relies on a very small but clearly visible line-shape change to detect the receiver gain compression as small as a few percent.
EXPERIMENTAL SECTION
1D proton spectra were acquired for water samples on a Bruker Avance 500 MHz NMR spectrometer equipped with a z-gradient inverse probe. The sweep width was 12 ppm and acquisition time was 2.7 s. Relaxation delays were set to 10 s so that full magnetization recovery could be assumed before each scan started.
For simplicity, we chose two receiver gain settings to demonstrate if the receiver gain compression occurs. The receiver gain was first fixed at 1024 and the proton signal from a 2 Hz doped D2O sample (containing about 0.1% residual H2O) was observed. The transmitter power attenuation was 30 dB and the pulse length varied from 4 to 80 µs (nominal 90° pulse length was 10.8 µs at 0 dB), resulting in the excitation angles from 1.04° to 20.8°. Then the receiver gain was fixed at 1 and the proton signal from a 5% D2O in H2O sample was observed the same way (nominal 90° pulse length was 10.6 µs at 0 dB). For either receiver gain setting, the highest FID output was less than 1/3 of what can be possibly given by the receiver (maximum output level).
To find the highest FID output that still does not appear to have any visible receiver gain compression, we first set the receiver gain to 128 and observe the proton signal from the above 5% D2O sample. The excitation pulse length varied from 4 to 32 µs with transmitter attenuation set to 48 dB, resulting in excitation angles from 0.14° to 1.1°. The observed largest FID data-point was about 72% of the maximum output level.
All FIDs were exponentially line-broadened by 0.3 Hz, Fourier transformed, phased and base-line corrected. The NMR signal amplitude in the frequency domain was treated as the water resonance integration.
RESULTS AND DISCUSSIONS
In theory, the NMR signal amplitude is proportional to steady-state magnetization and sine of the excitation angle θ. In practice, we had to confine the current study to small pulse angles (so that sinθ /θ is about 1) so that the probe’s RF inhomogeneity would have minimal impact. If the receiver is linear, the observed FID signal is expected to be linearly proportional to the input FID with a fixed receiver gain setting. On the other hand, if the input signal size or the receiver gain is sufficiently large, gain compression in the receiver may occur: the observed resonance integral normalized by sinθ is likely to decrease as the excitation angle increases.
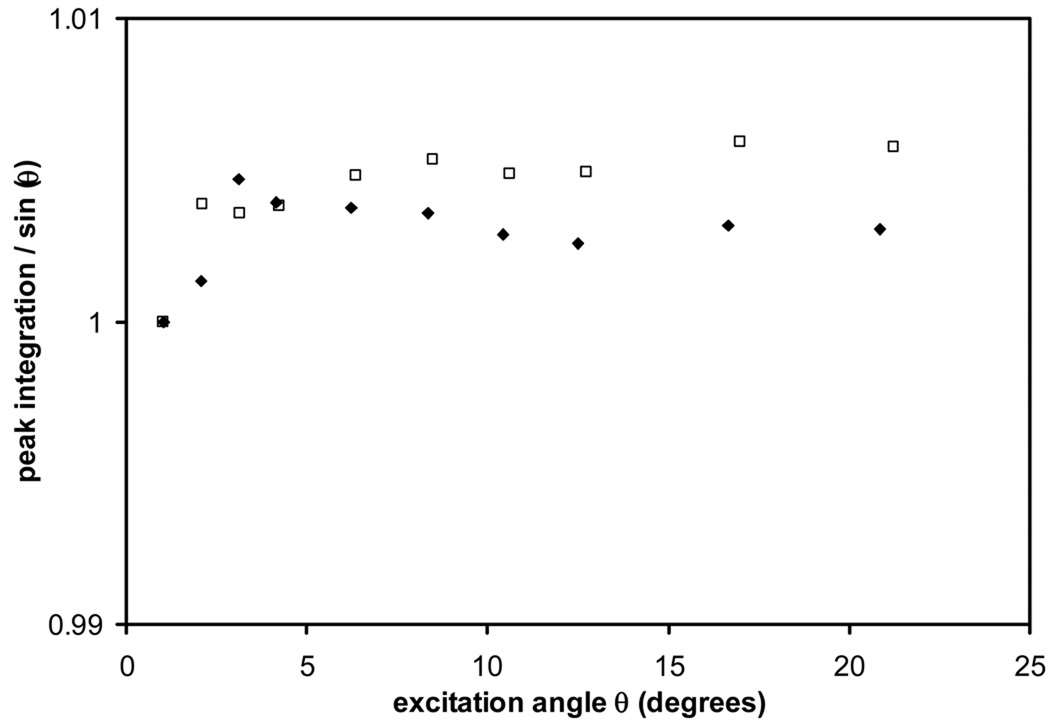
In Fig 1, the ratio of NMR signal amplitude and sinθ is plotted as solid diamonds for a spectrometer with a receiver gain parameter of 1024, compared to open squares for a receiver gain of 1, as a function of the excitation angle. Standard deviations, which were measured in triplicates, are too small to be shown clearly (within 0.1% for all data points). For ease of comparison, the NMR signal / sinθ ratio is normalized to 1 for the smallest pulse excitation angle. Within either series (receiver gain of 1 or 1024), the normalized resonance integral can be simply treated as a constant, though the input FID varied by about 20 times in amplitude when the pulse angle was increased from 1° to 20.8° (or from 4 to 80 µs in pulse length with the same 30 dB transmitter power attenuation). Hence the output NMR signal amplitude changes proportionally to sinθ. As such, the NMR receiver for this spectrometer is linear to the accuracy of 1% under our operating conditions.
Figure 1.
The linearity of the NMR receiver can be verified by calculating NMR resonance integration normalized by sinθ for a Bruker spectrometer with two representative gain settings. Open squares: receiver gain = 1; solid diamonds: receiver gain = 1024.
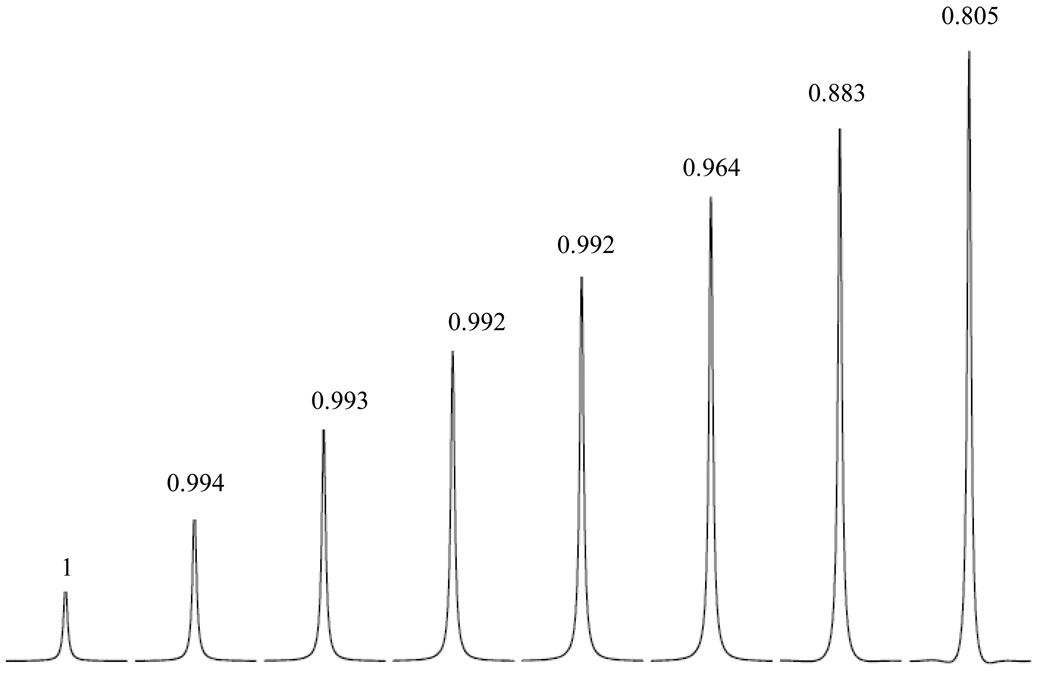
To explore the typical symptoms and consequences for the NMR receiver gain compression, the receiver gain was fixed at 128 for the 5% D2O sample and the excitation pulse angle was increased gradually so that the maximum FID signal reached 11% to 72% of the maximum output level of the receiver. Fig 2 summarizes the observed resonance, peak integration normalized by sinθ and the corresponding percentage highest FID output relative to the maximum level. For the particular receiver in the current study, if the highest output FID is 55% or less than the maximum output, the peak integration from the Fourier-transformed spectrum is proportional to the corresponding FID input from the sample (manipulated by sinθ) and we conclude that all observed peaks are linearly detected. On the other hand, when the highest FID output exceeds 65% of the maximum, the NMR signal is under-detected by the receiver and the peak integration normalized by sinθ is significantly less than 1. In the more severe case of 72% of maximum output, NMR signal is under-detected by almost 20%. Although the rolling baselines is clearly visible to the experienced eyes when the receiver gain compression is severe, the spectral artifacts are less obvious if the receiver is just slightly compressed (e.g. 65% maximum output). Concentration determination based on peak integration, without recognizing gain compression when it occurs, can lead to significant errors. Hence it is necessary to develop sensitive methods to identify slight receiver gain compression for accurate quantitations.
Figure 2.
Linear NMR receiver many not be maintained when the FID output surpasses 55% of the maximum receiver output for a Bruker spectrometer. The numbers above and under the resonance peak represents the NMR peak integration normalized by sinθ and the highest FID signal level as a percentage of maximum output allowed by the receiver. Though rolling baselines are clearly visible when FID output reaches 72% of the maximum, they are less apparent when the receiver is just slightly compressed (at the 65% level).
Generally the gain compression for an amplifier can be characterized by the 3rd order intercept point (TOI) or 1 dB compression point. However, neither method is fine enough to meet the high demand of modern high resolution NMR spectroscopy because gain compression of several percent can lead to a similar amount of peak under-integration. While clear spectral artifacts can be observed in cases of severe gain compression [9], we consider the situation when gain compression is relatively small. For simplicity, we assume that receiver gain compression impacts only a few initial data points in an exponentially decaying FID. Thus the net effect of gain compression can be treated as a window function to an ideal FID: for most “normal” FID data points, the window function takes the values of 1; for data points near time zero that have stronger FID signal, the window function is slightly less than 1. We will see that not only the resonance integration would be reduced but also very subtle line-shape change can be observed.
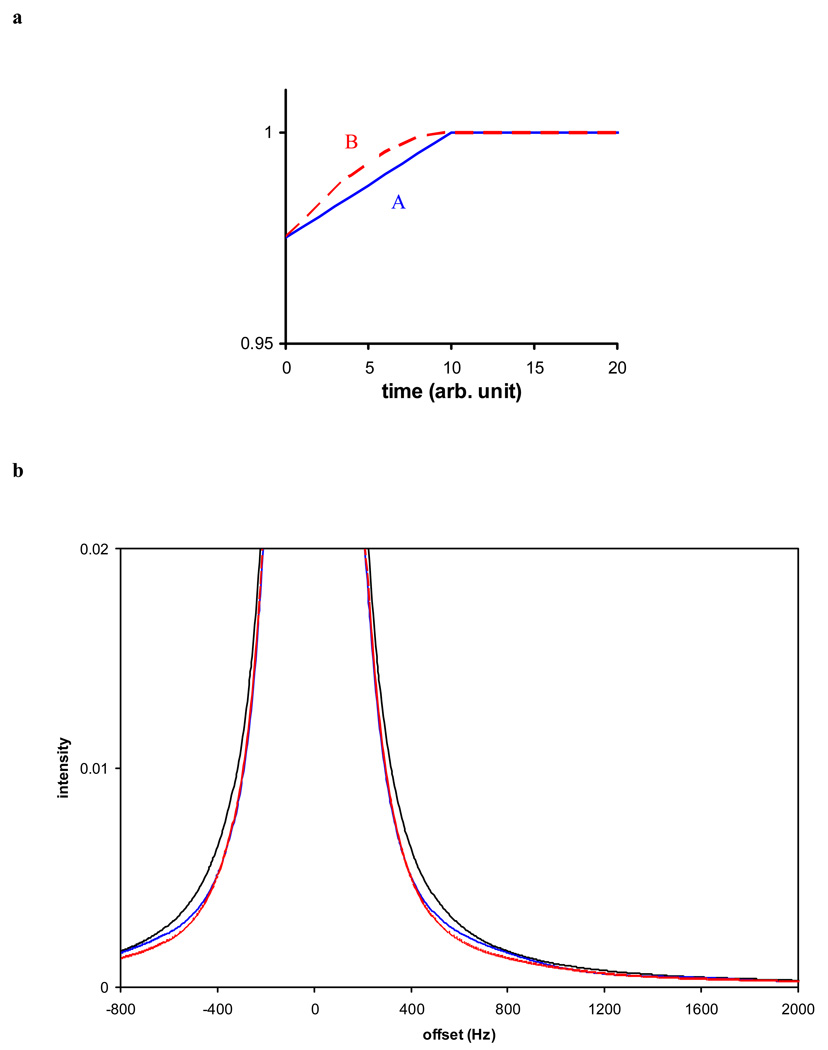
To start with, we consider the observation of water signal from a biological sample that has a proton spin-spin relaxation time (T2) of 5 ms. A typical set of acquisition parameters can be assumed as 256 ms for the acquisition time and 8000 Hz for the sweep width. We further assume that receiver gain compression occurs only for the first 10 FID data points: a scaling factor of 0.975 is applied to the first point and then linearly increased to 1 for the 11th point and thereafter. We call this window function A (Fig 3a blue line). Alternatively, a slightly different window function B can be constructed with a sine function smoothing (Fig 3a red line).
Figure 3.
The effect of receiver gain compression is equivalent of that of a window function. a) two window functions are used for simulating the impact of subtle gain compression: window function A (blue line) or B (blue line) reduces the first 10 FID data by up to 2.5% by a linear or sinusoidal function. b) While neither window function causes large resonance line-shape distortions for a strong signal (T2 = 5 ms due to radiation damping), close examination near the base of the resonance peak reveals that a “line-narrowing” effect can be observed (black line: no window function; blue line: window function A; red line: window function B).
The hypothetical FID from water, with window function A or B or without, can be Fourier transformed. The resonance peak height remains about the same regardless of the particular window function (data not shown). The resonance integration, on the other hand, is reduced by 2.5%, since the first FID data point is scaled down by 2.5% by either window function. Hence small receiver gain compression in the above simple form (either window function A or B) will result in reductions in peak integral. Conversely, if the resonance integral in frequency domain is less than expected and strong FID is observed, then one should check if there is some small gain compression.
For a compound that has not been quantitized, the expected NMR signal amplitude is not established to reveal if the observed is attenuated or not. It would be difficult to draw conclusions for receiver gain compression based on resonance integral alone. Therefore, it is helpful to identify non-amplitude spectral features for gain compression diagnosis.
The resonance line-shape is an NMR observable that is generally independent of the resonance integration in the frequency domain. Instead, it is influenced by the spin-spin relaxation rate, magnetic and RF homogeneity as well as the window function. For two acquisitions that differ only in output FID signal amplitude (or receiver gain parameter), the observed line-shape essentially reflects the apparent difference in window functions. Close scrutiny of the line-shape could reveal the presence of receiver gain compression. For accurate quantitations, we wish to diagnose gain compression as small as 2%.
Since most NMR resonance line-shapes are Lorentzian, the full line-width at half maximum (FWHM) parameter has been conveniently utilized to characterize line-shape change. For a proton FWHM that ranges from 1 Hz to 50 Hz, one would expect the change is likely to be very small (<1 Hz) if gain compression is only about 2%. Because the spectral resolution in most data acquisitions is typically about 1 Hz, such a small change may not be reliably observed in routine NMR. As such, a cursory survey of the FWHM probably will not reveal if a small receiver gain compression occurs.
However, the line-width near the base of the resonance signal (2% of the peak height) can be 10 times larger than FWHM. As long as sensitivity is sufficient, it is possible to observe a significant change in line-with at this level due to gain compression. Fig 3b shows that the “line-narrowing” effects by window functions in Fig 3a can be potentially observed for a strong water resonance. Near the 2% level of the maximum peak height, the line-width can be reduced by 10 Hz or more due to receiver gain compression. The line-narrowing effects are expected to be more significant if the gain compression becomes more severe.
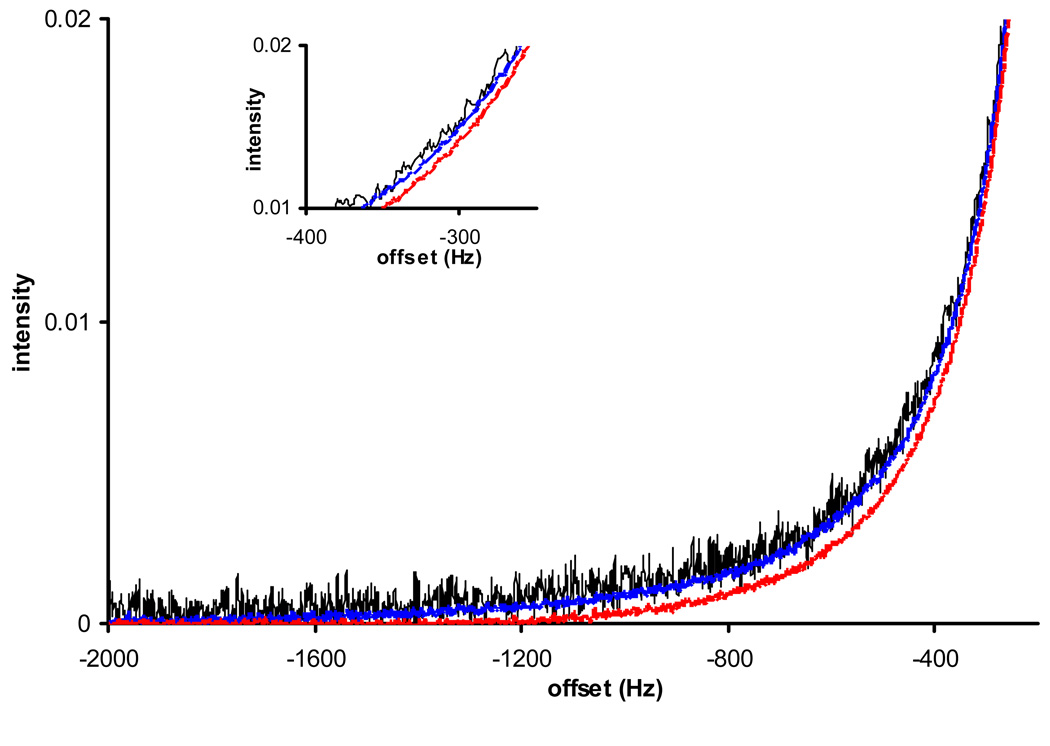
Fig 4 demonstrates that such line-shape changes do correlate with experimentally observed gain compression. In this figure, three representative spectra from Fig 2 are plotted near the baseline level (only one side of the resonance plotted as the other side would have similar behavior). The maximal FID data point in each set of data reaches 11%, 55% and 65% of the maximum output. From Fig 2, it is expected that the receiver is linear for any spectrum up to the 55% level, as the output is linearly proportional to the input (to an accuracy of 1%), and the spectral line-shape remains exactly the same (thin black and thick blue lines). As slight gain compression occurs (leading to about 4% reduction in peak integration, for spectrum #6 in Fig 2) when the FID reaches 65% of the maximum output level, not only the peak is under-integrated, but also a line-narrowing effect of about 15 Hz near the 2% peak height can be observed (Fig 4 thick red line). Hence an NMR spectroscopist should be aware of the possibility of receiver gain compression even well below the maximum FID output. In our own experience, for a Bruker high resolution spectrometer, it is recommended that the maximal observed FID should not exceed 50% of the maximum output (absolute reading of about 200000) allowed by the receiver during any single scan.
Figure 4.
The subtle line-shape change due to slight receiver gain compression can be observed for spectra in Figure 2 that were acquired at different receiver output levels. Due to the spectral symmetry, only one side of the peak is shown with an extended baseline. The inset indicates that at the 2% peak height, the thin black line (11% of max output) is almost indistinguishable from the blue line (55%), while the red line (65%) shows about 15Hz line-width narrowing.
Therefore, we can diagnose NMR receiver gain compression through resonance integration and line-shape-analysis. First, the observed FID can be reduced by a certain amount through the receiver gain parameter or excitation angle change and the resulting NMR resonance signal is observed. If there is no gain compression for the stronger FID, then the observed resonance integration will scale down accordingly, and the line-width at about 2% peak height or lower remain exactly the same. If there is gain compression, the peak integral for the stronger FID will appear to be reduced after normalized by the actual receiver gain and / or excitation angle, and the actual receiver gain can be found through its calibration against the receiver gain parameter [10]. Second, line-narrowing effects, corresponding to several percent of the line-width, can be observed in the frequency domain. Near the base of the resonance (such as 2% of the peak height) where the line-width is significantly larger than FWHM, such a line-narrowing effect can be easily observed, especially for a strong signal with sufficient sensitivity. Of course, potential interference due to RF inhomogeneity or radiation damping should be avoided by applying small excitation angles. While we will demonstrate elsewhere how to indentify whether the observed resonance under-integration or line-narrowing is caused by gain compression, RF inhomogeneity or radiation damping for a strong signal, suffice it to say here that the detrimental effects caused by any of the above sources should be avoided or carefully controlled in good NMR practice, especially when the affected signal is used for quantitative analysis.
CONCLUSIONS
We have demonstrated that the NMR receiver should and can perform within its linear range so that the observed spectrum is not distorted in resonance line-shape or integration. Hence definition of the receiver gain function is meaningful [10]. Subtle receiver gain compression can cause resonance under-integration for quantitative analysis. While other spectral artifacts may not be clearly visible, a subtle line-narrowing effect near the base of a strong peak can be observed. As such, we can manipulate the FID output signal by variation in the excitation pulse angle or receiver gain parameter so that we can carefully analyze expected peak integration and line-shape to identify any potential gain compression.
ACKNOWLEDGMENT
Partial support to D.R. from the National Institutes of Health (1R01GM085291-01) is gratefully acknowledged.
REFERENCES
- 1.Ernst RR, Bodenhausen G, Wokaun A. Principles of nuclear magnetic resonance in one and two dimensions. Oxford: Oxford University Press; 1987. [Google Scholar]
- 2.Connell MA, Davis AL, Kenwright AM, Morris GA. Anal. Bioanal. Chem. 2004;378:1568–1573. doi: 10.1007/s00216-003-2387-y. [DOI] [PubMed] [Google Scholar]
- 3.Mo H, Raftery D. Anal. Chem. 2008;80:9835–9839. doi: 10.1021/ac801938j. [DOI] [PMC free article] [PubMed] [Google Scholar]
- 4.Pierens GK, Carroll AR, Davis RA, Palframan ME, Quinn RJ. J. Nat. Prod. 2008;71:810–813. doi: 10.1021/np8000046. [DOI] [PubMed] [Google Scholar]
- 5.Akoka S, Barantin L, Trierweiler M. Anal. Chem. 1999;71:2554–2557. doi: 10.1021/ac981422i. [DOI] [PubMed] [Google Scholar]
- 6.Beckonert O, Keun HC, Ebbels TMD, Bundy J, Holmes E, Lindon JC, Nicholson JK. Nat. Protoc. 2007;2:2692–2703. doi: 10.1038/nprot.2007.376. [DOI] [PubMed] [Google Scholar]
- 7.Mao X-A, Guo J-X. Phys. Rev. B. 1994;49:15702–15711. doi: 10.1103/physrevb.49.15702. [DOI] [PubMed] [Google Scholar]
- 8.Dalisay DS, Molinski TF. J. Nat. Prod. 2009;72:739–744. doi: 10.1021/np900009b. [DOI] [PMC free article] [PubMed] [Google Scholar]
- 9.Hoult DI. Prog. NMR spectroscopy. 1978;12:41–77. [Google Scholar]
- 10.Mo H, Harwood JS, Raftery D. Magn. Reson. Chem. 2010;48:235–238. doi: 10.1002/mrc.2563. [DOI] [PMC free article] [PubMed] [Google Scholar]
- 11.Mo H, Harwood J, Zhang S, Xue Y, Santini R, Raftery D. J. Magn. Reson. 2009;200:239–244. doi: 10.1016/j.jmr.2009.07.004. [DOI] [PMC free article] [PubMed] [Google Scholar]


