Abstract
We recently developed an inorganic shell approach for suppressing blinking in nanocrystal quantum dots (NQDs) that has the potential to dramatically improve the utility of these fluorophores for single-NQD tracking of individual molecules in cell biology. Here, we consider in detail the effect of shell thickness and composition on blinking suppression, focusing on the CdSe/CdS core/shell system. We also discuss the blinking mechanism as understood through profoundly altered blinking statistics. We clarify the dependence of blinking behavior and photostability on shell thickness, as well as on interrogation times. We show that, while the thickest-shell systems afford the greatest advantages in terms of enhanced optical properties, thinner-shell NQDs may be adequate for certain applications requiring relatively shorter interrogation times. Shell thickness also determines the sensitivity of the NQD optical properties to aqueous-phase transfer, a critical step in rendering NQDs compatible with bioimaging applications. Lastly, we provide a proof-of-concept demonstration of the utility of these unique NQDs for fluorescent particle tracking.
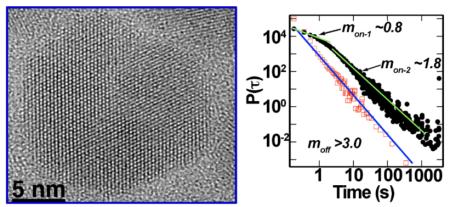 High-resolution image of an ultra-thick-shell ‘giant’ nanocrystal quantum dot (left). Suppressed blinking behaviour afforded by this class of semiconductor nanocrystal yields new statistical relationships in the probability densities of fluorescence on- and off-time distributions (right).
Keywords: Nanocrystalline materials, quantum dots, fluorescence, giant nanocrystal quantum dot, CdSe/CdS, blinking suppression, single particle tracking, bioimaging and microscopy, advanced optical microscopy, advanced spectroscopy
1. Introduction
In many respects, semiconductor nanocrystal quantum dots (NQDs) are near-ideal light emitters for applications as fluorescent molecular probes and in advanced bioimaging. Their optically excited emission is efficient (quantum efficiencies can approach unity), narrow-band, and NQD-size-tunable, i.e., light-output colors are precisely tunable from the ultraviolet through the visible and into the infrared depending on NQD composition and size. Absorption is quasi-broadband, making excitation facile and allowing for the possibility of using a single excitation source to excite multiple NQDs for a range of emission colors (e.g., for optical barcoding [1]). Furthermore, NQDs are synthesized using solution-phase approaches that render NQDs with “molecule-like” properties, including solubility and chemical manipulability. Despite these enabling characteristics, conventional NQD optical properties are sensitive to NQD surface chemistry and chemical environment, which has three important results: (1) high “as-prepared” NQD photoluminescence quantum yields are often not maintained when nonpolar-soluble NQDs are transferred into water, (2) NQDs “bleach” (emission intensity degrades over time, though significantly less readily than organic fluorophores), and (3) NQDs at the single-particle level “blink” (exhibit fluorescence intermittency), all limiting total NQD “brightness.” Importantly, NQD blinking affords difficulties in using conventional NQDs for single-particle/single-molecule tracking applications.
We recently reported that these key NQD optical properties—quantum yield, photobleaching and blinking—can be rendered independent of NQD surface chemistry and chemical environment, with photobleaching and blinking significantly suppressed, by growth of a very thick, defect-free inorganic shell.[2-4] Importantly, this ability to suppress blinking has been specifically recognized as a key advance in the application of NQDs as probes for biologically relevant single-molecule tracking studies.[5,6] To achieve this advance, starting with 3-4 nm CdSe NQD cores, we grew the particles to a size of ~10-20 nm by sequentially applying monolayers of inorganic shells. The shell monolayers—typically CdS, but in one case CdxZnyS alloys followed by ZnS (for enhanced relevance to biological imaging applications, separating the Cd-containing region from the surface environment)—were grown onto CdSe cores using modified literature procedures based on a successive ion layer absorption and reaction (SILAR) method. Effectively, we isolated the wavefunction of the NQD core from its surface, creating a colloidal NQD that is structurally more akin to physically grown epitaxial QDs. We named this new functional class of NQD the “giant” NQD (g-NQD). Notably, our prior analyses showed that g-NQDs do not photobleach over long observation times and are characterized by significantly suppressed blinking. Here, we detail the effect of shell thickness on blinking behavior and provide an in-depth analysis of blinking statistics. We also provide a biologically relevant demonstration of the new utility afforded by largely non-blinking and robust NQD fluorophores.
2. Experimental
2.1 General synthesis approach
Recently, core/shell growth techniques have been refined to allow for precise control over shell thickness and shell monolayer additions. Specifically, a technique developed originally for the deposition of thin-films onto solid substrates—known as successive ion layer adsorption and reaction (SILAR)—was adapted for NQD shell growth.[7,8] By this method, homogenous nucleation of the shell composition is largely avoided and higher shell-growth temperatures are tolerated because the cationic and anionic species do not coexist in the growth solution. This method has allowed for growth of thick shells, comprising many shell monolayers, without loss of NQD size monodispersity and with superior shell crystalline quality. Originally demonstrated for a single-composition shell (CdS over CdSe) up to five monolayers thick,[8,9] the approach has been extended to multishell architectures,[10] and now to thick (~7-9 shell monolayers)[11,12] and ‘ultra-thick’ shell systems (>10 monolayers).[2,3] The resulting nanocrystals are highly crystalline, uniform in shape, and electronically well passivated.[2,3,8-12]
The specific synthetic methods followed for the preparation and characterization of ‘giant’ (CdSe)CdS and (CdSe)alloyed-shell NQDs with suppressed blinking and remarkably enhanced stability are as follows:
Synthesis of CdSe-based giant-shell NQDs
Materials
Cadmium oxide, oleic acid (90%), 1-octadecene (ODE, 90%), dioctylamine (95%), octade-cylamine, zinc oxide, sulfur, selenium pellet (≥99.999%), trioctyl-phosphine (TOP), mercaptosuccinic acid, and tetramethylammonium hydroxide were purchased from Aldrich and used without further purification. Trioctylphosphine oxide (TOPO) (90%) was purchased from Strem and used without further purification.
The synthesis of giant CdSe/multishell NQDs was based on a SILAR approach with modifications.[8,10] The CdSe core was prepared by injection of 1 mL 1.5 M Se-TOP solution into a hot solution containing 1.5 g octadecylamine, 0.5 g TOPO, 5 g octadecene, and 0.2 mmol Cd-oleate under standard air-free condition. After injection of Se-TOP at 290 °C, the temperature was set at 250 °C for CdSe NQD growth. After ten minutes, the solution was cooled down to room temperature, and CdSe NQDs were collected by precipitation with acetone and centrifugation. CdSe core NQDs were re-dispersed in hexane and their concentration determined from their optical density.[13]
1.5×10⁻⁷ mol CdSe core NQDs in hexane were put into a 100 mL flask with 3 g ODE and 3 g diooctylamine. 0.2 M elemental sulfur dissolved in ODE, 0.2 M Cd-oleate in ODE and 0.2 M ZnxCd1-x-oleate (x = 0.13, 0.49, 0.78, respectively) were used as precursors for shell growth. The quantity of precursors for each monolayer of shell was calculated according to the volume increment of each monolayer shell, considering the changing total NQD size with each successive monolayer grown. The reaction temperature was set at 240 °C. Growth times were 1 h for sulfur and 3 h for the cation precursors.
CdSe g-NQDs were transferred into water by stirring purified NQDs (~5×10⁻⁹ mol) in hexane with 1 mmol mercaptosuccinic acid in 5 mL deionized water overnight. Mercaptosuccinic acid was neutralized by tetramethyl-ammonium hydroxide in water. The pH of the water was ~7. Mercaptosuccinic acid-capped g-NQDs were collected by centrifugation, and were then re-dispersed in a small amount of water and precipitated again using an excess of methanol to remove excess mercaptosuccinic acid. Finally, the purified mercatosuccinic acid-capped g-NQDs were dispersed in deionized water to form optically clear solutions.
2.2 Ensemble and single-NQD characterization
Ensemble NQD absorption and emission spectra were recorded on a CARY UV-VIS-NIR spectrophotometer and a NanoLog fluorometer, respectively. Quantum yields (QYs) for the g-NQDs and the various NQD control samples in hexane were measured by comparing the NQD emission with that of an organic dye (Rhodamine 590 in methanol). The excitation wavelength was 505 nm and emission was recorded from 520 nm to 750 nm. The QY of Rhodamine 590 was taken to be 95%, and those for the NQD samples were calculated by comparing the emission peak areas of the NQDs with the known dye solution.[14] Specifically, the NQD QYs were calculated using the formula:
| (1) |
| (2) |
| (3) |
The absorbance of the dye and the CdSe NQD solutions were controlled between 0.01 and 0.05 optical density. The absorbance and emission for each sample were measured at least twice at no less than two different concentrations.
For blinking studies, freshly diluted (~0.1-50 pM) g-NQDs in either HPLC-grade toluene or deionized water were dispersed onto a clean quartz slide. “Slow” blinking data (temporal resolution ~200 ms = 100 ms integration time + 100 ms readout time) were obtained using a standard wide-field micro-photoluminescence (micro-PL) experiment, where the data set was collected over an area of 40 × 40 μm from multiple NQDs simultaneously. The excitation source was the 532 nm, 180 mW cw laser focused to ~50 μm diameter spot, and emission was monitored using a liquid-nitrogen-cooled charged-coupled device (CCD).
Importantly, for all analyses here, we set the “on/off” threshold of the NQDs at 10 counts above the readout noise level of the CCD detector. We note that this level is arbitrarily defined based on the signal level of the CCD detector and does not correspond to the real “off level.” In fact, our recent studies using a more sensitive time-correlated single-photon system have shown that more than 80% the g-NQDs with shell thickness >12 monolayers—although exhibiting wide fluctuations in PL emission intensity—never turn into a completely off-state, even at faster time scales of 10 ms (Supporting Information Figure S1). Thus, the “off-levels” of the CCD study described here likely correspond, instead, to a weaker emitting state in the case of very-thick-shell g-NQDs (>12 monolayers), rendering our analyses highly conservative in our estimates of “non-blinking” g-NQD fractions.
2.3 Correlated single-NQD atomic-force microscopy (AFM) and photoluminescence (PL) study
A dilute solution of NQDs was drop-cast onto a clean coverslip, and the solvent was allowed to evaporate. The sample coverslip was mounted on the stage of an inverted optical microscope (Olympus IX71) equipped with a piezoelectric scanner (Physik Instrumente P773.3CD XYZ) used to raster scan the sample for photoluminescence imaging. Excitation was provided by a 440-nm pulsed diode laser (PicoQuant LDH-P-C 440) operating at a pulse repetition rate of 40 MHz and pulse width of ~100 picoseonds. The average power over the observation area (10 μm × 10 μm) was 1 μW. Emitted fluorescence was collected by the same microscope objective and directed onto a single-photon counting avalanche photodiode detector (APD) (Perkin Elmer SPCM-14AQR). The emission was spatially filtered using a 75 micron diameter pinhole located in the image plane of the microscope and spectrally filtered using a bandpass filter centered at 605 nm before reaching the detector. The output of the APD was directed to a time-correlated single-photon counting module (PicoQuant PicoHarp 300) that controlled the piezoelectric stage and recorded the time-correlated single-photon data. The photon data was processed using vendor-supplied software (Picoquant Symphotime) to generate the photoluminescence images. An atomic force microscope (Veeco Instruments Bioscope SZ), mounted on the stage of the inverted optical microscope, was used to record nanometer scale topography images of the g-NQDs. The images were recorded using silicon nanoprobes (Veeco RTESP) operated in tapping mode at a resonance frequency of approximately 300 kHz. Registration of the AFM height image with the photoluminescence image was accomplished by aligning the AFM tip at the center of its scan range with the optical probe region. This was done by monitoring the excitation laser light scattered from the tip using a second APD.
3. Results and discussion
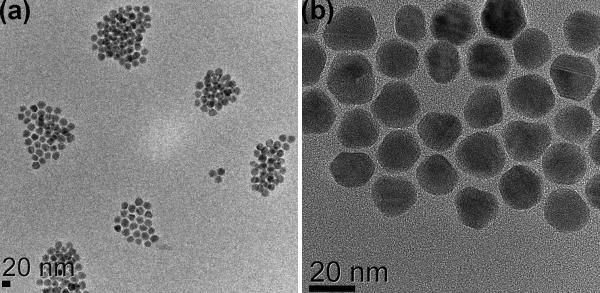
Thick-shell (7-11 CdS shell monolayers) and ultra-thick-shell (≥12 CdS shell monolayers) CdSe/CdS core/shell NQDs were synthesized by the SILAR method (Experimental section). This method allowed relatively facile control over NQD size and size distribution even for the ultra-thick systems (Figure 1), although the approach was sometimes found to lead to bimodal size distributions for the thickest shells (see Discussion below). Quantum yields (QYs) in emission were typically 40-60% for core/shell systems comprising from 4-16 CdS monolayers. QYs typically dropped to 20-30% for the thickest-shell g-NQDs (>17CdS monolayers), possibly correlated with the tendency toward a non-ideal bimodal distribution of particles and/or the introduction of defects within the shell structure.
Figure 1.
Lower (a) and higher (b) resolution transmission electron microscopy (TEM) images for CdSe/16CdS g-NQDs.
Blinking as a function of shell thickness for different on-time fractions and shell composition
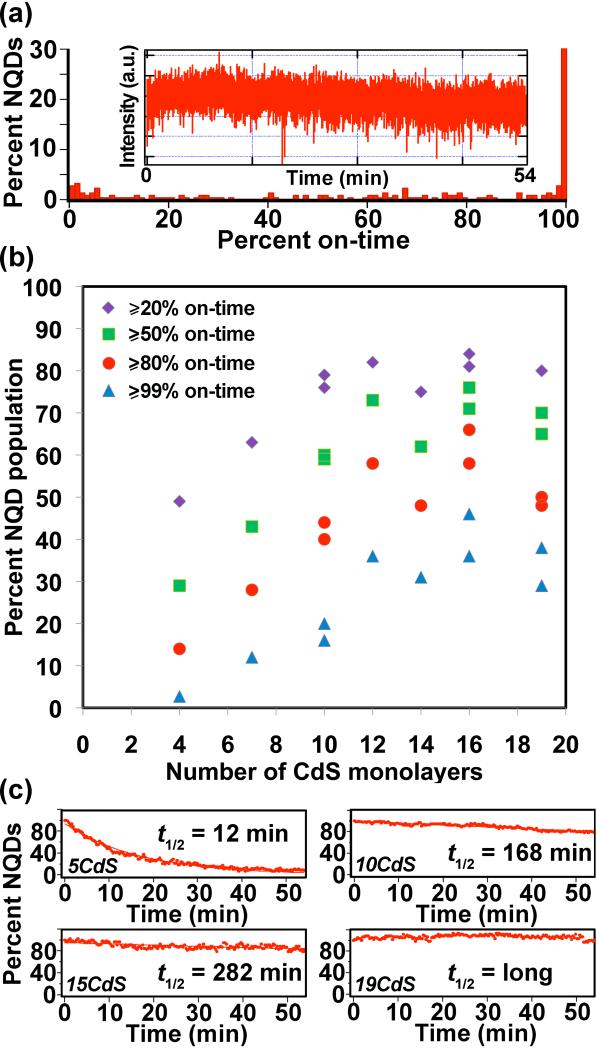
Our approach for assessing the blinking behavior of CdSe/CdS core/shell NQDs is presented in Figure 2a. (Note: we previously confirmed the single-particle nature of our samples [2] and provide additional verification here in Supporting Information.) From such data, we determined the percentages of the total NQD populations that exhibited ‘on-times’ of ≥20, 50, 80 or 99%, respectively (Figure 2b). In this case, %-on-times represent fractions of the total observation time of 54 minutes (18,000 collected frames). In other words, to be considered as having been ‘on’ for ≥50% of the observation time, a g-NQD would have to have been in a bright or ‘on’ state for at least 27 minutes (non-continuously). NQDs that were on for ≥99% of the observation time were considered to be “non-blinking,” while those that attained an overall on-time of ≥80% were viewed as “largely non-blinking” for the nearly one hour of interrogation by laser excitation. As evident in Figure 2, half or more of a population of the thickest-shell g-NQDs (≥12 monolayers of CdS), were either largely or essentially completely non-blinking. We emphasize this point due to the extraordinarily long observation time – the robustness of these ultra-thick g-NQDs to blinking withstands significantly extended interrogation times.
Figure 2.
Single-NQD photoluminescence studies. (a) On-time histogram of a CdSe/19CdS g-NQD population constructed from analysis of typically >100 individual g-NQDs. An example fluorescence time trace (used to prepare a histogram) for an individual CdSe/19CdS g-NQD is shown in the inset to (a). Plot of ‘percent NQD population’ versus the number of CdS shell monolayers for different on-times (b). Two preparations/analyses are plotted for the 10-, 16-, and 19-shell systems, providing an indication of experimental variability in (b). Photobleaching behavior: plots of emitting NQD fractions over time are presented for CdSe/5CdS (top left), CdSe/10CdS (top right), CdSe/15CdS (bottom left), and CdSe/19CdS (bottom right) core/shell NQDs (c).
In contrast, CdSe/4CdS samples only occasionally contained even small non-blinking or largely non-blinking fractions. Furthermore, blinking analyses for these thinner-shell systems were more sensitive to sample preparation (e.g., differences in NQD surface chemistry or charging as influenced by varied sample cleaning or dilution protocol, as well as substrate chemistry), sample age, PL thresholding procedures (see Experimental), and experimental setup, where the first two strongly influence photobleaching behavior (see below discussion). The addition of at least 7 monolayers provided clear evidence of suppressed blinking, and further additions of up to 12 monolayers revealed continued advantages to further shell addition. With respect to simple blinking behavior alone, addition of shells beyond 12 would appear from this data to be superfluous. However, the thickest shells have been shown to provide additional advantages in terms of more substantially suppressed photobleaching [3] and suppressed nonradiative Auger recombination,[4] as well as the related, unprecedented multiexcitonic emission.[15] Thus, depending upon the application requirements, ‘thick’ vs. ‘ultra-thick’-shell systems offer distinct advantages.
With respect to photobleaching behavior, the thickest shell samples (≥16 CdS shell monolayers) were found not to photobleach even after several hours of interrogation repeated each of several days (Figure 2c). In contrast, CdSe/4CdS and CdSe/5CdS systems photobleached (complete absence of PL) with a t1/2 ≈ 5-15 min, comparable to commercial NQDs (Qdot®655ITK™).[2] Thick-shell g-NQDs from 10-12 monolayers of CdS photobleached with a t1/2 ≈ 1.5-3 h, while even thicker 15-shell systems displayed some degree of decay, resulting in t1/2 ≈ 5 h. Again, depending upon the application, simple multishell NQDs or thick or ultra-thick-shell systems will be preferred.
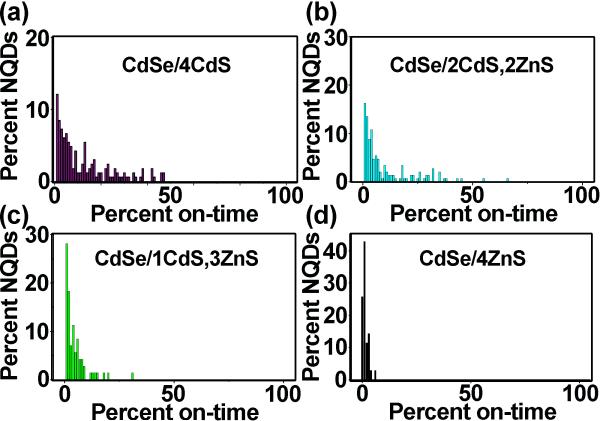
We reported previously that for biological imaging or other applications for which a ‘less toxic’ surface chemistry was desired, the outermost CdS monolayers could be replaced with non-heavy-metal-containing ZnS layers.[2] These mixed-ultrathick-shell systems, e.g., CdSe/11CdS/6CdZnS/2ZnS behaved similarly to their CdS-shell counterparts, with blinking behavior apparently mostly determined by the number of CdS layers. In other words, the CdSe/11CdS/6CdZnS/2ZnS system behaved like a CdSe/11CdS system.[3] To help better understand this effect of shell composition on blinking behavior, here, we directly compare CdS and ZnS in thinner-shell systems with respect to their tendencies toward blinking suppression (Figure 3). We observe that even the application of as few as four CdS shells results in a significant fraction of NQDs occupying an on-state for ≥20% of a long observation time (54-60 min) (Figure 3a), or even occasionally comprising a small non-blinking fraction (Figure 2b). A 4-shell system containing 2CdS and 2ZnS monolayers also showed similar results (Figure 3b), but further investigations of other 4-shell-monolayer systems—1CdS/3ZnS and 4ZnS—revealed that shell thickness alone was not the determining factor in controlling blinking behavior. Rather, the replacement of CdS monolayers with ZnS monolayers was found to be critical in this regard, with increasingly reduced ontime fractions resulting in the case of majority or exclusively ZnS shell systems (Figure 4c-d). The poor performance of ZnS shells in providing suppressed blinking in the case of CdSe-core NQDs may result from several factors, including (i) increased system strain for the more poorly lattice matched CdSe/ZnS pair (12.7% vs. 3.9% mismatch) and (ii) differences in core/shell conduction and valence energy-band offsets. The former (i) may result in the increased presence of trap states and related photo-induced charging events, where charging is related to the ‘off’ (dark) events in blinking.[16] The latter (ii) implies differences in electron-hole separation for the two core/shell systems.[17] In the case of CdSe/CdS core/shell NQDs, the hole is largely confined to the core, while the electronic wavefunction is able to leak into the shell. In contrast, the electron and the hole are more-or-less equally well confined to the core in the case of CdSe/ZnS. Irrespective of the mechanism, the utility of CdS shells for blinking suppression in the CdSe/CdS system is indicated in the blinking data as early as 4 shells, allowing these thinner-shell systems to serve as ‘predictors’ of thick-shell behavior.
Figure 3.
On-time histograms for a series of 4-monolayer shell systems: CdSe/4CdS (a), CdSe/2CdS,2ZnS (b), CdSe/1CdS,3ZnS (c) and CdSe/4ZnS (d). ≥99%, ≥80%, ≥50%, and ≥20% on-time fractions for each system, respectively, are 0%, 0%, 0%, 22% (a), 0%, 0%, 1%, 18% (b), 0%, 0%, 0%, 2.8% (c), and 0%, 0%, 0%, 0% (d).
Decline in non-blinking population as a function of observation time
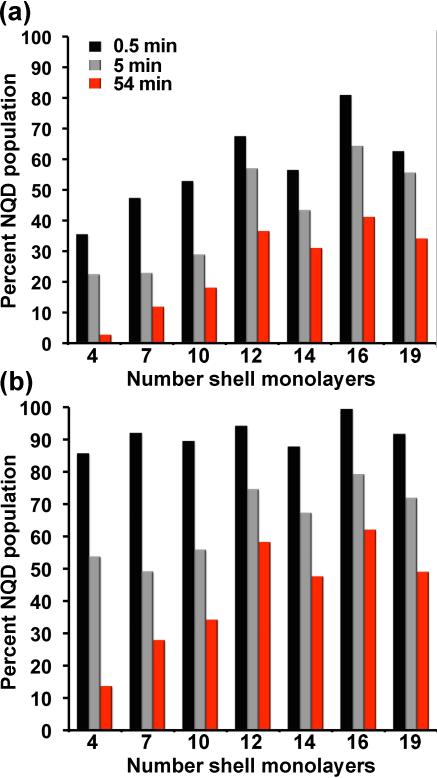
The non-blinking fractions as a function of shell thickness and observation time are plotted in Figure 4a. Thin, thick, and ultra-thick-shell samples are largely comparable at very short observation times. The fraction of the NQD population that is non-blinking over a period of 0.5 minute is approximately doubled for the thickest shell samples compared to their thinner-shell counterparts. However, after 54 minutes of observation time, the thickest-shell samples (≥12 monolayers of CdS) comprise ~10-15 times more non-blinking NQDs (in the ‘best-case’ scenario for the CdSe/4CdS system wherein the fraction of non-blinking NQDs is non-zero for the observation time of 54 minutes – compare Figure 2b with Supporting Information Figure 1). For limited observation times (e.g., ≤5 minutes), thinner shell systems may be acceptable,[11] depending upon the application, as the percentage of largely non-blinking NQDs (‘on’ ≥80% of the observation time) is ~50% (Figure 4b). In the case of the thickest shell systems, the decrease in the fractions of non-blinking and largely non-blinking NQDs as a function of time is understood in terms of the ‘intrinsic’ non-blinking population for the specific times, i.e., the actual fraction of NQDs that can sustain an ‘on’ state for the observation period. In contrast, in the case of the thinner-shell systems, photobleaching contributes significantly to the poorer statistics at longer observation times. In other words, as a result of photobleaching (non-reversible transition to an ‘off’ state), a substantial fraction of the NQDs that contributed to an initial, relatively large on-time percentage is eliminated from the population of NQDs that are emitting (either blinking or non-blinking). In this way, the thinner-shell NQDs show the largest changes in on-time fractions over time (Figure 4).
Figure 4.
Comparison of percent-NQD population versus shell thickness as a function of the total observation time (0.5, 5, and 54 minutes) for NQDs ‘on’ ≥99% of the observation time (‘non-blinking’ population) (a) and ≥80% of the observation time (‘largely non-blinking’ population) (b).
Ability to tolerate ligand exchange procedures as a function of shell thickness
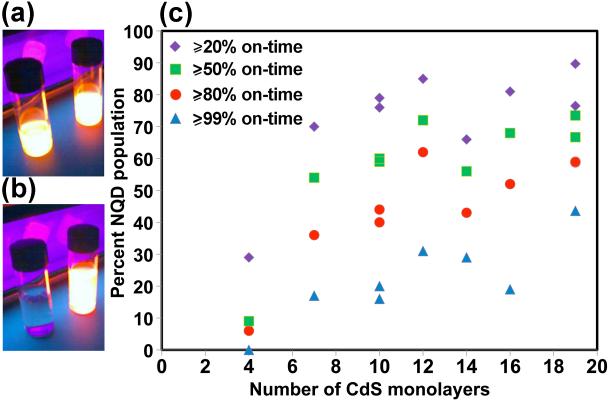
The photoluminescence efficiency (i.e., the QY in emission) of thinner shell, multi-shell NQDs is known to be susceptible to losses when the initial, protective ligand monolayer is compromised. As-prepared, colloidal NQDs comprise the semiconductor nanocrystal and a layer of organic ligands that datively couple to the nanocrystal and render the NQD soluble in nonpolar solvents. These ligands help to passivate so-called surface ‘dangling bonds’ that otherwise serve as ‘trap states’ that provide non-radiative or inefficient, non-band-edge electron-hole recombination pathways. It is commonly observed that partial or complete removal and/or replacement of the as-prepared ligands reduces the effectiveness of the ligand layer to serve this purpose, with lower QYs the result.[18] Ligand exchange is a common method for rendering nonpolar NQDs water soluble, whereby the alkyl-terminated ligands are replaced with polar-group and/or charge-terminated ligands. As non-blinking behavior in NQD fluorophores is of particular interest for bioimaging and biomolecular tracking applications, we compared photoluminescence and blinking behavior for as-prepared and ligand-exchanged core/shell NQDs as a function of shell thickness.
The ensemble photoluminescence showed a clear difference between CdSe/4CdS and CdSe/12CdS when the nonaqueous and the aqueous solutions of each were compared (Figure 5a). This dramatic result is consistent with our previous observation that the thinner shell systems are more susceptible to PL decline in response to simple NQD ‘washing’ procedures (i.e., removal of excess ligand) compared to the thicker shell systems.[2] Interestingly, blinking behavior was not dramatically affected, even in the case of the thinner shell systems (Figure 5b). This apparently unexpected result may have several explanations. First, the 4-shell system that showed nearly compete PL suppression, but on-time fractions comparable to many of our nonpolar 4-shell system analyses, likely comprised a high fraction of non-emitting or rapidly photobleached NQDs. These NQDs would contribute to low ensemble QYs and emission but would not be ‘on’ long enough (at least 180 ms, the temporal resolution of our blinking experiment) to be counted in the blinking statistics. The relatively fewer, ‘active’ 4-shell NQDs could possess similar stability to blinking and photobleaching to their nonpolar counter-parts and would dominate the single-NQD measurements. Second, it is known that the effects of ligand exchange with small-molecule reducing agents, as used here (i.e., mercaptosuccinic acid), are strongly ligand concentration, time, and process dependent,[18] with fortuitous exchanges even possibly resulting in blinking suppression.[19]
Figure 5.
CdSe/4CdS (left) and CdSe/16CdS (right) NQDs photoluminescing under UV lamp excitation in hexane solvent (a) and in water (b). Plot of ‘percent NQD population’ versus the number of CdS shell monolayers for different on-times for mercaptosuccinic acid capped NQDs in water (c).
Correlated AFM-PL
Recent work has demonstrated the benefit of “ultra-thick” shells (≥12 monolayers) for realizing significantly suppressed nonradiative recombination processes that otherwise prevent conversion of charged and multiexcitonic states into usable photons by way of efficient nonradiative Auger recombination.[4,15] Unfortunately, to date, we have observed that complications during shell growth (including incomplete particle solubility as more and more shells are added, especially beyond 12 CdS monolayers) can result in product inhomogeneity. When present, the various sub-populations likely comprise the desired core/shell materials, as well as shell-only particles and core/shell materials with untargeted shell thicknesses and/or defective shells. We used correlated AFM-PL measurements to determine the relationship between g-NQD size and the ability to emit light under laser excitation. We further used the approach to assess our ability to separate “dark” NQDs from emitting NQDs by way of size-selective precipitation.
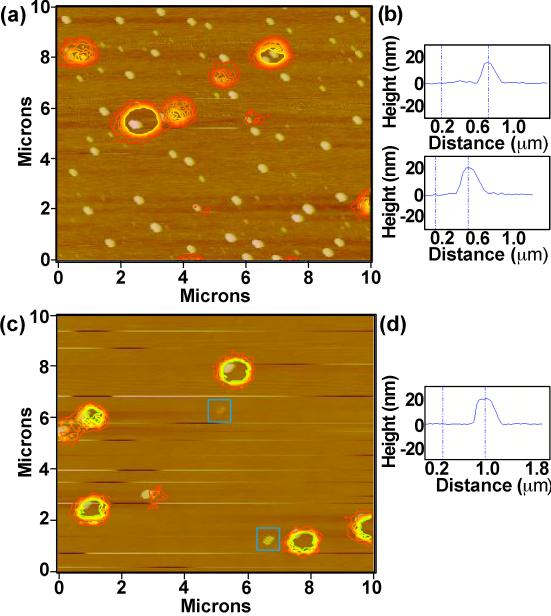
Based on transmission electron microscopy (TEM) measurements (Supporting Information Figure S2), we suspected a CdSe/19CdS sample of comprising particles that were highly dispersed in size. Correlated AFM/PL studies allowed us to confirm the bimodal size distribution of this sample, as well as to assess the relationship between NQD size and the ability to photoluminesce. In Figure 6 we show the correlated AFM-PL image for the suspect CdSe/19CdS sample. Similar to TEM data, g-NQD heights were found to be bimodal, with ~60% of the NQDs being large (≥20 nm) and ~40% being smaller (≤10 nm). All of the smaller g-NQDs were observed to be non-emitting (36 NQDs: 8.3 ± 3.0 nm), while many of the large g-NQDs were also dark (42 NQDs: 23.6 ± 3.2 nm). The 10% of the batch that was found to be emitting was all ‘large,’ but, interestingly, overall smaller in size (9 NQDs: 19.9 ± 3.7 nm) compared to the ‘non-emitting large’ NQDs.
Figure 6.
Correlated AFM/photoluminescence images for ‘crude’ (a) and size-selected (c) CdSe/19CdS core/shell g-NQDs. NQD heights were determined by difference between the NQD and background heights, with examples shown for the crude (b) and size-selected (d) samples. Two examples of the remaining ‘dark’, small-NQD fraction in the size-selected sample are outlined in (c) (blue squares surrounding a 3 and an 11 nm NQD).
Using size-selective precipitation we were able to separate both populations of dark g-NQDs from the bright g-NQD fraction, as evident in subsequent correlated AFM-PL images (Figure 6b). After size-selection, >75% of the sample was found to be emitting (23 of 30 NQDs) and of similar size to the emitting fraction in the ‘crude’ sample (20.4 ± 1.7 nm), with most of the remaining dark g-NQDs being small (5 NQDs: 7.6 ± 4.4 nm). The observed ~20 nm size for the emitting fraction in this CdSe/19CdS system is consistent with that expected for an ‘ideal’ CdSe/19CdS NQD [3.8 nm diameter core + (19 shell monolayers × 0.35 nm × 2) + (2 ligand layers × ~1 nm) = 19.1 nm]. Thus, the bright-NQD fraction does appear to be closest in size to the desired CdSe/19CdS system. (We note, however, that without deliberate calibration of the AFM, a truly quantitative comparison is currently not possible.) The undesired distribution in sizes may result from several factors including nucleation of shell material to form CdS NQDs, as well as unequal addition of shell material onto existing core/shell particles. Either process could result in the observed small-NQD fraction. The latter process is perhaps expected in the case of a partially precipitated system, where the phase-heterogeneity compromises shell growth of the relatively less-well solvated particles. The dark, but very-large fraction may constitute particles that incorporated shells in a relatively less well controlled manner, resulting in defective or distorted shells (Supporting Information Figure S3). Significantly, the bimodal distribution is generally not observed for systems possessing <16 CdS monolayers (Figure 1). Modifications to the synthesis to improve the batch uniformity for the thickest shell systems are being investigated and will be reported elsewhere.
Novel blinking statistics as a function of shell thickness
As described in the Experimental section, our recent studies using a more sensitive time-correlated single-photon counting (TCSPC) system have indicated that more than 80% of our ultra-thick g-NQDs (shell thicknesses >12 CdS monolayers) never turn into a completely off-state, although exhibiting wide fluctuations in PL emission intensity (Supporting Information Figure S1). (It should be noted that our TCSPC system is capable of detecting off-intervals down to very fast 1 ms timescales, with 10-100 ms resolution shown in Figure S1 and 1 ms resolution demonstrated previously.[3]) Thus, we consider the “off-levels” of the CCD study described here to correspond, instead, to a weaker emitting state and the analyses to be highly conservative in our estimates of “non-blinking” g-NQD fractions. Nevertheless, we use this more traditional approach of on/off time-distribution analysis to study PL intensity fluctuation behavior of our g-NQDs, as it has been applied previously by others to study blinking in conventional NQD systems.
The probability density of on/off time distributions for conventional NQDs,
| (1) |
where Ni represents the number of events with on/off time τi, and the denominator is the average time duration between the closest preceding and following events,[20] exhibits the well known power-law behavior,
| (2) |
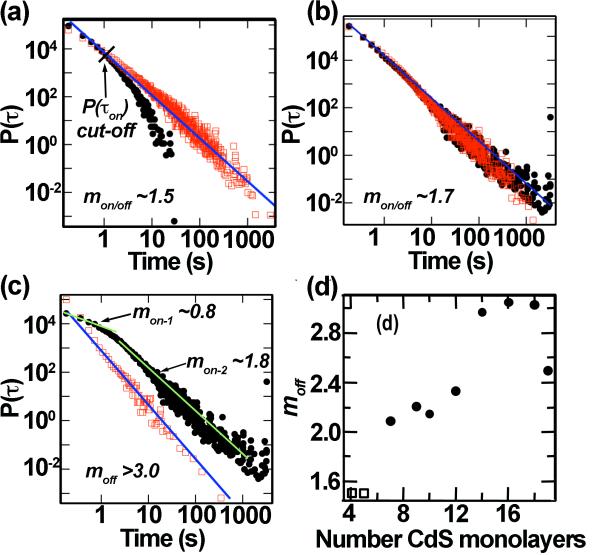
where mon/off is ~1.5 (Figure 7a).[21,22] We observed that CdSe/CdS NQDs with shell thicknesses <7 mono-layers showed power-law behavior with mon/off ~1.5, as well. Furthermore, initially, the ultra-thick-shell systems also appeared to follow this trend. This was the case when the entire ensemble was analyzed, although the mon/off was found to be slightly larger compared to conventional and thinner-shell systems – ~1.7 (Figure 7b). Significantly, however, the ultra-thick-shell systems revealed a unique trend in the P(τon). While conventional NQDs show a cut-off (departure) from the power-law decay behavior (Figure 7a), our g-NQD on-times do not cut-off and even exhibit a spreading of data points at long on-times (Figure 7b). This spreading of data points resulted from the sub-ensemble of g-NQDs characterized by strongly suppressed blinking.
Figure 7.
P(τon/off) of CdSe/4CdS NQDs showing typical power law behavior with m = 1.5. P(τon) exhibits cut-off resulting from the power-law behavior at on-times longer than 1s (a). P(τon/off) of the whole ensemble of CdSe/16CdS g-NQDs (b). P(τon/off) of the sub-ensemble of CdSe/16CdS g-NQDs that exhibits a total on-time fraction of 75% (c). [a-c: open squares = P(τon), solid circles = P(τoff)]. Plot of moff versus shell thickness (d), where open squares = the whole ensemble of CdSe/4CdS and CdSe/5CdS NQDs and solid circles = the sub-ensemble of g-NQDs with total on-time fractions >75%.
The blinking behavior of the sub-ensemble of g-NQDs with suppressed blinking was further analyzed, separate from that contributed by the blinking fraction. We achieved this by extracting and analyzing the P(τon/off) only for the sub-ensemble of the g-NQD population that had total on-time fractions greater than 75%. As an example, Figure 7c shows P(τon/off)‘suppressed-blinking fraction’ of the 16-shell system (also: Supp Information Fig. S4). The data show a dramatic deviation from the usual power-law behavior. The P(τon) can no longer be described by a simple power-law decay. Instead, it decays with two distinct exponents characterized by different time-scales (mon = 0.8 and mon = 1.8 for time <2.0 s and time >2.0 s, respectively). Furthermore, although P(τoff) still exhibits a power-law decay, the decay in P(τoff) becomes very rapid, with exponent m varying from 2.2 to 3.2 with increasing shell thickness (Figure 7d). Interestingly, the variation of m as a function of shell thickness mirrors the variation of the g-NQD population that exhibits on-time fractions of >99% (Figure 2b). This important result indicates that ‘m’ can be utilized as a criterion for understanding non-blinking behavior.
Furthermore, the dramatic increase in the value of m suggests that the mechanism responsible for the remaining blinking in g-NQD systems could be different from that of conventional NQDs. In conventional NQDs, very slow decay of P(τoff) with m<2 leads to the divergence of the statistical average,
| (3) |
with total experiment time texp. This observation led to the conclusion that the ionization/re-neutralization processes responsible for blinking [16,21] occur over (i) a distribution of tunneling distances between the NQD core and interface states or (ii) an exponential distribution in the depths of the trap states. In contrast, studies of blinking in InP self-assembled quantum dots (QDs) have revealed that, although the trapping of charges in the vicinity of the QD is responsible for the blinking process (similar to NQDs), the average τoff and the switching rate can be described by a thermal activation model involving a single activation barrier,[23] i.e., unlike the case for colloidal NQDs. The large m values (>3) that we observe for g-NQDs cause the convergence of <τoff> to a finite value for this unusual type of colloidal NQD (Supporting Information Figure S4). Thus, the blinking behavior of our g-NQDs appears to be more akin to the behavior observed for InP self-assembled QDs, as these, too, exhibit a finite <τoff>. Also, in contrast with the mechanism proposed for conventional colloidal NQDs, the finite <τoff> observed for the g-NQDs suggests a thermal activation model involving a single activation barrier. Thus, not only is blinking suppressed in the case of g-NQDs, but the blinking mechanism of any remaining blinking behavior appears distinctly altered compared to other colloidal NQDs and similar to self-assembled QDs.
Utility of ultra-thick-shell CdSe/CdS NQDs for 3-D particle tracking
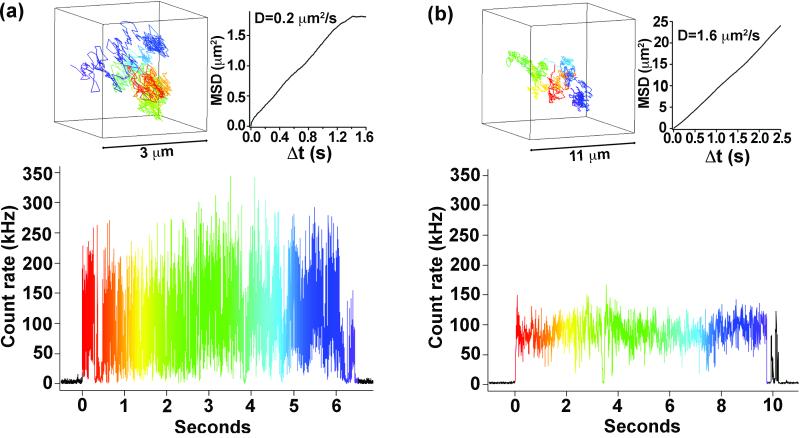
The ability to follow the trajectory of single molecules (e.g., proteins) as they perform their biological functions in vivo is an important goal for advanced bioimaging. To date, single-particle tracking has led to an improved understanding of bacteria motility,[24] membrane dynamics,[25-27] and motor proteins,[28] revealing details that are otherwise hidden in ensemble measurements. Members of our team have previously reported on a novel approach to three-dimensional (3-D) tracking of small, dim particles, such as a single protein tagged with a single fluorophore.[29] The geometry of this 3-D single-particle tracking instrument is a variation on that of a confocal microscope and involves tracking freely diffusing nanoparticles in three dimensions using four-point confocal detection and positional feedback. Its principle has been described in detail elsewhere.[29,30] Significantly, the approach uses a low illumination power that makes it ultimately compatible with live-cell investigation.[29] Here, we compare non-blinking g-NQDs (CdSe/19CdS) with conventional NQDs for their ability to be tracked over time and space in a biologically relevant medium (Figure 8). We find that the reduced blinking of the g-NQD fluorophores compared to that of conventional NQDs is a significant advantage for 3-D tracking. On average, we are able to track g-NQDs over much longer intervals than conventional NQDs. In the case of conventional NQDs, blinking limits our ability to track. In contrast, with g-NQDs, our ability to track is more typically limited by the range-of-travel of our sample stage (30×30×10 microns), i.e., the experimental limitation of our setup rather than any fundamental limit implied by the fluorophore.
Figure 8.
Fluorescence intensity trajectory from a conventional CdSe/ZnS core/shell NQD system [Invitrogen 605 ITK amino (PEG)] diffusing in 80/20 (v/v) glycerol-water (a)-bottom. Data are binned in 1 ms intervals. Three-dimensional trajectory of this nanoparticle recorded in 5 ms intervals is shown in (a)-top left. The dimensions of the cube containing the particle are 3×3×3 μm3. The rainbow color scheme is correlated with that used for the fluorescence intensity trajectory to show the time dependence. The mean-squared displacement (MSD) of the nanoparticle as a function of measurement time interval (Δt) is shown in (a)-top right. In the case of pure diffusive motion in three dimensions (as is the case here), MSD and Δt are linearly related with a slope of six times the diffusion coefficient (D). Fluorescence intensity trajectory for CdSe/19CdS g-NQDs diffusing in 60/40 (v/v) glycerol-water is shown in (b)-bottom. A g-NQD trajectory (cube dimensions: 11×11×11 μm3) and g-NQD MSD are shown in (b)-top left and top-right, respectively.
4. Conclusion
Shell thickness in the CdSe/CdS core/shell NQD system is clearly a key criterion to be used in controlling blinking behavior, improving NQD photostability, altering the blinking mechanism, and providing significantly enhanced utility for single-particle tracking applications, for example, in cell biology. Significantly, performance advantages were observed for ‘ultra-thick-shell’ variations, especially in the case of long interrogation times and non-ideal chemical environments. Shell composition was also found to be an important consideration in realizing the unusual blinking behaviors, where physical and or electronic-structure relationships between the core and the shell materials are likely controlling factors. Studies are underway, with some initial results already reported,[4] to better understand the underlying mechanism(s) for these remarkable properties and to extend the approach to other core/shell systems, and, ideally, to more ‘bio-compatible’ NQD compositions. To this end, we are investigating giant-shell systems based on InP and ZnSe.
Supplementary Material
Acknowledgements
This work was conducted in part in the Center for Integrated Nanotechnologies (CINT) jointly operated by Los Alamos and Sandia National Laboratories (LANL and SNL) for the U.S. Department of Energy (DOE). H.T. and J.A.H. acknowledge partial support by NIH-NIGMS Grant 1R01GM084702-01. J.V. acknowledges support by Los Alamos National Laboratory Directed Research and Development Funds.
Biography
 Jennifer Hollingsworth is a Technical Staff Member and a former Director’s Postdoctoral Fellow at Los Alamos National Laboratory. She received a B.A. (Phi Beta Kappa) in Chemistry from Grinnell College, Grinnell, Iowa. She obtained her Ph.D. in Materials Inorganic Chemistry from Washington University in St. Louis in 1999 as a NASA Research Fellow. She currently directs research efforts in the advancement of novel synthetic methods for functional semiconductor nanocrystal heterostructures, focusing on their applications as biomolecular probes and in energy-conversion materials.
 Javier Vela received a BSc from the National University of Mexico in 2001 and a PhD in chemistry from the University of Rochester in 2005. He was the recipient of the Hooker and Messersmith graduate fellowships in 2003-2004, and the ACS Inorganic Young Investigator Award in 2006. After postdoctoral work at the University of Chicago and at Los Alamos National Laboratory, he joined the faculty at Iowa State University in 2009. His research lies at the interface between nanotechnology and molecular chemistry and their applications in bio-imaging, renewable energy, and catalysis.
 Han Htoon is a Technical Staff Member and a former Director’s Postdoctoral Fellow at Los Alamos National Laboratory. He received a B.Sc. (Honors) and an M.S. in physics from University of Yangon, Yangon, Myanmar and Western Illinois University, Macomb, IL, respectively. He obtained his Ph.D. in physics from University of Texas at Austin in 2001. He currently directs research efforts in advanced optical characterization at the scale of individual nanostructures, making pioneering contributions in spectroscopic technique development and in fundamental photophysics of semiconductor nanocrysals.
References
- [1].Han M, Gao X, Su JZ, Nie S. Nat. Biotechnol. 2001;19:631. doi: 10.1038/90228. [DOI] [PubMed] [Google Scholar]
- [2].Chen Y, Vela J, Htoon H, Casson JL, Werder DJ, Bussian DA, Klimov VI, Hollingsworth JA. J. Am. Chem. Soc. 2008;130:5026. doi: 10.1021/ja711379k. [DOI] [PubMed] [Google Scholar]
- [3].Hollingsworth JA, Vela J, Chen Y, Htoon H, Klimov VI, Casson AR. Proc. SPIE Int. Soc. Opt. Eng. 2009;7189:718904. doi: 10.1117/12.809678. [DOI] [PMC free article] [PubMed] [Google Scholar]
- [4].García-Santamaría F, Chen Y, Vela J, Schaller RD, Hollingsworth JA, Klimov VI. Nano Lett. 2009;9:3482. doi: 10.1021/nl901681d. [DOI] [PMC free article] [PubMed] [Google Scholar]
- [5].Pinaud F, Clarke S, Sittner A, Dahan M. Nat. Methods. 2010;7:275. doi: 10.1038/nmeth.1444. [DOI] [PubMed] [Google Scholar]
- [6].Pons T, Mattoussi H. Ann. of Biomed. Eng. 2009;37:1934. doi: 10.1007/s10439-009-9715-0. [DOI] [PubMed] [Google Scholar]
- [7].Park S, Clark BL, Keszler DA, Bender JP, Wager JF, Reynolds TA, Herman GS. Science. 2002;297:65. doi: 10.1126/science.1072009. [DOI] [PubMed] [Google Scholar]
- [8].Li JJ, Wang YA, Guo W, Keay JC, Mishima TD, Johnson MB, Peng X. J. Am. Chem. Soc. 2003;125:12567. doi: 10.1021/ja0363563. [DOI] [PubMed] [Google Scholar]
- [9].Xie R, Kolb U, Li J, Basché T, Mews A. J. Am. Chem. Soc. 2005;127:7480. doi: 10.1021/ja042939g. [DOI] [PubMed] [Google Scholar]
- [10].van Embden J, Jasieniak J, Mulvaney P. J. Am. Chem. Soc. 2009;131:14299. doi: 10.1021/ja9030209. [DOI] [PubMed] [Google Scholar]
- [11].Mahler B, Spinicelli P, Buil S, Quelin X, Hermier J-P, Dubertret B. Nature Mater. 2008;7:659. doi: 10.1038/nmat2222. [DOI] [PubMed] [Google Scholar]
- [12].Mahler B, Lequeux N, Dubertret B. J. Am. Chem. Soc. 2010;132:953. doi: 10.1021/ja9034973. [DOI] [PubMed] [Google Scholar]
- [13].Yu WW, Qu L, Guo W, Peng X. Chem. Mater. 2003;15:2854. [Google Scholar]; 2004;16:560. [Google Scholar]
- [14].Fery-Forgues S, Lavabre D. Chem. Mater. 1999;76:1260. [Google Scholar]
- [15].Htoon H, Malko A, Bussian D, Vela J, Chen Y, Hollingsworth JA, Klimov VI. Nano Lett. doi: 10.1021/nl1004652. Article ASAP. [DOI] [PMC free article] [PubMed] [Google Scholar]
- [16].Krauss TD, Brus LE. Phys. Rev. Lett. 1999;83:4840. [Google Scholar]
- [17].Cragg GE, Efros AL. Nano Lett. 2010;10:313. doi: 10.1021/nl903592h. [DOI] [PubMed] [Google Scholar]
- [18].Jeong S, Achermann M, Nanda J, Ivanov S, Klimov VI, Hollingsworth JA. J. Am. Chem. Soc. 2005;127:10126. doi: 10.1021/ja042591p. [DOI] [PubMed] [Google Scholar]
- [19].Hohng S, Ha T. J. Am. Chem. Soc. 2004;126:1324. doi: 10.1021/ja039686w. [DOI] [PubMed] [Google Scholar]
- [20].Peterson JJ, Nesbitt DJ. Nano Lett. 2009;9:338. doi: 10.1021/nl803108p. [DOI] [PubMed] [Google Scholar]
- [21].Kuno M, Fromm DP, Hamann HF, Gallagher A, Nesbitt DJ. J. Chem. Phys. 2000;112:3117. [Google Scholar]
- [22].Stefani FD, Hoogeboom JP, Barkai E. Physics Today. 2009;62:34. [Google Scholar]
- [23].Sugisaki M, Hong-Wen R, Nishi K, Masumoto Y. Phys. Rev. Lett. 2001;86:4883. doi: 10.1103/PhysRevLett.86.4883. [DOI] [PubMed] [Google Scholar]
- [24].Berg HC. Rev. Sci. Instrum. 1971;42:868. doi: 10.1063/1.1685246. [DOI] [PubMed] [Google Scholar]
- [25].Barak LS, Webb WW. J. Cell Biol. 1981;90:595. doi: 10.1083/jcb.90.3.595. [DOI] [PMC free article] [PubMed] [Google Scholar]
- [26].Kusumi A, Sako Y, Yamamoto M. Biophys. J. 1993;65:2021. doi: 10.1016/S0006-3495(93)81253-0. [DOI] [PMC free article] [PubMed] [Google Scholar]
- [27].Schmidt T, Schütz GJ, Baumgartner W, Gruber HJ, Schindler H. Proc. Natl. Acad. Sci. U.S.A. 1996;93:2926. doi: 10.1073/pnas.93.7.2926. [DOI] [PMC free article] [PubMed] [Google Scholar]
- [28].Yildiz A, Forkey JN, McKinney SA, Ha T, Goldman YE, Selvin PR. Science. 2003;300:2061. doi: 10.1126/science.1084398. [DOI] [PubMed] [Google Scholar]
- [29].Lessard GA, Goodwin PM, Werner JH. Appl. Phys. Lett. 2007;91:224106. [Google Scholar]
- [30].Lessard GA, Goodwin PM, Werner JH. In: Ultrasensitive and Single-Molecule Detection Technologies. Enderlein J, Gryczynski ZK, editors. Vol. 6092. SPIE; 2006. p. 609205. [Google Scholar]
Associated Data
This section collects any data citations, data availability statements, or supplementary materials included in this article.


