

Abstract
Purpose
To examine the grading (inter-rater) reliability of the Age-Related Eye Disease Study (AREDS) Clinical Lens Grading System (ARLNS).
Design
Evaluation of diagnostic test or technology
Participants
150 volunteers (284 eyes)
Methods
Participants with lens opacities of varying severity were independently graded at the slit lamp for cataract severity by 2 examiners (retinal or anterior segment specialists) using the ARLNS, which employs 3 standard photographs of increasing severity for classifying each of the 3 major types of opacity. Lens photographs were taken and graded at a reading center using the more detailed AREDS System for Classifying Cataracts from Photographs.
Main Outcome Measures
The Pearson correlation, weighted-kappa, and limits-of-agreement statistics were used to assess the inter-rater agreement of the gradings.
Results
Examinations were performed on 284 lenses (150 participants). Tests of inter-rater reliability between pairs of clinicians showed substantial agreement between clinicians for cortical and posterior subcapsular opacities and moderate agreement for nuclear opacities. A similar pattern and strength of agreement was present when comparing scores of retinal versus anterior segment specialists. Inter-rater agreement between clinical and reading center gradings was not as great as inter-clinician agreement.
Conclusions
Inter-rater agreements were in the moderate to substantial range for the clinical assessment of lens opacities. Inherent differences in cataract classification systems that rely on slit lamp vs photographic assessments of lens opacities may explain some of the disagreement noted between slit lamp and photographic gradings. Given the inter-rater reliability statistics for clinicians and the simplicity of the grading procedure, ARLNS is presented for use in studies requiring a simple, inexpensive method for detecting the presence and severity of the major types of lens opacities.
Keywords: cataract, grading system, inter-rater reliability
In recent years standardized lens photography with centralized grading of photographs by trained graders has been the “gold standard” for grading cataract presence and severity. Systems that have used photographs to document and monitor lens status include the Age-Related Eye Disease Study (AREDS) System for Classifying Cataracts from Photographs,1 the Lens Opacities Classification (LOCS) Systems,2,3 the Wilmer System,4 and the Oxford System.5 The use of lens photographs and centralized grading, however, is too expensive and complex for use in many studies. Simple and inexpensive diagnostic methods to detect the presence and/or progression of the three major types of cataract are desirable for studies with budgetary constraints and limited opportunities for examiner training. In large multi-center clinical trials and epidemiological studies, as well as studies in which cataract is an important but secondary outcome of interest (i.e., pharmacological studies), clinical grading at the slit lamp may be the only feasible approach to monitoring lens status. Most of the previously cited photographic systems for classifying cataract have been adapted for clinical slit lamp classification and have reportedly been relatively reliable in the hands of dedicated, well trained lens researchers. Less clear is the reliability of slit lamp monitoring of cataract in studies with large numbers of examiners, frequent turnover of examiners, limited training opportunities, and participation by ophthalmologists whose primary area of interest is other than the lens.
The Age-Related Eye Disease Study developed the Age-Related Eye Disease Study (AREDS) Clinical Lens Grading System (ARLNS) for grading the presence and severity of nuclear, cortical and posterior subcapsular (PSC) lens opacities (the 3 main types of age-related cataract) in a clinical setting. The system was designed to require minimal examiner training for persons already proficient in the use of the slit lamp. While an adaptation of ARLNS is currently being used in some clinical studies such as the Longitudinal Study of Ocular Complications of AIDS (LSOCA), the development of the National Eye Institute-Visual Function Questionnaire, the Age-Related Eye Disease Study (AREDS), and Age-Related Eye Disease Study 2 (AREDS2), there is no published assessment of the grading reliability (i.e., inter-rater reliability) of the system. In the current study, data were collected to assess the inter-rater grading agreement of: (1) paired clinicians with both using the ARLNS, and (2) clinicians using the ARLNS and photographic graders at a reading center using the AREDS System for Classifying Cataracts from Photographs.
Study Design and Methods
A total of 150 adult men and women over the age of 50 years, who were already participating in ongoing National Eye Institute (NEI) research protocols, were included in the study. Participants were selected to span the range of severity for the 3 major types of age-related lens opacities (nuclear, cortical, and PSC). ARLNS has 4 severity grades for each type of lens opacity. A total of 4 ophthalmologists participated: 2 retinal specialists and 2 anterior segment specialists. A pair of these 4 clinicians, typically one of each specialty, examined each participant and scored the lens opacity using the ARLNS. Minimal training was provided to the clinicians; they were provided with the standard photographs and a written explanation of how the photographs were to be utilized. Concurrently, standardized slit lamp and retroillumination lens photographs were taken and independently graded at the University of Wisconsin AREDS Reading Center using the AREDS System for Classifying Cataracts from Photographs.1 This study was approved by the Institutional Review Board of the National Eye Institute at the National Institutes of Health, Bethesda, MD. Signed informed consent according to the Declaration of Helsinki was obtained from each subject.
AREDS Clinical Lens Grading System (ARLNS)
Pupils were dilated maximally, but a minimal dilation of 5 mm was required for inclusion in the study. Lenses were examined at the slit lamp for the presence and severity of three types of opacity: nuclear, cortical and PSC. For each type of opacity, the examiner compared the lens being examined with a series of three standard photographs of increasing severity. For each cataract type the standards (Figure 1) were selected with the first in each series to signify clinical presence, the second clinical significance, and the third severe occurrence. The 3 nuclear opacity standards correspond to standards 4, 5 and 6 in the AREDS System for Classifying Cataracts from Photographs. For cortical opacities, the percent involvement of the entire visible lens for the three standards is scored by the AREDS Reading Center as 11.3%, 23.3% and 54.3%. For PSC opacities, the percent pupillary involvement of the 5mm diameter central circle for the three standards is 2.3%, 16.8% and 41.7%, respectively. To reduce the “edge” effect that occurs when grading from standard photographs the grades were “decimalized” as recommended by Bailey et al.6 For example, if a nuclear opacity was thought to be half way between the first and second Standard Photographs a decimalized grade of 1.5 would be assigned. The AREDS Clinical Lens Grading Detailed Protocol appears in Appendix 1 (available at http://aaojournal.org).
Figure 1.
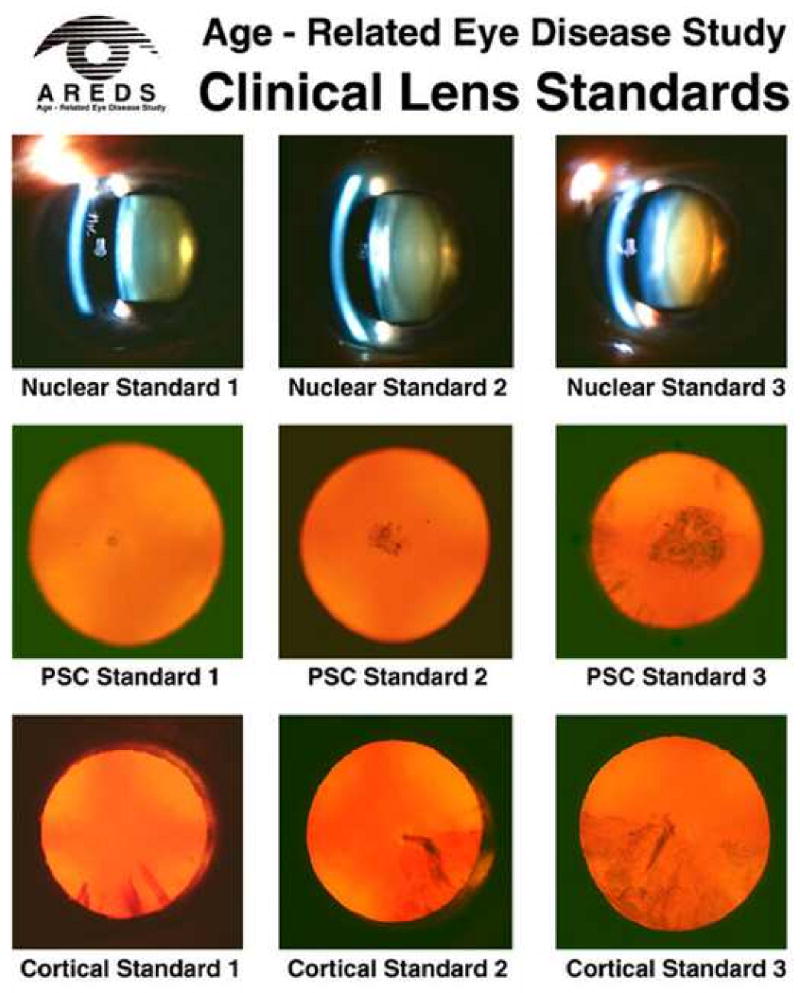
Standard photographs used in clinical grading. 1A: without outline of cortical and PSC opacities. 1B: with outlined cortical and PSC opacities. Standard photographs for use in clinical grading may be obtained from the Fundus Photograph Reading Center, Madison, WI: eyephoto.ophth.wisc.edu. Accessed Feb 18, 2010. PSC=posterior subcapsular.
AREDS System for Classifying Cataracts from Photographs
Specially modified Topcon slit-lamp cameras and Neitz retroillumination cameras were used by certified photographers to take color photographs of the lenses. The lens photographs were graded for lens opacities at a reading center by trained and certified examiners. The AREDS System for Classifying Cataracts from Photographs was used to assess the presence and severity of nuclear, cortical, and PSC lens opacities. Nuclear opacity grades ranged from 0.9 to 6.1 using cut-points set by a series of standard photographs with increasingly severe nuclear opalescence. The extent of cortical and of PSC opacities was graded by estimating the area of lens involvement in sectors of a grid overlay on the retroillumination photographs. The individual subfield percentages were combined to estimate an overall percentage of lens involvement (0-100%). The percent involvement of the entire visible lens is used for cortical opacity and the percent involvement of the 5mm diameter central circle is used for PSC opacity.
Analysis Methods
Although it is not uncommon for reports of new grading methods to present only one statistic, several authors argue that a single statistic may not adequately describe the inter-rater reliability of a grading system. 7-9 In an effort to more fully characterize the inter-rater grading agreement in ARLNS three statistics (weighted-Kappa, Pearson correlation, and limits-of-agreement) and several graphical presentations are provided in this report.
The weighted-Kappa statistic (κ) indicates the strength of agreement between the categories (0, 1, 2, 3) assigned by graders.10-13 Graders with perfect agreement will both assign the same category to each lens. The Fleiss-Cohen weights were used.12 The weighted-Kappa statistic with these quadratic weights is generally close to intraclass correlation and Pearson correlation coefficients. Categorical scores were assigned by rounding the decimalized score to the next lower integer score (e.g., 1.7 becomes 1). Common interpretations for the Kappa statistic (κ) are as follows13:
slight agreement if κ ≤ 0.2;
fair agreement if 0.2 < κ ≤ 0.4;
moderate agreement if 0.4 < κ ≤ 0.6;
substantial agreement if 0.6 < κ ≤ 0.8; and
almost perfect agreement if κ > 0.8.
Pearson's correlation statistic (ρ) will compare decimalized scores and ranges from -1 to 1 and represents the strength of a linear relationship between two scores. A Pearson correlation of 1 indicates a perfect, positive linear relationship even when the actual values of the two scores are not identical (e.g., if one grader is always exactly 1 point higher than another).
Results are presented graphically by scatterplots and Bland-Altman14 figures. On each scatterplot, a 45° reference line and a fitted (polynomial regression) line are overlaid. In the case of perfect correlation and agreement, all points and the fitted line would be coincident with the reference line. Differences between the fitted line and the 45° reference line will provide some indication of variance from a linear relationship. The shaded region of each Bland-Altman figure defines the limits-of-agreement representing the range of expected difference between two graders; approximately 95% of the data are between the limits of agreement. Interpretation of Bland-Altman is informal but should consider whether the limits-of-agreement are acceptable (i.e., are differences outside the limits clinically important) and whether a substantial bias is observable. Bias would be reflected by the shaded region lying primarily on one side of zero. A system with excellent inter-rater reliability will have a high Kappa value, a high correlation, and narrow limits-of-agreement, with points falling close to the 45° reference line on the scatter plots and centered around zero on Bland-Altman plots.
Comparisons between clinical and reading center scores were done using the same techniques as described for the clinician comparisons. However, since the reading center scores are on a scale different from the clinical scores, three cutpoints corresponding to the series of three standard photographs of increasing severity (described in the preceding sections) were used to convert the reading center scores to the same scale as the clinical scores. To construct 95% confidence interval estimates, estimating equation methods were used to adjust variance estimates for a possible correlation between bilateral ocular measurements within the same participant.15 All the data analyses were conducted using SAS® version 9.2 (SAS Institute, Cary, NC).
Results
A total of 150 participants with at least one natural lens were enrolled in the study between May 2004 and February 2005. Of these, 92 (61%) participants had best-corrected visual acuity worse than 20/20. The causes of visual loss in the 92 participants were age-related macular degeneration (AMD) (22 / 92 = 24%), non-AMD retinal diseases (16 / 92 = 17%) and lens opacity without retinal disease (51 / 92 = 55%); reason for visual loss was not available for 3 subjects. Table 1 summarizes participants' baseline characteristics. Of the 150 enrolled subjects, 16 (11%) had a natural lens in one eye only, leaving 284 individual lenses available for grading. Figure 2 displays the number of lenses graded by clinician pairs and the reading center.
Table 1. Demographics and ophthalmic status of participants at the exam.
| Demographics | |
| Mean Age (Range) | 65 (28-92) |
| Female | 82 / 150 (55%) |
| Ophthalmologic Characteristics | |
| Unilateral pseudophakia | 16 / 150 (11%) |
| BCVA Worse than 20/20 | 92 / 150 (61%) |
| Primary Reason for Visual Loss | |
| Age-related macular degeneration | 22 / 92 (24%) |
| Non-AMD retinal disease | 16 / 92 (17%) |
| Lens opacity, no retinal disease | 51 / 92 (55%) |
| Not recorded | 3 / 92 (3%) |
BCVA Best corrected visual acuity; AMD age-related macular degeneration
Figure 2.
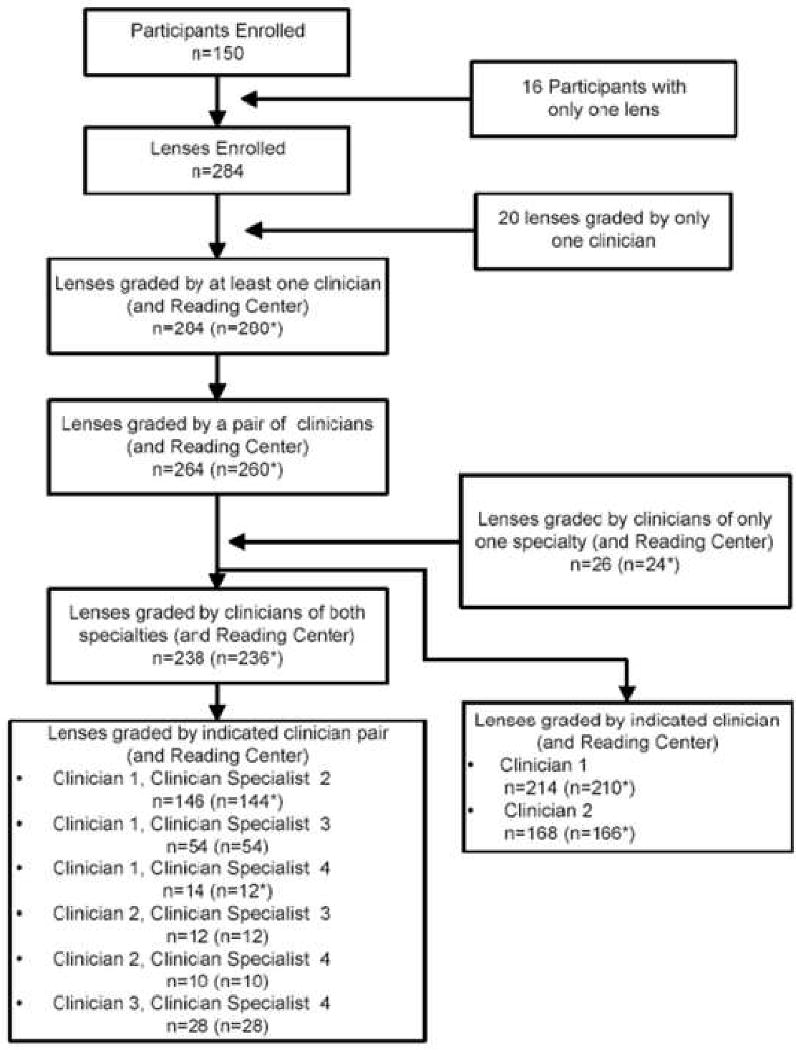
Enrollment and grading flowchart. The * indicates that some photographs were not gradeable.
Inter-clinician Agreement
A total of 264 natural lenses were graded by various pairs of NEI clinicians. Table 2 summarizes inter-rater agreement statistics. Considering the clinical scores of all pairs of retinal and anterior segment specialists provides the most available pairs for assessment of inter-clinician reliability (n=238). The scores were strongly correlated (ρnuc = 0.76, ρcort = 0.90, ρpsc = 0.83) while the kappa statistic showed moderate agreement for nuclear opacity (κnuc = 0.72) and substantial agreement for cortical and PSC opacities (κcor = 0.82 and κpsc = 0.82). The limits-of-agreement for cortical opacities were < 1 grade while nuclear (1.22) and PSC (1.24) were in excess of one grade.
Table 2. Inter-Rater Reliability for Each Cataract Type.
| Opacity Type | |||
|---|---|---|---|
| Nuclear | Cortical | Posterior Sub-Capsular | |
| Clinical Comparisons | |||
| Clinician1 vs Clinician2 | |||
| Pearson correlation | 0.86(0.80, 0.92) | 0.89(0.83, 0.95) | 0.76(0.63, 0.89) |
| Weighted-kappa | 0.74(0.63, 0.84) | 0.81(0.70, 0.92) | 0.77(0.64, 0.90) |
| Limits-of-agreement | ± 0.97 | ± 0.85 | ± 1.36 |
| Clinician1 vs Clinician3 | |||
| Pearson correlation | 0.64(0.39, 0.88) | 0.90(0.81, 0.98) | 0.87(0.76, 0.98) |
| Weighted-kappa | 0.68(0.44, 0.92) | 0.82(0.70, 0.95) | 0.86(0.74, 0.97) |
| Limits-of-agreement | ± 1.51 | ± 1.02 | ± 1.27 |
| Retinal Specialists vs Anterior Specialists | |||
| Pearson correlation | 0.76(0.68, 0.84) | 0.90(0.86, 0.94) | 0.83(0.78, 0.91) |
| Weighted-kappa | 0.72(0.63, 0.81) | 0.82(0.75, 0.90) | 0.82(0.75, 0.90) |
| Limits-of-agreement | ± 1.22 | ± 0.86 | ± 1.24 |
| Clinical to Reading Center Comparison | |||
| Clinician1 vs Reading Center | |||
| Pearson Correlation | 0.87(0.83, 0.92) | 0.85(0.78, 0.92) | 0.82(0.77, 0.80) |
| Weighted-kappa | 0.64(0.52, 0.77) | 0.73(0.61, 0.84) | 0.69(0.57, 0.81) |
| Limits-of-agreement | ± 1.04 | ± 1.01 | ± 1.16 |
| Clinician2 vs Reading Center | |||
| Pearson correlation | 0.87(0.83, 0.92) | 0.77(0.64, 0.90) | 0.73(0.61, 0.86) |
| Weighted-kappa | 0.53(0.41, 0.66) | 0.71(0.53, 0.88) | 0.58(0.39, 0.78) |
| Limits-of-agreement | ± 0.81 | ± 0.99 | ± 1.58 |
| Clinician Average vs Reading Center | |||
| Pearson correlation | 0.82(0.76, 0.88) | 0.84(0,77, 0.92) | 0.80(0.73, 0.83) |
| Weighted-kappa | 0.53(0.40, 0.66) | 0.77(0.66, 0.88) | 0.65(0.52, 0.78) |
| Limits-of-agreement | ± 0.98 | ± 1.11 | ± 1.29 |
95% confidence interval estimates in parentheses
The clinician pair with the highest number of grades was Clinician1 and Clinician2 (n = 146). Scores from these two clinicians are highly correlated for all three opacity types (ρnuc = 0.86, ρcort = 0.89, ρpsc = 0.76). Kappa statistics show substantial agreement for nuclear (κnuc = 0.74) cortical (κcor = 0.81), and PSC (κpsc = 0.77) opacities. Limits-of-agreement are < 1 grade for nuclear and cortical opacities and 1.36 for PSC. A similar pattern of agreement is observed comparing Clinician 1 and Clinician 3 (n = 54, κnuc = 0.68, κcor = 0.82 and κpsc = 0.86). Although not as strong as between Clinician1 and Clinician 2, the correlation is moderate (ρnuc = 0.64) for nuclear opacities and strong for Cortical and PSC (ρcort = 0.90, ρpsc = 0.87) and the limits of agreement are all less than 1.51 grades. Substantially fewer lenses were graded by the other pairings of clinicians and the results are therefore less reliable and not presented.
Figure 3 shows scatterplots and Bland-Altman plots of the Retinal/Anterior Segment (AS) specialist pairs of grades. The dispersion of points around the reference line reflects the strength of the correlation between the specialties. For nuclear opacities, the polynomial fit is above the reference line for low grades and then slightly below the reference line for higher grades. This indicates that for mild opacities (e.g., scores of 0 to 1.5), retinal specialists tended to grade higher than anterior segment specialists but for grades of >1.5 there is no systematic difference between the specialties. For all three opacity types, there is some mild curvature of the polynomial fit, but the polynomial fitted line remains proximate to the reference line and reflects the strength of the linear relationship. The slight departure of the polynomial fit from the reference line is consistent with the moderate to substantial agreement suggested by the Kappa statistic. This is reflected in the Bland-Altman plots where the limits-of-agreement are not dramatically off-center and predict that scores of two clinicians will be within ± 1.25 for nuclear and PSC opacity and ± 0.86 for cortical opacity.
Figure 3.
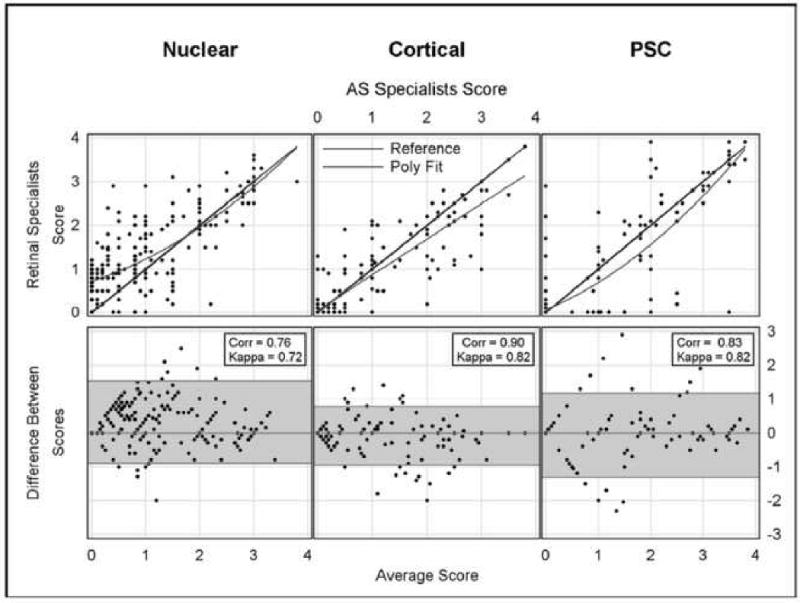
Comparison of scores from clinical specialties. Top row is scatterplots; straight line indicates perfect agreement, curved line is quadratic fit to the data. Corr is Pearson correlation for scatterplots. Bottom row is Bland-Altman plots. Shaded area includes approximately 95% of the differences between scores. AS=anterior segment specialist. PSC=posterior subcapsular.
Clinician-Reading Center Agreement
Table 2 also summarizes comparisons of Clinician 1 and Clinician 2 with the reading center. Overall, both clinicians demonstrated similar correlation and agreement with the reading center scores. Clinician 2 was moderately correlated with the reading center (ρnuc = 0.87, ρcort = 0.77, ρpsc = 0.73), comparable to Clinician 1 (ρnuc = 0.87, ρcort = 0.85, ρpsc = 0.82). However, in terms of agreement with the reading center, while Clinician1 demonstrated substantial agreement for all opacity types (κnuc = 0.64, κcor = 0.73, κpsc = 0.69), Clinician 2 would be categorized as having only moderate agreement for nuclear opacities (κnuc = 0.53) and for PSC opacities (κpsc = 0.58). Agreement for cortical opacities was comparable for both clinicians. The limits-of-agreement between either clinician and the reading center are approximately 1 grade for nuclear and cortical opacities and slightly higher for PSC opacities. The number of lenses graded by the other clinicians and the reading center are too few to provide reliable results and are not individually reported.
Since agreement results for each individual clinician were similar, results for each pair of clinicians were averaged for each graded lens and compared with reading center scores. Although this does not reflect the relationship between a particular clinician and the reading center, it does provide an estimate of the typical agreement between clinicians and the reading center. Results are summarized in Table 2 and presented graphically in Figure 4.
Figure 4.
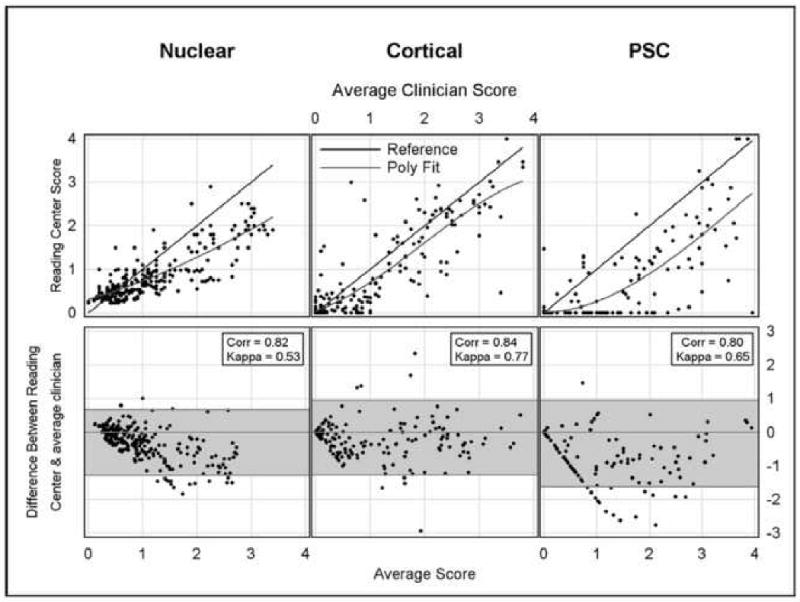
Comparison of clinical and reading center scores. Top row is scatterplots; straight line indicates perfect agreement, curved line is quadratic fit to the data. Corr is Pearson correlation for scatterplots. Bottom row is Bland-Altman plots. Shaded area includes approximately 95% of the differences between scores. PSC=posterior subcapsular.
Table 2 shows that the correlation of the averaged clinical score with the reading center score is higher than the individual score comparisons (ρnuc = 0.82, ρcort = 0.84, ρpsc = 0.80). The average clinical score shows moderate agreement with the reading center score for nuclear grades (κnuc = 0.53) and substantial agreement for cortical and PSC grades (κcor = 0.77 and κpsc = 0.65). Figure 4 shows that the polynomial fit is proximate to the reference line throughout the range of the data. The Bland-Altman plots in Figure 4 comparing the reading center and average clinical scores show a limit-of-agreement of ± 1 grade for nuclear opacities, and ± 1.11 and ±1.29 for cortical and PSC opacities, respectively.
Discussion
The goal of this study was to evaluate the utility and reproducibility of a clinical lens grading system that does not require the added costs and logistical complexity of classification systems that evaluate lens photographs at a reading center. The inter-observer agreement of the clinical assessments at the slit lamp for the 3 different lens opacity types appeared good, with weighted kappa values ranging from 0.76 to 0.83 and with limits of agreement of ± 0.86 to ± 1.24 for two clinicians of different specialties. These results suggest that the AREDS clinical lens grading system may be adequate for some clinical research applications that do not require the detection of small changes in cataract progression.
Several other classification systems for grading lens opacities at the slit lamp have been evaluated. The developers of the Lens Opacities Classification System II2, that uses photographic standards of the 3 types of cataract, reported very good interobserver reproducibility of slit lamp gradings, with kappa values over 0.65 for the various types of cataract. Other lens researchers have also reported a high level of reproducibility of the clinical gradings with LOCSII. LOCSII has been largely replaced by LOCSIII3 which has a larger number of standards for each cataract type. The Wilmer cataract grading system4 uses standard photographs for grading nuclear cataract, estimates of pupillary involvement for grading cortical opacities and slit lamp measurements for grading PSC opacities. Weighted kappa statistics for interobserver agreement were between 0.41 and 0.71, similar to the agreement that we observed with the AREDS grading system.
The World Health Cataract Grading Group16 developed and field tested a system with similarities to the AREDS system. As with our system, nuclear opacities were graded using a set of 3 standard photographs. Cortical opacities were graded by estimating the circumferential extent of cortical opacities and grouping them into 4 categories of increasing extent. PSC opacities were graded by measuring the vertical dimension of the opacity and grouping the measurements into 4 categories. In field testing by residents in ophthalmology at various locations weighted kappas were similar to ours, ranging from 0.38 to 0.59 for nuclear cataract; from 0.67 to 0.72 for cortical cataract; and from 0.62 to 0.85 for PSC cataract.
We noted that clinical grading in the AREDS system was somewhat higher than the photographic grading for all three types of opacity (figure 4), particularly at the low end of the opacity scale. The procedures for grading of cortical and PSC from lens photographs require a distinct dark appearance against the red reflex background. Clinicians can identify more diaphanous opacities with a slit beam that do not show well against the red reflex. Problems in reliably capturing the image of less dense opacities on photographs, especially when more than one type of opacity is present and the inherent advantage of slit lamp assessment with its 3 dimensional capabilities and variable illumination, may explain some of these discrepancies between clinical and photographic grading. Studies of other clinical classification systems have also noted that there is a tendency to underestimate PSC and cortical cataracts on photographic grading systems.17,18
The AREDS Clinical Lens Grading System (ARLNS) is simple to use, portable, and cost effective. It may be considered for use in studies that require simple and inexpensive methods to detect the presence of the three major types of cataract, longitudinal studies in which cataract is an important but secondary outcome of interest (e.g., pharmacological studies), large epidemiological studies with many examiners and cataract studies with budgetary constraints. Although we did not test this for longitudinal study of cataract, it may be useful for capturing clinically meaningful cataract progression. For investigators interested in evaluating clinical progression of lens opacities, the utility of this grading system may warrant further testing.
Acknowledgments
Supported by contracts from the National Eye Institute, National Institutes of Health, Department of Health and Human Services, Bethesda, Maryland
Areds Clinical Lens Grading Protocol - Detailed Protocol
7.19.1 Overview
The AREDS Clinical Lens Grading Protocol was developed for grading the presence and severity of nuclear, cortical and PSC lens opacities in a clinical setting. The simplified grading system requires minimal grader training for persons already proficient in the use of the slit-lamp. A careful reading of the protocol and close adherence to the grading instructions are needed to collect data in a uniform fashion.
7.19.2 General Instructions
Dilation - Pupils should be dilated to at least 5mm.
Grading of Opacities - The lenses are examined at the slit lamp with 10X magnification for the presence and severity of three types of lens opacity: nuclear opalescence, cortical opacity, and posterior subcapsular (PSC) opacity. For each type of opacity, the examiner compares the lens being examined with a series of three standard photographs of increasing severity. The standard photographs are combined onto one print, which can be held up or mounted next to the slit lamp for reference. The examiner determines whether the lens being examined has an opacity that equals one of the standard photographs or an opacity whose severity falls between the standard photographs. If the severity of the opacity falls between the standard photographs, a decimalized grade was assigned corresponding to the percent of the way the opacity falls between the standard photographs. In 1999, this procedure was changed to a three-level grade. Answers are recorded on the AREDS followup visit form by selecting the appropriate code numbers separately for right and left eyes. If the examiner cannot evaluate the lens for a particular type of opacity, a “8-cannot grade” code is provided.
7.19.3 Grading of Nuclear Sclerosis
Nuclear Landmarks - In the normal or nonsclerotic lens, the “nucleus” consists of a central dark interval (sulcus), adjacent bean-shaped brighter areas (lentils--one anterior and one posterior to the sulcus), and brighter curved bands (lamellae, or nuclear surface bands) anterior and posterior to the lentils and separated from them by narrow dark bands. Although nuclear sclerosis standard 1 shows signs of moderate opalescence, many of these features are visible.
Grading Rules - For grading the severity of nuclear sclerosis two factors are considered: 1) the optical density (sometimes described as Aopalescence@) of the nuclear landmarks, especially the sulcus, and 2) the definition of these structures (contrast between light and dark bands). Optical density is given greater weight. In the early stages of nuclear sclerosis, increased optical density is noticeable only in the normally dark bands, particularly the sulcus, but in advanced stages the density of all bands becomes greater. With increasing nuclear sclerosis, the definition of nuclear landmarks decreases, and finally disappears. For grading nuclear status the primary consideration is the degree of reflectance (sometimes termed “opalescence”) of the sulcus, with secondary consideration given to the definition of the nuclear features, i.e. contrast of the dark and bright bands.
Nuclear Standard Photographs - Three standard photographs with increasing amounts of nuclear opalescence are used for grading. In Nuclear Standard 1 the density of the sulcus has increased so that only a suggestion of the sulcus can be detected. Towards the upper and lower ends of the sulcus, segments of what appears to be the equator of the fetal nucleus (or a zone just beneath its surface) are visible as steeply curved white lines. Only a small part of the anterior lentil is visible. The posterior nuclear surface band cannot be seen at all and the anterior one is very faint. In Nuclear Standard 2, the sulcus has become so dense that only a faint shadow marks its location at the center of the lens, and the entire nucleus has become dense enough that lentils and lamellae are not distinguishable. Nuclear Standard 3 shows a further increase in nuclear density, to the point that neither the sulcus nor other features are distinguishable.
Slit Lamp Settings - Grading of nuclear opalescence is done with the illuminating beam of the slit lamp angled at 45° to the viewing axis, the slitbeam width set at 0.3mm and the slitbeam height set at 9mm.
-
Codes for Nuclear Grading - Decimalized nuclear grades were originally assigned as follows:
0.0 = No nuclear opacity
1.0 = Nuclear Standard 1
2.0 = Nuclear Standard 2
3.0 = Nuclear Standard 3
4.0 = Completely opacified
8 = Cannot evaluate
If you believe the severity of the opacity is between two standard photos, estimate the percent of the way between the two standards; e.g., halfway between 1 and 2 would be 1.5. If the severity of the opacity is greater than the last standard, estimate the percent of the way between the last standard and a completely opacified lens, e.g., 3.8 or 3.3.
In 1999, scores were changed to:
1 = If < Standard 2
2 = If ∃Standard 2, < Standard 3
3 = If ∃ Standard 3
8 = Cannot grade
7.19.4 Grading of Cortical Opacities
Grading Rules - Grading of cortical opacities is done at the slit lamp using a red reflex image. The slit beam height and width are set by the examiner according to his/her usual practice as long as retroillumination is obtained. The position may be changed as needed so that all areas of the lens can be viewed against the red reflex. With retroillumination cortical opacities appear darker than the adjacent red reflex. An area is considered involved by opacity if it is definitely more opaque than adjacent uninvolved areas. Opacities not seen against the red reflex are not counted. For comparison with the standard photographs, all areas of opacity are mentally rearranged into a contiguous mass and the total area of involvement is compared with the standard photographs. Vacuoles (small round cyst-like features) are not considered to be part of cortical opacity unless they are organized, e.g., part of a linear formation. When determining the extent of involvement, sizable clear areas bounded by opacity are subtracted from the total. Areas occupied by posterior cortical opacities that are not overlapped by anterior cortical opacities are added to obtain the total area of involvement. The density of opacity is not taken into account. Cortical and PSC opacities are differentiated from each other mainly by location, and secondarily by configuration.
-
Cortical Standard Photographs - Cortical opacities typically are wedge-shaped and radially oriented, extending from the periphery toward the center. Their appearance varies from dense opacity to diffuse collections of dots separated by clear areas.
Three standards with increasing amounts of cortical opacity are used for grading cortical opacities. In each standard the dashed white line defines the margins of the opacities. In cortical opacity Standard 1, three small spokes project in from the periphery between 5 and 7 o'clock, with a clear space between the spokes at 5:00 and 5:45. In Standard 2, a pie-shaped wedge extends from 3 to 6 o'clock, with a separate small spoke at 2:30. Standard 3 shows a semi-circle of cortical opacity extending from 3:30 to 9:30, with a dense spoke projecting from it centrally, and a group of vacuoles near the 3:30 margin (included as opacity because they are organized).
-
Codes for Cortical Grading - Grading of cortical opacities is done by comparing the proportion of pupillary involvement with cortical opacities in the lens to be graded and the proportion of involvement in the standard photographs. Only opacities seen against the red reflex image are counted.
Decimalized cortical grades were originally assigned as follows:
0.0 = No cortical opacity
1.0 = Cortical Standard 1
2.0 = Cortical Standard 2
3.0 = Cortical Standard 3
4.0 = Completely opacified
8 = Cannot evaluate
If you believe the severity of the opacity is between two standard photos, estimate the percent of the way between the two standards, e.g., one-third of the way between 1 and 2 would be 1.3. If the severity of the opacity is greater than the last standard, estimate the percent of the way between the last standard and a completely opacified lens, e.g., 3.9.
In 1999, scores were changed to:
1 = If < Standard 2
2 = If ∃Standard 2, < Standard 3
3 = If ∃Standard 3
8 = Cannot grade
7.19.5 Grading of PSC Opacities
Grading Rules - Grading rules are similar to those for cortical opacities (See Section IV. A.), except that the red reflex image is focused at the plane of the posterior capsule. In this position the pupillary margin should be blurred. PSC opacities are considered to be present only when an area is definitely more opaque than adjacent areas as seen against the red reflex. For comparison with the standard photographs, all areas of PSC opacity are mentally rearranged into a contiguous mass and the total area of involvement is compared with the standard photographs. Mittendorf dots are disregarded. The density of PSC opacities is not taken into account.
PSC Standard Photographs - PSC opacities are seen just beneath the posterior lens capsule. Frequently they are centered near the posterior pole of the lens. Although they usually appear as a lacy configuration which may contain vacuoles (any such are considered part of PSC), they may range from a darkly opaque network to a barely discernible diffuse haze. Because PSC opacities are fairly compact with few clear areas, small spaces within PSC are not subtracted from the estimate of extent. Three standard photographs with increasing amounts of PSC opacity are used for grading PSC opacities. In each standard the dashed white line defines the margins of the opacities. In PSC Standard Photograph 1, a roundish opacity is located just left of center in the photograph. In PSC Standard 2 a larger opacity, also left of center, includes vacuoles around nearly half of its perimeter. Within its margins of the density of the involved area is uneven, but the entire region is considered opacified. PSC Standard 3 shows a roundish opacity that is even larger and involves the center of the lens. (An array of cortical spokes, located peripherally between 6:30 and 10:00 and rather unfocused, is not considered part of PSC.)
-
Codes for Grading PSC Opacities - PSC grading is done by comparing the size of the PSC opacity in the lens to be graded with the size of the PSC opacity in the standard photographs. Only opacities seen against the red reflex image are counted.
Decimalized PSC grades were originally assigned as follows:
0.0 = No PSC opacity
1.0 = PSC Standard 1
2.0 = PSC Standard 2
3.0 = PSC Standard 3
4.0 = Completely opacified
8 = Cannot grade
If you believe the severity of the opacity is between two standard photos, estimate the percent of the way between the two standards, e.g., two-thirds of the way between 1 and 2 would be 1.7. If the severity of the opacity is greater than the last standard, estimate the percent of the way between the last standard and a completely opacified lens, e.g., 3.2.
In 1999, scores were changed to:
1 = If < Standard 2
2 = If ∃Standard 2, < Standard 3
3 = If ∃Standard 3
8 = Cannot grade
Footnotes
The authors have no proprietary or commercial interest in any materials discussed in this article.
None of the authors have any financial interests to disclose.
This article contains additional online-only material. The following should appear online only: Appendix 1 (Detailed Grading Protocol)
Publisher's Disclaimer: This is a PDF file of an unedited manuscript that has been accepted for publication. As a service to our customers we are providing this early version of the manuscript. The manuscript will undergo copyediting, typesetting, and review of the resulting proof before it is published in its final citable form. Please note that during the production process errors may be discovered which could affect the content, and all legal disclaimers that apply to the journal pertain.
References
- 1.Age-Related Eye Disease Study Research Group. The Age-Related Eye Disease Study (AREDS) system for classifying cataracts from photographs: AREDS report no. 4. Am J Ophthalmol. 2001;131:167–75. doi: 10.1016/s0002-9394(00)00732-7. [DOI] [PMC free article] [PubMed] [Google Scholar]
- 2.Chylack LT, Jr, Leske MC, McCarthy D, et al. Lens Opacities Classification System II (LOCS II) Arch Ophthalmol. 1989;107:991–7. doi: 10.1001/archopht.1989.01070020053028. [DOI] [PubMed] [Google Scholar]
- 3.Chylack LT, Jr, Wolfe JK, Singer DM, et al. Longitudinal Study of Cataract Study Group The Lens Opacities Classification System III. Arch Ophthalmol. 1993;111:831–6. doi: 10.1001/archopht.1993.01090060119035. [DOI] [PubMed] [Google Scholar]
- 4.Taylor HR, West SK. The clinical grading of lens opacities. Aust N Z J Ophthalmol. 1989;17:81–6. [PubMed] [Google Scholar]
- 5.Sparrow JM, Bron AJ, Brown NA, et al. The Oxford clinical cataract classification and grading system. Int Ophthalmol. 1986;9:207–25. doi: 10.1007/BF00137534. [DOI] [PubMed] [Google Scholar]
- 6.Bailey IL, Bullimore MA, Raasch TW, Taylor HR. Clinical grading and the effects of scaling. Invest Ophthalmol Vis Sci. 1991;32:422–32. [PubMed] [Google Scholar]
- 7.Stemler SE. A comparison of consensus, consistency, and measurement approaches to estimating interrater reliability. [July 23, 2009];Pract Assess Res Eval [serial online] 2004 9:e4. Available at: http://PAREonline.net/getvn.asp?v=9&n=4. [Google Scholar]
- 8.Hunt RJ. Percent agreement, Pearson's correlation, and kappa as measures of inter-examiner reliability. J Dent Res. 1986;65:128–30. doi: 10.1177/00220345860650020701. [DOI] [PubMed] [Google Scholar]
- 9.Maclure M, Willett WC. Misinterpretation and misuse of the kappa statistic. Am J Epidemiol. 1987;126:161–9. doi: 10.1093/aje/126.2.161. [DOI] [PubMed] [Google Scholar]
- 10.Cohen J. A coefficient of agreement for nominal scales. Educ Psychol Meas. 1960;20:37–46. [Google Scholar]
- 11.Cohen J. Weighted kappa: Nominal scale agreement with provision for scaled disagreement or partial credit. Psychol Bull. 1968;70:213–20. doi: 10.1037/h0026256. [DOI] [PubMed] [Google Scholar]
- 12.Fleiss JL, Cohen J. The equivalence of weighted kappa and the intraclass correlation coefficient as measures of reliability. Educ Psychol Meas. 1973;33:613–9. [Google Scholar]
- 13.Landis JR, Koch GG. The measurement of observer agreement for categorical data. Biometrics. 1977;33:159–74. [PubMed] [Google Scholar]
- 14.Bland JM, Altman DG. Statistical methods for assessing agreement between two methods of clinical measurement. Lancet. 1986;1:307–10. [PubMed] [Google Scholar]
- 15.Thompson JR. Estimating equations for kappa statistics. Stat Med. 2001;20:2895–906. doi: 10.1002/sim.603. [DOI] [PubMed] [Google Scholar]
- 16.Thylefors B, Chylack LT, Jr, Konyama K, et al. A simplified cataract grading system. Ophthalmic Epidemiol. 2002;9:83–95. doi: 10.1076/opep.9.2.83.1523. [DOI] [PubMed] [Google Scholar]
- 17.Leske MC, Chylack LT, Jr, Sperduto R, et al. Lens Opacities Case-Control Study Group Evaluation of a lens opacities classification system. Arch Ophthalmol. 1988;106:327–9. doi: 10.1001/archopht.1988.01060130353019. [DOI] [PubMed] [Google Scholar]
- 18.Maraini G, Pasquini P, Sperduto RD, et al. The effect of cataract severity and morphology on the reliability of the Lens Opacities Classification System II (LOCS II) Invest Ophthalmol Vis Sci. 1991;32:2400–3. [PubMed] [Google Scholar]