

Summary
Long-term potentiation and long-term depression are thought to be cellular mechanisms contributing to learning and memory. Although the physiological phenomena have been well characterized, little consensus of their underlying molecular mechanisms has emerged. One reason for this may be the under-appreciated complexity of the signaling pathways that can arise if key signaling molecules are discretely localized within the synapse. Recent findings suggest an unanticipated degree of structural organization at the synapse, and improved methods in cellular imaging of living tissue have provided much-needed information about the intracellular dynamics of Ca2+, thought to be critical for both LTP and LTD. In this review, we briefly summarize some of these developments, and show that a more complete understanding of cellular signaling depends on the successful integration of traditional biochemistry and molecular biology with the spatial and temporal details of synaptic ultrastructure. Biophysically realistic computer simulations can have an important role in bridging these disciplines.
Introduction
New techniques such as patch recording, which has made it possible to record currents through single channels, and multiphoton laser microscopy, which allows visualization of cellular processes with submicron resolution, have revealed a level of complexity in cell signaling that extends spatially to the subcellular level at millisecond time scales. New computational methods have also been developed to model cellular signaling in this regime. Here we review the application of these new modeling techniques to recent experimental data relevant to the modification of the strength of central glutamate synapses.
Most neurons interact through chemical synapses, comprising a pre- and postsynaptic cellular component. The starting point for activating a synapse is an action potential, a regenerative electrical signal, triggered by depolarization, which travels along the axon of the presynaptic cell. When the action potential reaches the synapse, VDCCs in the pre-synaptic membrane transiently open and, through a series of as yet poorly defined steps, can cause a synaptic vesicle to fuse with the cell membrane, releasing neurotransmitter into the synaptic cleft, a narrow space approximately 20 nm wide, between the two cells. The transmitter then diffuses across the cleft and binds to receptors on the postsynaptic membrane. These receptors are often ion channels, and a conformational change in the receptor as a result of transmitter binding results in a transient opening of its conducting pore. These pores are selective for different ions, whose flux across the membrane generates either an inward or an outward current in the postsynaptic cell, depending on the charge of the ion and the net direction of flux (i.e. into or out of the cell). Different transmitters can therefore result in either an increase (an excitatory synapse that generates an inward current) or a decrease (an inhibitory synapse that generates an outward current) in the probability that the postsynaptic cell will itself generate an action potential and, thus, relay the signal.
Glutamate, the major excitatory transmitter in the brain, binds to at least two distinct types of ionotropic receptors on the postsynaptic membrane; AMPA receptors (AMPARs) and NMDA receptors (NMDARs). Although a single EPSC is usually too small to induce an action potential, neurons typically integrate signals from thousands of synapses acting in concert. Thus, small but concerted changes in the efficacy of individual synapses can dramatically alter the behavior of a neuron.(1) These changes in synaptic efficacy, termed synaptic plasticity, have been the subject of intense study for the past three decades because changes in synaptic strength could be a cellular correlate of learning and memory.(2)
Long-term potentiation was first reported as a persistent increase in synaptic efficacy at synapses of the dentate gyrus in the rabbit hippocampus,(3) and has since been found at many other excitatory synapses studied in the mammalian brain. Theorists soon understood the need for a compensatory mechanism to depress synapses,(4,5) which was soon reported.(6–8) The best-characterized forms of these phenomena are NMDAR-dependent LTP and LTD of excitatory neurons in the CA1 region of the hippocampus. (Henceforth in this review, LTP and LTD refer specifically to the NMDAR-dependent forms of plasticity as principally characterized in pyramidal neurons.) LTP is reliably induced with either a high-frequency train of presynaptic activity or by pairing presynaptic stimulation with postsynaptic depolarization induced by a current injection into the postsynaptic cell, whereas a long train of low-frequency stimulation reliably induces LTD. The manner in which these changes are expressed has been controversial.(9) Because the presynaptic neuron may release vesicles with low probability, LTP or LTD could be expressed by either an increase or a decrease in release probability. Alternatively, synaptic efficacy could be increased by an increase in receptor strength or number. It may be that different stimulation conditions favor one or the other of these mechanisms.
Traditional approach to the induction of LTP and LTD
The induction of LTP and LTD seems to be more straightforward. Glutamate is released from the presynaptic vesicle, diffuses across the synaptic cleft and binds to AMPARs and/or NMDARs, which are often, but not always, colocalized on the postsynaptic membrane.(10–12) Doubly liganded AMPARs open, allowing Na+ into, and K+ out of the cell, causing a small EPSC, and a resulting change in membrane potential, an EPSP. A Mg2+ ion in the pore of the NMDAR blocks transmission under resting conditions. With strong depolarization, the Mg2+ ion is expelled from the pore of the channel and the liganded NMDAR opens. The source of depolarization typically includes local summation of EPSPs during a high-frequency burst of presynaptic activity or a direct injection of current into the cell. Open NMDARs, in addition to permitting the influx of Na+ and the efflux of K+ ions, also allow a significant number of Ca2+ ions to enter the cell, leading to the suggestion that the NMDAR-mediated increase in intracellular calcium concentration ([Ca2+]i) in the postsynaptic cell is instrumental in the induction of LTP and LTD. Specifically, a large increase in [Ca2+]i, typically following high frequency stimulation, is thought to induce LTP, whereas a more moderate increase in [Ca2+]i, typically following low frequency stimulation is thought to induce LTD(13,14) (Fig. 1).
Figure 1.

Simple, schematic model of frequency-selective, Ca2+-dependent induction of LTP and LTD. A: After release from the presynaptic bouton, postsynaptic AMPARs bind transmitter (not shown), causing them to open, and allowing Na+ to enter the spine. Increased postsynaptic voltage, often due to temporally summating EPSCs, expels a Mg2+ ion from the pore of the NMDAR, thus allowing the transmitter-bound receptors to open. Unlike AMPARs, NMDARs allow passage of significant amounts of both Na+ and Ca2+ into the spine. Moderate increases in [Ca2+]i activate a signal transduction cascade, probably involving calcineurin, which results in the expression of LTD. At higher [Ca2+]i levels, a different pathway, probably involving CaMKII, results in the expression of LTP. B: [Ca2+]i increases with increasing frequency of synaptic stimulation. C: At very low stimulation frequencies, [Ca2+]i is too low to induce either LTP or LTD. At moderate frequencies (~1 Hz), the increase in [Ca2+]i is sufficient to induce LTD, but not LTP. Further increases in stimulation frequency result in LTP.
This hypothesis is supported by a number of important findings. First, the addition of Ca2+ chelators to the post-synaptic cell prevented the induction of LTP(15,16) and LTD.(17) Second, induction of LTP and LTD was shown to depend on the activation of Ca2+-dependent kinases (CaMKII)(18,19) and phosphatases (Calcineurin),(20,21) respectively. Third, decreasing the influx of Ca2+ through NMDARs with non-saturating concentrations of a NMDAR antagonist induces LTD with an otherwise LTP-inducing stimulation protocol.(22,23) Fourth, increasing extracellular calcium concentration, and thus Ca2+influx, can induce a mild LTP with low-frequency (i.e. LTD-inducing) stimulation,(24) and decreasing extracellular calcium concentration can induce LTD with high-frequency (i.e. LTP-inducing) stimulation.(17) Furthermore, genetic manipulation of the NMDAR subunit composition resulting in an increase in the amount of Ca2+ entering the cell results in LTP induction at lower stimulation frequencies.(25) Fifth, direct manipulation of postsynaptic Ca2+ levels using diffuse photolytic uncaging of chelated Ca2+ is sufficient to induce both LTP and LTD.(16,26–28) Specifically, large (~10 μM), brief (~3 sec) increases in [Ca2+]i reliably induce LTP, whereas a modest (~0.7 μM), long (~60 sec) increases in [Ca2+]i reliably induce LTD.(28)
Spike-timing-dependent plasticity
The temporal order of pre- and postsynaptic activation may also be important for the selective induction of LTP and LTD.(7,29) With the finding that an action potential, or spike, induced by a current injection into the soma, not only travels down the axon but also propagates back through the dendrites,(30) the timing of the presynaptic input (the release of glutamate) and the postsynaptic output (the spike) can be controlled with millisecond precision. A fascinating picture has since emerged. LTP is reliably induced when the presynaptic cell is repeatedly made to fire an action potential shortly before the postsynaptic cell (pre-before-post), and LTD is induced when the order is reversed (post-before-pre; Fig. 2). This finding is robust and has been found in neurons from the hippocampus using acute,(23) organotypic slices,(31) or dissociated cell culture,(32) and in layers V(33,34) and II/III(35) of the cerebral cortex, as well as in vivo preparations using cat(36,37) and Xenopus(38) visual systems. The temporal window permissive for LTP induction is 10–20 ms (milliseconds) whereas the window in which the presynaptic spike can follow the postsynaptic spike in order to induce LTD ranges from 20 to 100 ms in different preparations. This form of synaptic plasticity has been termed STDP. Induction of STDP is dependent on NMDAR and intracellular Ca2+, and partial blockade of NMDARs can induce LTD with a positively correlated pairing protocol.(23) In fact, pairings of pre-before-post result in a superlinear increase in [Ca2+]i(39–43) and post-before-pre pairings result in a sublinear increase in [Ca2+]i.(41) Thus, although the exact mechanisms remain unknown, it is likely that this form of synaptic plasticity shares many properties with the traditional, frequency-dependent forms of LTP and LTD.
Figure 2.

Selective induction of LTP and LTD depends on the order of pre- and postsynaptic pairing. A: Somatic current injections induced action potentials that resulted in EPSPs in synaptically coupled pyramidal cells. When current injections to two cells were presented 10 ms apart, the action potential preceded the EPSP by ~10 ms in one cell (post-before-pre, top trace), and followed the EPSP by ~10 ms in the other (pre-before-post spiking, bottom trace). B: Repeated pre-before-post (□) and post-before-pre correlated (■) spiking, resulted in LTP and LTD, respectively, when the pairing interval was 10 ms. Repeated paring at 100 ms did not result in any change in synaptic weight with pre-before-post (○) or post-before-pre (●) spiking. Reprinted with permission from Markram H, Lubke J, Frotscher M and Sakmann B. Science 1997;275:213–215. Copyright (1997) American Association for the Advancement of Science.
CA2+ in dendritic spines
The majority of excitatory synapses between neurons in the mammalian brain are made onto dendritic spines, small protrusions from the shaft of the dendrite, whose primary function may be to compartmentalize calcium. In the past decade, important developments in multiphoton imaging(44) and calcium-sensitive fluorescent dyes(45) have allowed researchers to probe the dynamics of intracellular Ca2+ at temporal and spatial resolutions of ~1 ms and ~1 μm, respectively: the spatial resolution of a single spine, and at the temporal resolution of synaptic currents. Together, these have made possible the measurement of Ca2+ influx through either VDCCs during an action potential (Fig. 3A,B) or NMDARs during an EPSP (Fig. 3C). Recent reviews summarize the wealth of information that has been gleaned from these experiments.(46,47) In particular, Svoboda and colleagues(43,48,49) have provided much needed quantitative information about Ca2+ dynamics in dendritic spines. The fundamental assumption underlying these experiments is that the spine can be treated as a single compartment. With this caveat, important principles can be determined using the amplitude and decay of the fluorescent transients elicited with different concentrations of fluorescent indicator, and extrapolating to conditions in the unperturbed spine (i.e. with no exogenous buffer). Under these conditions, about 80% of the Ca2+ ions that enter the cell are rapidly buffered by CBPs. Single, unpaired action potentials or EPSPs result in sharp increases in [Ca2+]i which both peak at ~1 μM. The action-potential-induced increase in [Ca2+]i decays within 20 ms. Although the NMDAR-mediated synaptically evoked increase in [Ca2+]i is broader because of the slow kinetics of the NMDARs (τ ~ 100 ms), the kinetics of Ca2+ extrusion following an EPSP are similar to those following an action potential. Importantly, presentation of the EPSP just before the action potential (i.e. a pre-before-post) results in a large increase in [Ca2+]i which peaked at ~10 μM, and decays at rates similar to the unpaired stimuli.(43)
Figure 3.

Fluorescent measurement of Ca2+ influx in spines and dendrites. A: Neuron filled with fluorescent Ca2+ indicator (left), and magnified view of the region outlined by the box showing an apical spine and its parent dendrite (middle). Right, line scan over the dendrite and spine head. Arrowhead, time when action potential was evoked by stimulation of soma. B: Average of transients in the spine and dendrite aligned with the somatic action potential. C: Sequence of frames (64 ms per frame) showing relative change in fluorescence due to Ca2+ influx through NMDA receptors during synaptic stimulation. A and B adapted from Sabatini BL and Svoboda K. Nature 2000;408:589–593 Copyright (2000) Macmillan Magazines Limited; C adapted from Mainen ZF, Malinow R and Svoboda K. Nature 1999;399:151–155 Copyright (1999) Macmillan Magazines Limited. Note that these data were collected with different concentrations of indicator, an exogenous calcium buffer, which distorts the size and shape of the Ca2+ transient.
Can frequency-dependent plasticity and STDP be reconciled?
LTP and LTD have been reliably induced with pre-before-post and post-before-pre pairings presented at frequencies as low as 0.133 Hz.(35) Although 50–100 pairing sweeps were presented in these experiments, imaging studies suggest that [Ca2+]i returns to resting levels within <100 ms. Thus, although the peak [Ca2+]i amplitudes for pre-before-post and post-before-pre pairing protocols are consistent with the [Ca2+]i levels shown to be necessary for the selective induction of LTP and LTD by uncaging, the time courses of the calcium elevations are 10–100 times too short.(26) Thus, there is an apparent contradiction. Pairing protocols that are NMDAR-dependent and almost certainly Ca2+-dependent are able to selectively induce LTP or LTD, but, according to uncaging experiments, the elevations in intracellular calcium that these protocols induce are too brief to reliably induce either. The overlooked assumption may be the treatment of the spine as a single compartment.
Caged Ca2+ was released using a diffuse light source that can be assumed to have increased intracellular calcium levels in the spine homogeneously.(16,27,28) The spine can therefore be treated as a single compartment with respect to [Ca2+]i under these conditions; ignoring gradients induced by the spatial localization of Ca2+ pumps and exchangers on membrane surfaces. However, the spine cannot be considered a single calcium compartment for normal physiological stimuli. Ca2+ entry, particularly through NMDARs, which are localized on the synaptic face of the spine, will create a concentration gradient across the spine, with high concentrations, as high as hundreds of μM, near the mouth of the channel.(50)
The amount of time [Ca2+]i needs to be elevated to induce either LTP or LTD is a function of the probability of Ca2+ ions encountering and activating sufficient numbers of specific target proteins. For uncaging experiments, this can take a long time given the relatively small number of free Ca2+ ions (see below), particularly if these proteins are neither rapidly diffusing nor homogenously distributed. However, if these proteins are concentrated very near the NMDARs, the probability of their activation can be orders of magnitude greater than if the same number of free Ca2+ ions are uniformly distributed through the spine. Thus, we suggest that the differences in the amount of time Ca2+ levels need to be elevated to induce long-lasting changes in synapse strength following either Ca2+ uncaging or physiological stimuli is due to emergent signaling properties of Ca2+-dependent effector proteins given their spatial relationship with sites of Ca2+ entry into the spine. This hypothesis requires at least two assumptions: first, that Ca2+-dependent signaling molecules are able to respond to micro- or even nanodomain increases in [Ca2+] and, second, that such spatial organization of protein-effectors exist at glutamatergic synapses. Recent evidence, however, suggests that both these assumptions are valid.
Nanodomain activation of CA2+-dependent reactions
The first assumption is strongly supported by recent experiments investigating the initiation of Ca2+-dependent gene transcription. Under physiological conditions, activation of calcium-dependent signal transduction pathways can depend on the mode of entry of Ca2+ into the cell. For example, the calcium-dependent phosphorylation of CREB, which drives the expression of a number of genes that regulate neuronal plasticity and survival,(51) depends specifically on Ca2+ influx through L-type VDCCs.(52) A recent study has shown that this specificity arises because CaM is tethered to the cytoplasmic tail of the channel, where it is activated by Ca2+ ions entering the cell when the channel opens. Activated CaM then binds to an IQ domain near the COOH terminal of the channel, and activates the MAPK pathway that results in CREB phosphorylation.(53) Thus, the L-type channel is not merely a means for increasing overall calcium levels. It also serves as an organizational scaffold on which downstream calcium-dependent effector proteins are optimally positioned to bind Ca2+ ions entering through the pore of the channel. Once activated, CaM binds a different site of the same protein, and the signal transduction cascade is initiated. This elegant example is not unique. Very local Ca2+-dependent signaling has been demonstrated at numerous other sites, including Ca2+ entering through NMDARs.(54,55)
PSD organization
Observed by early microscopists as a thickening of the post-synaptic membrane, the postsynaptic density (PSD) is a dense protein complex extending approximately 40 nm into the cytosol. Both AMPA and NMDA receptors are anchored in the PSD by different signaling and scaffolding proteins. Thus, the proteins of the PSD are the first targets for Ca2+ ions entering the spine through NMDARs. There are 30–100 proteins directly bound to, or associated with, the NMDA receptor, forming a large NMDA receptor complex(56–58) (Fig. 4). A characterization of the proteins comprising the PSD is beyond the scope of this paper, and has been recently reviewed.(59,60) Suffice it to say that many proteins thought essential for the induction and/or expression of both LTP and LTD form part of the PSD complex,(57) including CaMKII,(19,61) protein phosphatase I,(20) calcineurin.(59,60) nNOS(62) and MAPK.(63)
Figure 4.

Functional organization of the postsynaptic density. A: Schematic depiction showing components identified as being associated with the NMDA receptor signaling complex from a recent proteomics study(57) (light blue), together with previously identified scaffolding (dark blue) and signaling (yellow) proteins. B: Anatomical measurement of postsynaptic localization of signaling proteins using quantitative electron microscopy techniques. C: Expression of LTD switches to LTP with increasing stimulation frequency in CA1 synapses of normal mice (○). By contrast, PSD-95 knock-out mice express a robust LTP at all stimulation frequencies (●) A adapted from Sheng M and Lee SH. Nat Neurosci 2000;3:633–635 Copyright (2001) by the Society for Neuroscience. B adapted with permission from Valtschanoff JG and Weinberg RJ. J Neurosci 2001;21:1211–1217 Copyright (2001) by the Society for Neuroscience. C adapted from Migaud M, Charlesworth P, Dempster M, Webster LC, Watabe AM, Makhinson M, He Y, Ramsay MF, Morris RG, Morrison JH, O’Dell TJ and Grant SG. Nature 1998;396:433–439 Copyright (1998) Macmillan Magazines Limited.
In addition to signaling proteins, the PSD also contains scaffolding proteins. One such protein is PSD-95 (also called SAP-90), first isolated by Kennedy and colleagues.(64) Although PSD-95 has no detectable enzymatic activity, it acts as an adaptor molecule through protein–protein interactions mediated through discrete domains; three amino-terminal PDZ domains are followed by an SH3 domain and a guanylate kinase-like domain.(65) The three PDZ domains each have slightly different binding specificities and can interact with a variety of different proteins. Because the first and second PDZ domains bind tightly to the NMDAR,(66,67) PSD-95 therefore serves as a scaffold between the NMDAR and other signaling proteins of the PSD.
Although PSD-95 appears to be involved in the synaptic targeting and clustering of NMDARs,(66,68,69) a mouse lacking functional PSD-95 (a stop codon in the third PDZ domain, leaving the first two intact) showed that NMDA receptors were appropriately clustered in the PSD and generated normal synaptic responses.(70) However, the properties of synaptic plasticity in these mice were unusual. Using standard induction procedures (including both high frequency stimulation trains and pre-before-post pairing), LTP levels were significantly greater than normal. Moreover, low frequency stimulation trains that should have produced LTD resulted instead in LTP (Fig. 4C).
How do these data fit with the hypothesis that intracellular calcium levels selectively induce LTP and LTD? Note that PSD-95 does not affect NMDA receptor currents, so the calcium levels in mutant and wild-type mice were presumably similar. Perhaps disruption of the NMDA receptor complex by knocking out PSD-95 displaced a low-affinity Ca2+-dependent signaling protein responsible for the induction of LTD away from the site of Ca2+ entry (the NMDAR), preventing the induction of LTD. A model for the bidirectional control of synaptic strength involves competing actions of kinase (LTP) and phosphatase (LTD) activity.(71,72) Thus a decrease in phosphatase activity could explain both the lack of LTD and the enhanced LTP seen in these mice.
These apparent inconsistencies suggest that identifying and characterizing the participating cellular effectors is only the first step in achieving a full understanding of the steps underlying the induction of LTP and LTD,(73) and intracellular signal processing in general. At least equally important is the task of understanding how these proteins are organized in the postsynaptic membrane to produce normal synaptic function. This will require analysis of the spatial dependence and, importantly, the interdependence, of the appropriate signaling proteins.
Novel approaches using computer modeling
Biophysically realistic computer simulations offer a powerful tool with which to explore cellular signaling at fine spatial and temporal scales. The simplest approach to modeling synaptic signaling involves solving a set of differential equations for a single, well-mixed compartment. This method has been successfully used in fields like physical chemistry and traditional biochemistry, where the well-mixed approximation is satisfied. Unfortunately, these models ignore the structural detail of the synapse, and often fall short of providing a satisfying, biologically accurate explanation of the phenomena being modeled.
To include spatial information, two different approaches to kinetic modeling have been proposed. The “finite element” approach (FE) divides three-dimensional space into a regular grid of contiguous subcompartments, or voxels. It assumes well-mixed conditions within each voxel, and uses differential equations to compute fluxes between, and reactions within each voxel. This approach is well suited to large, simple volumes with large numbers of a few types of molecules, such as a test-tube. Complex cellular structures, however, require the grid be very fine and irregular in shape, making this approach both computationally expensive and difficult to program. Furthermore, as voxel size decreases, the product of the voxel volume and reactant concentration can yield fractional numbers of molecules, and multiple reaction partners and complex signaling pathways increase the dimensionality of the differential equations, further increasing the computational load.
Although mass-action equations still predict correct average concentrations, the discrete and stochastic nature of signaling, which becomes important when the number of molecules is small, is ignored using the FE approach. This is especially true for calcium-dependent signaling. For example, a 50 nm resting [Ca2+]i in a dendritic spine (0.1 μm3) entails an average of only three free Ca2+ ions. Similarly, a [Ca2+]i of 1 μM, a high level at which calcium is able to induce biochemical changes in the spine, still only corresponds to ~60 free Ca2+ ions. If a spine, modeled as a cube, 0.5 μm on a side, were coarsely divided into a 10 × 10 × 10 grid, the average number of Ca2+ ions in each voxel, would be 0.06, an un-physical number. Thus, the FE method will fail to accurately describe the biochemistry of synaptic signaling because these methods only provide averaged data, ignoring the stochastic nature of signaling, and because a biophysically realistic simulation, complete with an accurate three-dimensional structure of the system, is likely to be too difficult to program and too computationally expensive.
The other approach uses Monte Carlo methods, where random numbers and probabilities are used to simulate individual cases of the system’s behavior (see Box 1). MCell is a highly optimized Monte Carlo simulation program that can be used to address complex biological problems (http://www.mcell.cnl.salk.edu).(74,75) Unlike FE, diffusion of individual ligand molecules are simulated using a Brownian dynamics random walk algorithm, and bulk solution rate constants are converted into Monte Carlo probabilities so that the diffusing ligands can undergo stochastic chemical interactions with individual binding sites such as receptor proteins, enzymes, transporters, etc (see Box 2).
BOX 1. MONTE CARLO METHODS.
Monte Carlo methods provide approximate solutions to a variety of mathematical problems by performing statistical sampling experiments. Although there exist a number of undeveloped earlier instances of their use, systematic development of Monte Carlo methods date from the use of random sampling to simulate the flight paths of neutrons by Stanislaw Ulam and John Von Neumann during the Manhatten Project. Because of the similarity of statistical simulation to games of chance, Nicholas Metropolis, a colleague of Ulam and Von Neumann at Los Alamos, coined the term after the capital of the principality of Monaco, famous for its casinos.
Monte Carlo methods are based on the concept that any part of a function to be integrated over may be thought of as a normalized probability distribution over the region of integration. A simple illustrative example is a geometric Monte Carlo experiment that calculates π using a “hit or miss integration”. Consider a circle with radius r circumscribed by a square (Fig. A1). Note that because of its geometrical symmetry, the problem can be equivalently considered in terms of a single quadrant (Fig. A2).

Given that
and
then
Now, imagine randomly throwing a large number darts at Fig A2. The essence of the Monte Carlo method is that, as the number of darts increases, the fraction of darts within the quadrant (red shaded area), scaled by 4, will approach the value of π. Implementation of this experiment on a computer is extremely simple, but needs a good random number generator that generates numbers from 0 to 1 from a uniform distribution. Thus, a simple code to perform this experiment might look like:
r = 1
total_throws =
large_number
throw_number = 0
hits = 0
while throw_number ≤ total_throws {
x = (random_number)
y = (random_number)
if distance ≤ 1 {
hits = hits + 1
}
throw_number = throw_number + 1
}
π = 4 * hits/total_throws
Note that the accuracy of this approximation depends on the number of random trials. It can be proven that the estimate converges to the correct value of π as the number of trials increases to infinity.
BOX 2. RANDOM-WALK DIFFUSION AND STOCHASTICITY IN MCELL.
By filling cells with fluorescein dextran and using two-photon scanning laser microscopy, Svoboda and colleagues were able to image and photobleach dendritic spines on pyramidal neurons from hippocampal slices. The time-course of the recovery from of spine fluorescence provided a direct measure of the diffusional coupling between the spine and its parent dendrite.(89) We have simulated this experiment using MCell to demonstrate random-walk diffusion and the inherent stochasticity of the program. We separated two sets of spheres (white and red) into the spine and parent dendrite, respectively, and then allowed the spheres to diffuse freely between the two structures, which were connected by a narrow spine neck. Although individual trials were noisy, the averaged result was indistinguishable from an exponential decay function, as expected. These simulations demonstrate the dependence on the diffusional coupling rate on the diameter and length of the spine neck (see also Svoboda et al., 1996, Ref 89, Majewska et al., 2000 Ref. 90).

Comparison of recovery from photobleaching in a spine with a Monte Carlo simulation. (A) Fluorescent image of a CA1 pyramidal cell dendrite filled with fluorescein dextran. (B) Schematic depicting experimental protocol. Thin line, locations of fluorescence measurement; thick line, location of photobleaching. Dashed line in (A) corresponds to imaging and bleaching lines in (B). (C) Time course of fluorescence in the spine before and after photobleaching (average of 7 scans). (D) Images and (E) time course of red sphere concentration in the spine from MCell simulations. Individual panels in (D) correspond to times indicated by arrows in (E). Gray trace shows a single trial; black trace, average of 50 trials; red trace, exponential fit to average with τ = 56 ms. Dependence of τ on spine neck (F) diameter and (G) length. A–C adapted with permission from Svoboda K, Tank DW and Denk W. Science 1996;272:716–719. Copyright (1996) American Association for the Advancement of Science.
The development of MCell started as a project in the laboratory of the late Miriam Salpeter at Cornell University to accurately simulate activation of postsynaptic receptors at the neuromuscular junction.(76–78) More recently, these algorithms have also been used to study synaptic activation at central synapses.(79–81) We have used MCell to simulate intracellular Ca2+ dynamics in dendritic spines, with a long-term goal of understanding the critical time-window underlying STDP. This will require implementation in a structure with realistic geometry, knowledge of the number and location of all the critical proteins, the dynamics of Ca2+ at single synapses, and their interactions. This is an on-going project requiring extensive collaboration between groups with widely different sets of expertise. The first stage of this task, the simulation of Ca2+ dynamics in an idealized dendritic spine, and its interaction with a small number of CBPs, is summarized here. The model involves Ca2+ influx, Ca2+ efflux, intracellular buffering and the activation of intracellular CaM. Ca2+ can enter the spine through VDCCs during an action potential or through NMDARs following glutamate release. Once inside the spine, Ca2+ is extruded via pumps on the spine apparatus, an extension of the dendritic endoplasmic reticulum, and pumps and exchangers on the cell membrane, and CBPs, distributed throughout the cytoplasm, bind and buffer [Ca2+]i. In addition to quantitative simulation of complex signal transduction cascades, this type of model can also serve another, extremely powerful function; because the spatial location of each molecule is tracked, the simulated intracellular environment can be graphically rendered, providing a conceptual view of the structure and dynamics of the system. To illustrate this, we have modeled and visualized Ca2+ influx following either an action potential or EPSP.
Action potential-induced CA2+ influx
In a simulation of an action potential evoked by somatic current injection using the NEURON(82) simulation environment, the action potential propagated back through the dendrites to the spine resulting in a brief depolarization (Fig. 5A). Spines typically contained four or five VDCCs, which open with a probability of ~0.5 at the peak of the action potential. The voltage time course at the spine was used as input to MCell. On this trial, the spine had three VDCCs, two of which opened briefly at the peak of the action potential (Fig. 5B), resulting in a large Ca2+ influx. Inside the cytoplasm, Ca2+ could be extruded via membrane pumps, or buffered by binding endogenous CBPs (200 μM; KD, 2 μM; Kfor, 107–9 M−1s−1) or exogenous, high-affinity fluorescent Ca2+indicator (100 μM; KD, 233 nM; Kfor, 0.6 × 10⁹ M−1s−1). The amount of bound indicator, normalized by resting levels (ΔF/F) could be measured and compared to experimental results to test and constrain the model (Fig. 5C; compare with Fig. 3B). Importantly, the model also allows direct measurement of free Ca2+ levels. Here, we show [Ca2+]i in the presence of indicator (Fig. 5D). These data are similar to experimental measures, although [Ca2+]i in the model had a very large, rapidly decaying component not predicted by the fluorescent signal.
Figure 5.
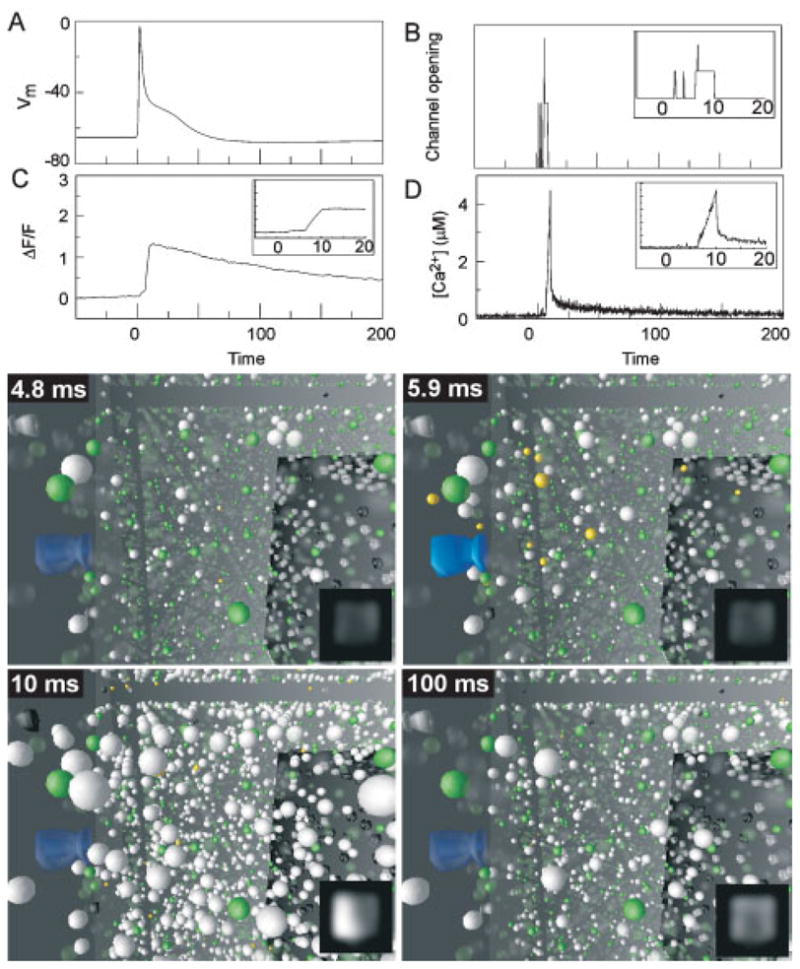
Simulation and visualization of post-synaptic Ca2+ dynamics after an action potential at t = 0. A:Membrane voltagein thespine. B:Stochastic opening of VDCCs on the spine membrane. C: Change in ΔF/F with the spine measured as a single compartment. Inset shows ΔF/F steadily increasing while channel is open, then decaying slowly. Ordinate, same scale as main panel. D: Intracellular [Ca2+], defined by dividing the total number of free Ca2+ ions in the entire spine by its volume. Insets show [Ca2+]i steadily increasing while channel is open, then falling rapidly when channel closes. Ordinate, same scale as main panel. Panels show visualized model output at 4 times after the somatic current injection. Insets shows the simulated output expected from a fluorescence imaging experiment.
This large Ca2+ spike was due to local saturation of buffer in the cytoplasm surrounding open VDCCs, which can be better understood by visualizing the model output; shown here as four snapshots at 4.8 ms, 5.9 ms, 10 ms and 100 ms after the somatic current injection. For each of these panels, the observer is inside the spine. A closed VDCC (translucent, blue structure) is seen protruding through the cell membrane on the right, and the spine apparatus, an extension of dendritic smooth endoplasmic reticulum, seen as a darkened, cubic structure to the left. Exogenous indicator molecules (green) and endogenous CBPs (white) are depicted as spheres distributed throughout the cytoplasm, and may be either Ca2+-bound (opaque) or Ca2+-free (translucent). For comparison with imaging experiments, the spine volume was also divided into voxels 25 nm on a side, in which the number of bound and unbound indicator molecules inside each voxel were counted and converted to a gray-scale value. Each voxel was then blurred to 250 nm resolution, and rendered as a simulated fluorescent image.
At rest, a small fraction of the indicator and CBPs were bound (4.8 ms). When the channel opened (opaque blue structure), Ca2+ ions (small yellow spheres) entered the spine, and were rapidly bound by indicator or CBPs close to the mouth of the channel. Immediately after entering the cell, Ca2+ remained free, thus increasing [Ca2+]i but not depicted as an increase in ΔF/F until a significant number of indicator molecules were bound (5.9 ms). Ca2+ ions continued to enter through the open channel, describing an ever-larger volume of buffer saturation about the mouth of the channel, thus increasing the volume in which Ca2+ remains free and leading to the large amplitude of the [Ca2+]i spike. When the VDCC closed, [Ca2+]i dropped precipitously as free Ca2+ rapidly diffused out of the volume of saturated buffer around the channel mouth. By this time, a significant amount of indicator around the channel was bound, resulting in a measurable fluorescent signal. After 100 ms [Ca2+]i had returned to resting levels as Ca2+ ions had either been extruded or buffered. However, a significant fraction of the high-affinity indicator was still Ca2+-bound, yielding the slowly decaying ΔF/F signal.
EPSP-induced Ca2+ influx
We next examined intracellular Ca2+ dynamics evoked by synaptic stimulation. Imaging experiments suggest that Ca2+ influx through NMDARs results in Ca2+ transients with similar amplitudes and slower kinetics, as compared with Ca2+ transients evoked by action potentials. Vesicular release of glutamate resulted in an average of 3 of 20 NMDARs opening at peak, and closed with a decay time constant of ~100 ms;(81) however most of the receptors were unable to conduct because of the Mg2+ block. The small voltage deflection associated with a single, subthreshold EPSP (Fig. 6A) resulted in a small increase fraction of unblocked receptors, although NMDARs continued to rapidly flicker open (mean open-time, ~ 100 μs) with low probability at resting potentials, as long as the receptors were bound (Fig. 6B). Note that these data only provide information on the number of open receptors at each point in time, but not whether this was due to a single-bound receptor that flickered rapidly between blocked and unblocked states, or a larger number of channels that opened independently at low probability, such that no two channels were open at the same time. When a receptor did open, Ca2+ entered the spine at the synapse, and diffused through the volume until it was extruded or buffered by CBPs or indicator. These brief epochs of Ca2+ influx, which continued for a long period due to the low dissociation rate of the NMDARs, led to efficient binding of Ca2+ by indicator due to its fast kinetics and high affinity (Fig. 6C), but did not result in a large increase in [Ca2+]i (Fig. 6D; c.f. Fig. 5).
Figure 6.

Simulation and visualization of post-synaptic Ca2+ influx after an EPSP evoked by transmitter release at t = 0. A: Membrane voltage in the spine. B: Rapid flickering of transmitter-bound NMDARs blocked and open/unblocked state. Prolonged influx of Ca2+ through spatially distinct receptors results in (C) a large fraction of bound indicator, but (D) low levels of free intracellular calcium. Panels show visualized model output at 4 times after release of transmitter. Insets shows the simulated output expected from a fluorescence imaging experiment.
Again, visualization of this simulation may clarify the difference between the action potential and EPSP-evoked signaling patterns. The observer is still inside the spine, but is now looking up toward the postsynaptic membrane. Closed/single-bound receptors are seen as ghostly, red structures on the spine ceiling. After binding glutamate and changing to their open conformation, the receptors may be in either an open-blocked state (orange) or the conducting, open-unblocked state (red). The top edge of the spine apparatus is seen in the foreground, containing either Ca2+-bound (black) or Ca2+-free (gray) extrusion pumps. The representation of CBPs and indicator is the same as before.
Before any receptors opened (0 ms), [Ca2+]i was at low, resting levels. By 7.4 ms after release, five NMDARs were in the open state, although only one was unblocked (arrowhead). Influx through this receptor resulted in Ca2+ binding to CBPs and indicator near the receptor, before the channel reblocked. A short time later (14.3 ms) another channel was unblocked, allowing Ca2+ to enter a different region of the spine with low levels of buffer saturation. Still later (48.5 ms) a new channel has opened. By this time, a significant fraction of both CBP and indicator were Ca2+-bound, resulting in the high fluorescent signal predicted by the inset and Fig. 6C. Thus, during an action potential, Ca2+ influx occurs through a small number of VDCCs that remained open for several milliseconds resulting in a volume of saturated buffer around the channel. By contrast, Ca2+ entry during an EPSP was distributed in both time and space, resulting in efficient buffering of [Ca2+]i levels.
Our model does not yet allow for the complex signaling pathways, such as those necessary to model release of Ca2+ from intracellular stores. Although Emptage and colleagues report that NMDAR-mediated release of Ca2+ from stores underlies most of the Ca2+ signal following single, subthreshold EPSPs,(83) this result has not been reproduced.(38,43,84) Moreover, our simulations, which quantitatively match Ca2+ signaling profiles following an action potential, are able to account fully for the magnitude of the fluorescent Ca2+ signal during an EPSP using conservative estimates of NMDAR numbers and single-channel Ca2+ conductances, therefore suggesting that direct Ca2+ influx through NMDARs is sufficient to account for the observed increase in intracellular Ca2+.
Simulated neurochemistry
This preliminary work shows the important, but often overlooked, point that Ca2+ influx does not necessarily translate to [Ca2+]i in a simple and obvious manner. Instead, [Ca2+]i is an instantaneous cellular state determined by the concerted actions of Ca2+ influx, efflux and buffering. Indeed, STDP is probably not formally different from frequency-dependent selective induction of LTP and LTD. Instead, we suggest these be viewed as orthogonal dimensions of a multidimensional parameter space. For example, LTP induction by pre-before-post correlated pairing depends on the frequency of pairing.(33,34) Similarly, the increase in [Ca2+]i in cerebellar Purkinje neurons following a train of action potentials is highly non-linear, with small increases in [Ca2+]i resulting from initial spikes but very large increases in [Ca2+]i towards the end of the train.(85) The authors show that the amount of Ca2+ influx following each spike is constant, and that the difference in [Ca2+]i is due to saturation of the buffering capacity. In a separate set of simulations, we have shown how the both [Ca2+]i and the activation of downstream Ca2+-dependent proteins (CaM) are dependent on the complex interplay of the different processes regulating intracellular Ca2+ dynamics.(86)
Subthreshold EPSPs were presented 10 ms before somatic current injections to simulate Ca2+ dynamics under conditions that have been shown to produce a robust LTP. Five pairings at frequencies ≤5 Hz resulted in a large Ca2+ influx, but the Ca2+ was rapidly buffered by CBPs with different kinetics (Fig. 7A), The 200 ms interval between pairings was sufficiently long for most of Ca2+ to dissociate from the CBPs and be extruded from the cell before the arrival of the next pairing. This reloading of buffer prevented non-linear summation of [Ca2+]i (Fig. 7B) or activated, quaternary-bound CaM (CaM-4; Fig. 7C) in the spine. Although the amount of Ca2+ entering the cell was the same, at frequencies ≥10 Hz, CBPs were unable to offload Ca2+ ions bound from previous pairings, resulting in a saturation of the buffering capacity (Fig. 7D), such that increasing fractions of the Ca2+ entering the cell on subsequent pairings would be unbuffered. This leads to highly cooperative increases in both [Ca2+]i (Fig. 7E) and CaM-4 (Fig. 7F). In general, CaM activation did not summate with pairings at frequencies up to 5 Hz, but increased non-linearly as pairing frequencies increased (Fig. 7G). Interestingly, 10 Hz is the lowest pairing frequency at which a small number of positively correlated pairings will reliably induce LTP.(33,34) If the frequency at which pairing becomes cooperative is due to saturation of the buffering capacity of the spine, then changing total buffering capacity should modulate this frequency dependence. Indeed, halving and doubling the CBP concentration resulted in increased and decreased frequency-dependence and CaM-4 levels, respectively. Again, very different intracellular [Ca2+]i profiles were induced without changing the amount of Ca2+ that entered the spine. Note that Sjöström and colleagues were able to induce LTP with low frequency pairing when the soma was mildly depolarized.(34) Although the chemical consequences at the synapse remain unknown, it is tempting to imagine that this depolarization leads to calcium spikes in dendritic branchlets,(87,88) such that the frequency-dependence of CaM activation is dramatically altered by an additional mode of Ca2+ entry.
Figure 7.

[Ca2+]i and CaM activation depend on pairing frequency. (A,D) Percentage of different CBPs bound during 5 Hz and 10 Hz pairings, respectively. (B,E) Spine [Ca2+]i during 5 Hz and 10 Hz pairings, respectively, and (C,F) levels of CaM-4, respectively. Note that pairing at 10 Hz, but not 5 Hz, results in strong cooperativity from pairing-to-pairing. (G) Summary of the pairing frequency-dependence of CaM-4 with CBP concentrations (○, 200 μM; ◆, 100 μM; ▲, 400 μM). Adapted from Franks KM, Bartol TM, Jr. and Sejnowski TJ. Neurocomput 2001;38–40:9–16, with permission from Elsevier Science.
Future direction
Clearly, this model does yet not explain the differences between the intracellular Ca2+ dynamics required for the induction of LTP and LTD, or the critical time-window of STDP. However, as illustrated above, these questions can only be answered using computational methods if the model incorporates the spatial, temporal and stochastic nature of intracellular signaling. Numerous studies have shown that Ca2+-dependent reactions can sample Ca2+ in very local signaling domains, and recent ultrastructural and biochemical studies have shown exquisite spatial organization of signaling machinery at the synapse. It seems absurd to imagine that this organization is not critical in determining the dynamics and products of intracellular signaling transduction cascades. It is therefore equally absurd to imagine being able to really understand these important processes with an oversimplified model. We are therefore in the process of developing a model of a glutamatergic synapse of unprecedented biological detail and realism. Ultimately, this model will be implemented in a structure determined by three-dimensional serial reconstruction of electron tomographs of CA1 neuropil and will incorporate accurate estimates of the number, location and kinetic properties of all the appropriate synaptic signaling molecules. The completion of this project will require many years and active collaboration between different laboratories, and great effort. However, we contend that the answer to these, and many other outstanding biological questions, lie in the details, and it is therefore only by asking questions of sufficient detail, and by examining systems of sufficient complexity, that many of these answers can be found.
Conclusions
The Monte Carlo approach to modeling synapses presented here is still in its infancy. One of the important lessons that it has already taught us is the importance of knowing where Ca2+ enters the spine and its impact on the local microenvironment. This view contrasts with the impression from Ca2+ imaging experiments, of a well-mixed, homogenous milieu. Detailed simulations with MCell should allow us to refine our understanding of how Ca2+ interacts with elements of the PSD, and other subcellular compartments whose spatial organization appears to be crucial for the precise biochemical signaling required to achieve long-lasting changes in synaptic efficacy. In particular, we need to know more about the properties and locations of the calcium-binding proteins that regulate [Ca2+]i throughout the spine volume. No single discipline or set of techniques will be sufficient to provide a full understanding of the complexities of biological signaling. Instead, we expect that this will only be achieved with an open and active dialogue between disciplines; biophysically realistic simulations can provide a framework for building bridges between these disciplines and testing multidisciplinary hypotheses.
Abbreviations
- AMPA
α-amino-3-hydroxy-5-methyl-isoxazolepropionic acid
- [Ca2+]i
free intracellular Ca2+ concentration
- CaM
calmodulin CaMKII, Ca2+/CaM-dependent protein kinase II
- CBPs
intracelluar Ca2+ -binding proteins
- CREB
cAMP response element binding protein
- ΔF/F
normalized increase in fluorescence
- EPSC
excitatory postsynaptic current
- EPSP
excitatory postsynaptic potential
- LTD
long-term depression
- LTP
long-term potentiation
- MAPK
mitogen-activated protein kinase
- NMDA
N-methyl-D-aspartate
- nNOS
neural nitric oxide synthase
- PSD
postsynaptic density
- STDP
spike-timing dependent plasticity
- VDCCs
voltage-dependent Ca2+ channels
References
- 1.Churchland PS, Sejnowski TJ. The computational brain. Cambridge, Mass: MIT Press; 1992. [Google Scholar]
- 2.Bliss TV, Collingridge GL. A synaptic model of memory:long-term potentiation in the hippocampus. Nature. 1993;361:31–39. doi: 10.1038/361031a0. [DOI] [PubMed] [Google Scholar]
- 3.Bliss TV, Lomo T. Long-lasting potentiation of synaptic transmission in the dentate area of the anaesthetized rabbit following stimulation of the perforant path. J Physiol (Lond) 1973;232:331–356. doi: 10.1113/jphysiol.1973.sp010273. [DOI] [PMC free article] [PubMed] [Google Scholar]
- 4.Sejnowski TJ. Statistical constraints on synaptic plasticity. J Theor Biol. 1977;69:385–389. doi: 10.1016/0022-5193(77)90146-1. [DOI] [PubMed] [Google Scholar]
- 5.Bienenstock EL, Cooper LN, Munro PW. Theory for the development of neuron selectivity:orientation specificity and binocular interaction in visual cortex. J Neurosci. 1982;2:32–48. doi: 10.1523/JNEUROSCI.02-01-00032.1982. [DOI] [PMC free article] [PubMed] [Google Scholar]
- 6.Dunwiddie T, Lynch G. Long-term potentiation and depression of synaptic responses in the rat hippocampus:localization and frequency dependency. J Physiol. 1978;276:353–367. doi: 10.1113/jphysiol.1978.sp012239. [DOI] [PMC free article] [PubMed] [Google Scholar]
- 7.Levy WB, Steward O. Temporal contiguity requirements for long-term associative potentiation/depression in the hippocampus. Neuroscience. 1983;8:791–797. doi: 10.1016/0306-4522(83)90010-6. [DOI] [PubMed] [Google Scholar]
- 8.Dudek SM, Bear MF. Homosynaptic long-term depression in area CA1 of hippocampus and effects of N-methyl-D-aspartate receptor blockade. Proc Natl Acad Sci USA. 1992;89:4363–4367. doi: 10.1073/pnas.89.10.4363. [DOI] [PMC free article] [PubMed] [Google Scholar]
- 9.Malenka RC, Nicoll RA. Long-term potentiation—a decade of progress? Science. 1999;285:1870–1874. doi: 10.1126/science.285.5435.1870. [DOI] [PubMed] [Google Scholar]
- 10.Bekkers JM, Stevens CF. NMDA and non-NMDA receptors are co-localized at individual excitatory synapses in cultured rat hippocampus. Nature. 1989;341:230–233. doi: 10.1038/341230a0. [DOI] [PubMed] [Google Scholar]
- 11.Isaac JT, Nicoll RA, Malenka RC. Evidence for silent synapses: implications for the expression of LTP. Neuron. 1995;15:427–434. doi: 10.1016/0896-6273(95)90046-2. [DOI] [PubMed] [Google Scholar]
- 12.Takumi Y, Ramirez-Leon V, Laake P, Rinvik E, Ottersen OP. Different modes of expression of AMPA and NMDA receptors in hippocampal synapses. Nat Neurosci. 1999;2:618–624. doi: 10.1038/10172. [DOI] [PubMed] [Google Scholar]
- 13.Artola A, Singer W. Long-term depression of excitatory synaptic transmission and its relationship to long-term potentiation. Trends Neurosci. 1993;16:480–487. doi: 10.1016/0166-2236(93)90081-v. [DOI] [PubMed] [Google Scholar]
- 14.Lisman J. The CaM kinase II hypothesis for the storage of synaptic memory. Trends Neurosci. 1994;17:406–412. doi: 10.1016/0166-2236(94)90014-0. [DOI] [PubMed] [Google Scholar]
- 15.Lynch G, Larson J, Kelso S, Barrionuevo G, Schottler F. Intracellular injections of EGTA block induction of hippocampal long-term potentiation. Nature. 1983;305:719–721. doi: 10.1038/305719a0. [DOI] [PubMed] [Google Scholar]
- 16.Malenka RC, Kauer JA, Zucker RS, Nicoll RA. Postsynaptic calcium is sufficient for potentiation of hippocampal synaptic transmission. Science. 1988;242:81–84. doi: 10.1126/science.2845577. [DOI] [PubMed] [Google Scholar]
- 17.Mulkey RM, Malenka RC. Mechanisms underlying induction of homosynaptic long-term depression in area CA1 of the hippocampus. Neuron. 1992;9:967–975. doi: 10.1016/0896-6273(92)90248-c. [DOI] [PubMed] [Google Scholar]
- 18.Malinow R, Schulman H, Tsien RW. Inhibition of postsynaptic PKC or CaMKII blocks induction but not expression of LTP. Science. 1989;245:862–866. doi: 10.1126/science.2549638. [DOI] [PubMed] [Google Scholar]
- 19.Silva AJ, Wang Y, Paylor R, Wehner JM, Stevens CF, Tonegawa S. Alpha calcium/calmodulin kinase II mutant mice:deficient long-term potentiation and impaired spatial learning. Cold Spring Harb Symp Quant Biol. 1992;57:527–539. doi: 10.1101/sqb.1992.057.01.058. [DOI] [PubMed] [Google Scholar]
- 20.Mulkey RM, Herron CE, Malenka RC. An essential role for protein phosphatases in hippocampal long-term depression. Science. 1993;261:1051–1055. doi: 10.1126/science.8394601. [DOI] [PubMed] [Google Scholar]
- 21.Mulkey RM, Endo S, Shenolikar S, Malenka RC. Involvement of a calcineurin/inhibitor-1 phosphatase cascade in hippocampal long-term depression. Nature. 1994;369:486–488. doi: 10.1038/369486a0. [DOI] [PubMed] [Google Scholar]
- 22.Cummings JA, Mulkey RM, Nicoll RA, Malenka RC. Ca2+ signaling requirements for long-term depression in the hippocampus. Neuron. 1996;16:825–833. doi: 10.1016/s0896-6273(00)80102-6. [DOI] [PubMed] [Google Scholar]
- 23.Nishiyama M, Hong K, Mikoshiba K, Poo MM, Kato K. Calcium stores regulate the polarity and input specificity of synaptic modification. Nature. 2000;408:584–588. doi: 10.1038/35046067. [DOI] [PubMed] [Google Scholar]
- 24.Christie BR, Schexnayder LK, Johnston D. Contribution of voltage-gated Ca2+ channels to homosynaptic long-term depression in the CA1 region in vitro. J Neurophysiol. 1997;77:1651–1655. doi: 10.1152/jn.1997.77.3.1651. [DOI] [PubMed] [Google Scholar]
- 25.Tang YP, Shimizu E, Dube GR, Rampon C, Kerchner GA, Zhuo M, Liu G, Tsien JZ. Genetic enhancement of learning and memory in mice. Nature. 1999;401:63–69. doi: 10.1038/43432. [DOI] [PubMed] [Google Scholar]
- 26.Malenka RC, Lancaster B, Zucker RS. Temporal limits on the rise in postsynaptic calcium required for the induction of long-term potentiation. Neuron. 1992;9:121–128. doi: 10.1016/0896-6273(92)90227-5. [DOI] [PubMed] [Google Scholar]
- 27.Neveu D, Zucker RS. Postsynaptic levels of [Ca2+]i needed to trigger LTD and LTP. Neuron. 1996;16:619–629. doi: 10.1016/s0896-6273(00)80081-1. [DOI] [PubMed] [Google Scholar]
- 28.Yang SN, Tang YG, Zucker RS. Selective induction of LTP and LTD by postsynaptic [Ca2+]i elevation. J Neurophysiol. 1999;81:781–787. doi: 10.1152/jn.1999.81.2.781. [DOI] [PubMed] [Google Scholar]
- 29.Wigstrom H, Gustafsson B, Huang YY, Abraham WC. Hippocampal long-term potentiation is induced by pairing single afferent volleys with intracellularly injected depolarizing current pulses. Acta Physiol Scand. 1986;126:317–319. doi: 10.1111/j.1748-1716.1986.tb07822.x. [DOI] [PubMed] [Google Scholar]
- 30.Stuart GJ, Sakmann B. Active propagation of somatic action potentials into neocortical pyramidal cell dendrites. Nature. 1994;367:69–72. doi: 10.1038/367069a0. [DOI] [PubMed] [Google Scholar]
- 31.Debanne D, Gahwiler BH, Thompson SM. Long-term synaptic plasticity between pairs of individual CA3 pyramidal cells in rat hippocampal slice cultures. J Physiol. 1998;507(Pt 1):237–247. doi: 10.1111/j.1469-7793.1998.237bu.x. [DOI] [PMC free article] [PubMed] [Google Scholar]
- 32.Bi GQ, Poo MM. Synaptic modifications in cultured hippocampal neurons:dependence on spike timing, synaptic strength, and postsynaptic cell type. J Neurosci. 1998;18:10464–10472. doi: 10.1523/JNEUROSCI.18-24-10464.1998. [DOI] [PMC free article] [PubMed] [Google Scholar]
- 33.Markram H, Lubke J, Frotscher M, Sakmann B. Regulation of synaptic efficacy by coincidence of postsynaptic APs and EPSPs. Science. 1997;275:213–215. doi: 10.1126/science.275.5297.213. [DOI] [PubMed] [Google Scholar]
- 34.Sjostrom PJ, Turrigiano GG, Nelson SB. Rate, timing, and cooperativity jointly determine cortical synaptic plasticity. Neuron. 2001;32:1149–1164. doi: 10.1016/s0896-6273(01)00542-6. [DOI] [PubMed] [Google Scholar]
- 35.Feldman DE. Timing-based LTP and LTD at vertical inputs to layer II/III pyramidal cells in rat barrel cortex. Neuron. 2000;27:45–56. doi: 10.1016/s0896-6273(00)00008-8. [DOI] [PubMed] [Google Scholar]
- 36.Schuett S, Bonhoeffer T, Hubener M. Pairing-induced changes of orientation maps in cat visual cortex. Neuron. 2001;32:325–337. doi: 10.1016/s0896-6273(01)00472-x. [DOI] [PubMed] [Google Scholar]
- 37.Yao H, Dan Y. Stimulus timing-dependent plasticity in cortical processing of orientation. Neuron. 2001;32:315–323. doi: 10.1016/s0896-6273(01)00460-3. [DOI] [PubMed] [Google Scholar]
- 38.Zhang LI, Tao HW, Holt CE, Harris WA, Poo M. A critical window for cooperation and competition among developing retinotectal synapses. Nature. 1998;395:37–44. doi: 10.1038/25665. [DOI] [PubMed] [Google Scholar]
- 39.Yuste R, Denk W. Dendritic spines as basic functional units of neuronal integration. Nature. 1995;375:682–684. doi: 10.1038/375682a0. [DOI] [PubMed] [Google Scholar]
- 40.Magee JC, Johnston D. A synaptically controlled, associative signal for Hebbian plasticity in hippocampal neurons. Science. 1997;275:209–213. doi: 10.1126/science.275.5297.209. [DOI] [PubMed] [Google Scholar]
- 41.Koester HJ, Sakmann B. Calcium dynamics in single spines during coincident pre- and postsynaptic activity depend on relative timing of back-propagating action potentials and subthreshold excitatory post-synaptic potentials. Proc Natl Acad Sci USA. 1998;95:9596–9601. doi: 10.1073/pnas.95.16.9596. [DOI] [PMC free article] [PubMed] [Google Scholar]
- 42.Yuste R, Majewska A, Cash SS, Denk W. Mechanisms of calcium influx into hippocampal spines:heterogeneity among spines, coincidence detection by NMDA receptors, and optical quantal analysis. J Neurosci. 1999;19:1976–1987. doi: 10.1523/JNEUROSCI.19-06-01976.1999. [DOI] [PMC free article] [PubMed] [Google Scholar]
- 43.Sabatini BL, Oertner TG, Svoboda K. The life cycle of Ca2+ ions in dendritic spines. Neuron. 2002;33:439–452. doi: 10.1016/s0896-6273(02)00573-1. [DOI] [PubMed] [Google Scholar]
- 44.Denk W, Yuste R, Svoboda K, Tank DW. Imaging calcium dynamics in dendritic spines. Curr Opin Neurobiol. 1996;6:372–378. doi: 10.1016/s0959-4388(96)80122-x. [DOI] [PubMed] [Google Scholar]
- 45.Zacharias DA, Baird GS, Tsien RY. Recent advances in technology for measuring and manipulating cell signals. Curr Opin Neurobiol. 2000;10:416–421. doi: 10.1016/s0959-4388(00)00101-x. [DOI] [PubMed] [Google Scholar]
- 46.Yuste R, Majewska A, Holthoff K. From form to function:calcium compartmentalization in dendritic spines. Nat Neurosci. 2000;3:653–659. doi: 10.1038/76609. [DOI] [PubMed] [Google Scholar]
- 47.Nimchinsky EA, Sabatini BL, Svoboda K. Structure and function of dendritic spines. Annu Rev Physiol. 2002;64:313–353. doi: 10.1146/annurev.physiol.64.081501.160008. [DOI] [PubMed] [Google Scholar]
- 48.Mainen ZF, Malinow R, Svoboda K. Synaptic calcium transients in single spines indicate that NMDA receptors are not saturated. Nature. 1999;399:151–155. doi: 10.1038/20187. [DOI] [PubMed] [Google Scholar]
- 49.Sabatini BL, Svoboda K. Analysis of calcium channels in single spines using optical fluctuation analysis. Nature. 2000;408:589–593. doi: 10.1038/35046076. [DOI] [PubMed] [Google Scholar]
- 50.Llinas R, Sugimori M, Silver RB. Microdomains of high calcium concentration in a presynaptic terminal. Science. 1992;256:677–679. doi: 10.1126/science.1350109. [DOI] [PubMed] [Google Scholar]
- 51.Shaywitz AJ, Greenberg ME. CREB:a stimulus-induced transcription factor activated by a diverse array of extracellular signals. Annu Rev Biochem. 1999;68:821–861. doi: 10.1146/annurev.biochem.68.1.821. [DOI] [PubMed] [Google Scholar]
- 52.Deisseroth K, Bito H, Tsien RW. Signaling from synapse to nucleus: postsynaptic CREB phosphorylation during multiple forms of hippocampal synaptic plasticity. Neuron. 1996;16:89–101. doi: 10.1016/s0896-6273(00)80026-4. [DOI] [PubMed] [Google Scholar]
- 53.Dolmetsch RE, Pajvani U, Fife K, Spotts JM, Greenberg ME. Signaling to the nucleus by an L-type calcium channel-calmodulin complex through the MAP kinase pathway. Science. 2001;294:333–339. doi: 10.1126/science.1063395. [DOI] [PubMed] [Google Scholar]
- 54.Hardingham GE, Arnold FJ, Bading H. A calcium microdomain near NMDA receptors:on switch for ERK-dependent synapse-to-nucleus communication. Nat Neurosci. 2001;4:565–566. doi: 10.1038/88380. [DOI] [PubMed] [Google Scholar]
- 55.Takasu MA, Dalva MB, Zigmond RE, Greenberg ME. Modulation of NMDA receptor-dependent calcium influx and gene expression through EphB receptors. Science. 2002;295:491–495. doi: 10.1126/science.1065983. [DOI] [PubMed] [Google Scholar]
- 56.Walikonis RS, Jensen ON, Mann M, Provance DW, Jr, Mercer JA, Kennedy MB. Identification of proteins in the postsynaptic density fraction by mass spectrometry. J Neurosci. 2000;20:4069–4080. doi: 10.1523/JNEUROSCI.20-11-04069.2000. [DOI] [PMC free article] [PubMed] [Google Scholar]
- 57.Husi H, Ward MA, Choudhary JS, Blackstock WP, Grant SG. Proteomic analysis of NMDA receptor-adhesion protein signaling complexes. Nat Neurosci. 2000;3:661–669. doi: 10.1038/76615. [DOI] [PubMed] [Google Scholar]
- 58.Valtschanoff JG, Weinberg RJ. Laminar organization of the NMDA receptor complex within the postsynaptic density. J Neurosci. 2001;21:1211–1217. doi: 10.1523/JNEUROSCI.21-04-01211.2001. [DOI] [PMC free article] [PubMed] [Google Scholar]
- 59.Sheng M, Lee SH. Growth of the NMDA receptor industrial complex. Nat Neurosci. 2000;3:633–635. doi: 10.1038/76576. [DOI] [PubMed] [Google Scholar]
- 60.Kennedy MB. Signal-processing machines at the postsynaptic density. Science. 2000;290:750–754. doi: 10.1126/science.290.5492.750. [DOI] [PubMed] [Google Scholar]
- 61.Hayashi Y, Shi SH, Esteban JA, Piccini A, Poncer JC, Malinow R. Driving AMPA receptors into synapses by LTP and CaMKII:requirement for GluR1 and PDZ domain interaction. Science. 2000;287:2262–2267. doi: 10.1126/science.287.5461.2262. [DOI] [PubMed] [Google Scholar]
- 62.Wu J, Wang Y, Rowan MJ, Anwyl R. Evidence for involvement of the neuronal isoform of nitric oxide synthase during induction of long-term potentiation and long-term depression in the rat dentate gyrus in vitro. Neuroscience. 1997;78:393–398. doi: 10.1016/s0306-4522(97)84911-1. [DOI] [PubMed] [Google Scholar]
- 63.English JD, Sweatt JD. A requirement for the mitogen-activated protein kinase cascade in hippocampal long term potentiation. J Biol Chem. 1997;272:19103–19106. doi: 10.1074/jbc.272.31.19103. [DOI] [PubMed] [Google Scholar]
- 64.Cho KO, Hunt CA, Kennedy MB. The rat brain postsynaptic density fraction contains a homolog of the Drosophila discs-large tumor suppressor protein. Neuron. 1992;9:929–942. doi: 10.1016/0896-6273(92)90245-9. [DOI] [PubMed] [Google Scholar]
- 65.Kornau HC, Seeburg PH, Kennedy MB. Interaction of ion channels and receptors with PDZ domain proteins. Curr Opin Neurobiol. 1997;7:368–373. doi: 10.1016/s0959-4388(97)80064-5. [DOI] [PubMed] [Google Scholar]
- 66.Kornau HC, Schenker LT, Kennedy MB, Seeburg PH. Domain interaction between NMDA receptor subunits and the postsynaptic density protein PSD-95. Science. 1995;269:1737–1740. doi: 10.1126/science.7569905. [DOI] [PubMed] [Google Scholar]
- 67.Niethammer M, Kim E, Sheng M. Interaction between the C terminus of NMDA receptor subunits and multiple members of the PSD-95 family of membrane-associated guanylate kinases. J Neurosci. 1996;16:2157–2163. doi: 10.1523/JNEUROSCI.16-07-02157.1996. [DOI] [PMC free article] [PubMed] [Google Scholar]
- 68.Kim E, Cho KO, Rothschild A, Sheng M. Heteromultimerization and NMDA receptor-clustering activity of Chapsyn-110, a member of the PSD-95 family of proteins. Neuron. 1996;17:103–113. doi: 10.1016/s0896-6273(00)80284-6. [DOI] [PubMed] [Google Scholar]
- 69.Tejedor FJ, Bokhari A, Rogero O, Gorczyca M, Zhang J, Kim E, Sheng M, Budnik V. Essential role for dlg in synaptic clustering of Shaker K+ channels in vivo. J Neurosci. 1997;17:152–159. doi: 10.1523/JNEUROSCI.17-01-00152.1997. [DOI] [PMC free article] [PubMed] [Google Scholar]
- 70.Migaud M, Charlesworth P, Dempster M, Webster LC, Watabe AM, Makhinson M, He Y, Ramsay MF, Morris RG, Morrison JH, O’Dell TJ, Grant SG. Enhanced long-term potentiation and impaired learning in mice with mutant postsynaptic density-95 protein. Nature. 1998;396:433–439. doi: 10.1038/24790. [DOI] [PubMed] [Google Scholar]
- 71.Malenka RC. Synaptic plasticity in the hippocampus:LTP and LTD. Cell. 1994;78:535–538. doi: 10.1016/0092-8674(94)90517-7. [DOI] [PubMed] [Google Scholar]
- 72.Lee HK, Barbarosie M, Kameyama K, Bear MF, Huganir RL. Regulation of distinct AMPA receptor phosphorylation sites during bidirectional synaptic plasticity. Nature. 2000;405:955–959. doi: 10.1038/35016089. [DOI] [PubMed] [Google Scholar]
- 73.Sanes JR, Lichtman JW. Can molecules explain long-term potentiation? Nat Neurosci. 1999;2:597–604. doi: 10.1038/10154. [DOI] [PubMed] [Google Scholar]
- 74.Stiles JR, Bartol TM., Jr . Monte Carlo methods for simulating realistic synaptic microphysiology. In: de Schutter E, editor. Computational Neuroscience: Realistic Modeling for Experimentalists. Boca Raton: CRC Press; 2001. pp. 87–127. [Google Scholar]
- 75.Stiles JR, Bartol TM, Jr, Salpeter EE, Salpeter MM, Sejnowski TJ. Synaptic variability:new insights from reconstructions and Monte Carlo simulations with MCell. In: Cowan WM, Sudhof TC, Stevens CF, editors. Synapses. Baltimore: Johns Hopkins University Press; 2001. pp. 681–731. [Google Scholar]
- 76.Bartol TM, Jr, Land BR, Salpeter EE, Salpeter MM. Monte Carlo simulation of miniature endplate current generation in the vertebrate neuromuscular junction. Biophys J. 1991;59:1290–1307. doi: 10.1016/S0006-3495(91)82344-X. [DOI] [PMC free article] [PubMed] [Google Scholar]
- 77.Anglister L, Stiles JR, Salpeter MM. Acetylcholinesterase density and turnover number at frog neuromuscular junctions, with modeling of their role in synaptic function. Neuron. 1994;12:783–794. doi: 10.1016/0896-6273(94)90331-x. [DOI] [PubMed] [Google Scholar]
- 78.Stiles JR, Van Helden D, Bartol TM, Jr, Salpeter EE, Salpeter MM. Miniature endplate current rise times less than 100 microseconds from improved dual recordings can be modeled with passive acetylcholine diffusion from a synaptic vesicle. Proc Natl Acad Sci USA. 1996;93:5747–5752. doi: 10.1073/pnas.93.12.5747. [DOI] [PMC free article] [PubMed] [Google Scholar]
- 79.Faber DS, Young WS, Legendre P, Korn H. Intrinsic quantal variability due to stochastic properties of receptor-transmitter interactions. Science. 1992;258:1494–1498. doi: 10.1126/science.1279813. [DOI] [PubMed] [Google Scholar]
- 80.Wahl LM, Pouzat C, Stratford KJ. Monte Carlo simulation of fast excitatory synaptic transmission at a hippocampal synapse. J Neurophysiol. 1996;75:597–608. doi: 10.1152/jn.1996.75.2.597. [DOI] [PubMed] [Google Scholar]
- 81.Franks KM, Bartol TM, Jr, Sejnowski TJ. A Monte Carlo model reveals independent signaling at central glutamatergic synapses. Biophys J. 2002 doi: 10.1016/S0006-3495(02)75248-X. [DOI] [PMC free article] [PubMed] [Google Scholar]
- 82.Hines ML, Carnevale NT. The NEURON simulation environment. Neural Comput. 1997;9:1179–1209. doi: 10.1162/neco.1997.9.6.1179. [DOI] [PubMed] [Google Scholar]
- 83.Emptage N, Bliss TV, Fine A. Single synaptic events evoke NMDA receptor-mediated release of calcium from internal stores in hippocampal dendritic spines. Neuron. 1999;22:115–124. doi: 10.1016/s0896-6273(00)80683-2. [DOI] [PubMed] [Google Scholar]
- 84.Kovalchuk Y, Eilers J, Lisman J, Konnerth A. NMDA receptor-mediated subthreshold Ca2+ signals in spines of hippocampal neurons. J Neurosci. 2000;20:1791–1799. doi: 10.1523/JNEUROSCI.20-05-01791.2000. [DOI] [PMC free article] [PubMed] [Google Scholar]
- 85.Maeda H, Ellis-Davies GC, Ito K, Miyashita Y, Kasai H. Supralinear Ca2+ signaling by cooperative and mobile Ca2+ buffering in Purkinje neurons. Neuron. 1999;24:989–1002. doi: 10.1016/s0896-6273(00)81045-4. [DOI] [PubMed] [Google Scholar]
- 86.Franks KM, Bartol TM, Jr, Sejnowski TJ. An MCell model of calcium dynamics and frequency-dependence of calmodulin activation in dendritic spines. Neurocomput. 2001;38–40:9–16. [Google Scholar]
- 87.Schiller J, Major G, Koester HJ, Schiller Y. NMDA spikes in basal dendrites of cortical pyramidal neurons. Nature. 2000;404:285–289. doi: 10.1038/35005094. [DOI] [PubMed] [Google Scholar]
- 88.Wei DS, Mei YA, Bagal A, Kao JP, Thompson SM, Tang CM. Compartmentalized and binary behavior of terminal dendrites in hippocampal pyramidal neurons. Science. 2001;293:2272–2275. doi: 10.1126/science.1061198. [DOI] [PubMed] [Google Scholar]
- 89.Svoboda K, Tank DW, Denk W. Direct measurement of coupling between dendritic spines and shafts. Science. 1996;272:716–719. doi: 10.1126/science.272.5262.716. [DOI] [PubMed] [Google Scholar]
- 90.Majewska A, Tashiro A, Yuste R. Regulation of spine calcium dynamics by rapid spine motility. J Neurosci. 2000;20:8262–8268. doi: 10.1523/JNEUROSCI.20-22-08262.2000. [DOI] [PMC free article] [PubMed] [Google Scholar]