

Abstract
Background
The molecular characteristics associated with the response to treatment in glioblastomas (GBMs) remain largely unknown. We performed a retrospective study to assess the genomic characteristics associated with the response of GBMs to either first-line chemotherapy or radiation therapy. The gene expression (n = 56) and genomic profiles (n = 67) of responders and non-responders to first-line chemotherapy or radiation therapy alone were compared on Affymetrix Plus 2 gene expression arrays and BAC CGH arrays.
Results
According to Verhaak et al.'s classification system, mesenchymal GBMs were more likely to respond to radiotherapy than to first-line chemotherapy, whereas classical GBMs were more likely to respond to first-line chemotherapy than to radiotherapy. In patients treated with radiation therapy alone, the response was associated with differential expression of microenvironment-associated genes; the expression of hypoxia-related genes was associated with short-term progression-free survival (< 5 months), whereas the expression of immune genes was associated with prolonged progression-free survival (> 10 months). Consistently, infiltration of the tumor by both CD3 and CD68 cells was significantly more frequent in responders to radiotherapy than in non-responders. In patients treated with first-line chemotherapy, the expression of stem-cell genes was associated with resistance to chemotherapy, and there was a significant association between response to treatment and p16 locus deletions. Consistently, in an independent data set of patients treated with either radiotherapy alone or with both radiotherapy and adjuvant chemotherapy, we found that patients with the p16 deletion benefited from adjuvant chemotherapy regardless of their MGMT promoter methylation status, whereas in patients without the p16 deletion, this benefit was only observed in patients with a methylated MGMT promoter.
Conclusion
Differential expression of microenvironment genes and p16 locus deletion are associated with responses to radiation therapy and to first-line chemotherapy, respectively, in GBM. Recently identified transcriptomic subgroups of GBMs seem to respond differently to radiotherapy and to first-line chemotherapy.
Background
Microarrays are an effective tool for the study of glioma oncogenesis, and this technique has enabled the discovery of new molecular pathways implicated in gliomagenesis [1,2]. Several studies have also described molecular signatures related to histological type and to survival in high-grade gliomas [3-10]. However, until now, few studies have used microarray technology to elucidate the mechanisms associated with the response of the tumor to treatment [11,12]. Despite an overall grim prognosis, some patients with glioblastoma (GBM) do respond to radiotherapy and chemotherapy and achieve prolonged survival. The molecular characteristics associated with prolonged progression-free survival (PFS) after radiotherapy in GBM patients remain largely unknown. Studies demonstrate that patients with methylation of the O6-methylguanine methyltransferase promoter (MGMTP) benefit from radiotherapy with concomitant temozolomide and from adjuvant chemotherapy with alkylating agents [13,14]. However, it is likely that this it is not the only mechanism underlying the chemosensitivity of the tumor in these patients. In this study, we examined the molecular characteristics associated with a response to radiotherapy or to first-line chemotherapy in GBMs in a cohort of patients treated with radiation therapy alone or with first-line chemotherapy; the genomic and transcriptomic profiles of responders and non-responders were compared for both treatment groups.
Methods
Patients
All patients included in this study had de novo GBM according to the 2007 World Health Organization Classification. A central pathological review was performed by DFB. In order to focus more specifically on treatment response, progression-free survival (PFS) and MacDonald's criteria of response were used as outcome measures rather than overall survival (OS), which may be influenced by the use of salvage treatment at relapse. Response to radiation therapy was defined in terms of PFS. Patients were considered as responders to radiotherapy if the PFS was >10 months and as non-responders if the PFS was <5 months. Patients treated with radiotherapy and concomitant temozolomide were excluded. In patients treated with first-line chemotherapy, response was evaluated before radiotherapy according to MacDonald's criteria, and all of these patients had an evaluable tumor [15]. These patients were treated with alkylating agents (BCNU or temozolomide). Radiotherapy was administered at progression or after six months of chemotherapy. Patients were considered as responders if they achieved either partial or complete response and as non-responders if they progressed during chemotherapy. Patients' clinical characteristics are available in Additional file 1 Table S1.
Samples
Samples were provided as snap-frozen sections of areas immediately adjacent to the region used for the histopathological diagnosis. Only samples representative of the tumor and from which high-quality DNA and/or RNA could be obtained were selected (n = 86). For the comparative genomic hybridization (CGH) array study, 67 samples were available: 21 responders to radiotherapy, 18 non-responders to radiotherapy, 11 responders to first-line chemotherapy and 17 non-responders to first-line chemotherapy. The gene expression array study was performed on 56 samples (including 37 samples common to the CGH study): 19 responders to radiotherapy, 15 non-responders to radiotherapy, 12 responders to first-line chemotherapy and 10 non-responders to first-line chemotherapy.
DNA extraction and hybridization
DNA was extracted from frozen tumors using a standard phenol-chloroform procedure
After digestion with DpnII (Ozyme, Saint Quentin en Yvelines, France) and column purification (Qiaquick PCR purification kit; Qiagen, Courtaboeuf, France), tumor DNA was labeled with cyanine-5 (Perkin-Elmer, Wellesley, MA) using the random priming method (Bioprime DNA labeling system; Invitrogen, Cergy-Pontoise, France). Using the same procedure, we labeled control DNA with cyanine-3. After ethanol co-precipitation with 210 g of human Cot-1 DNA (Invitrogen, Cergy-Pontoise, France), resuspension in hybridization buffer (50% formamide), denaturation at 95°C for 10 minutes and prehybridization at 37°C for 90 minutes, probes were cohybridized on an aCGH slide. The aCGH slide was previously preblocked with a buffer containing 2.6 mg succinic anhydride, 118 ml N-methyl-2-pyrrolidinone and 32 ml sodium tetraborate decahydrate, pH 8.0 (Sigma-Aldrich, Lyon, France). After washing, arrays were scanned using an Agilent 2565BA scanner. Image analysis was performed with SPOT v.2.1cc software, and the ratios of Cy5/Cy3 signals were determined. The human genome-wide CIT-CGHarray (V6), which contains 4,434 sequence-verified bacterial artificial chromosome (BAC) and P1-derived artificial chromosome clones, was chosen to obtain systematic coverage of the genome and detailed coverage of regions containing genes previously implicated in carcinogenesis. This array was designed by the CIT-CGH consortium (Olivier Delattre laboratory, Curie Institute, Paris; Charles Theillet laboratory, CRLC Val d'Aurelle, Montpellier; Stanislas du Manoir laboratory, IGBMC, Strasbourg) and IntegraGen. All clones were spotted in quadruplicate (and spaced at approximately 670 kb intervals) on Ultra Gaps slides (Corning Inc., Corning, NY).
RNA extraction and hybridization
Approximately 50 mg of tissue from each tumor was used for total RNA extraction using the RNeasy Lipid Tissue mini kit (Qiagen, CA) according to the manufacturer's instructions. RNA quality was verified with the Bioanalyzer System (Agilent Technologies, Palo Alto, CA) using the RNA Nano Chip. RNA (1.5 μg) was processed and hybridized to the Genechip Human Genome U133 Plus 2.0 Expression array (Affymetrix, CA), which contains over 54,000 probe sets analyzing the expression levels of over 47,000 transcripts and variants. This roughly corresponds to 29,500 distinct Unigene identifiers. The processing was done according to the recommendations of the manufacturer.
Immunohistochemistry
Immunohistochemistry was performed on tissue microarrays (TMA) comprising 25 GBMs (15 responders and 10 non-responders to radiotherapy for whom enough material was available) that were constructed from routinely processed formalin-fixed paraffin-embedded tumor material. Areas of viable and representative tumor, as determined by a review of all blocks, were marked by a pathologist (DFB) prior to inclusion in the TMA (3 × 0.6-mm cores for each tumor).
After steam-heat-induced antigen retrieval, 5-μm sections of formalin-fixed paraffin-embedded samples were tested for the presence of CD3, CD20 and CD68 using a polyclonal rabbit antibody (1:2) (Dako, Trappes, France), a monoclonal mouse antibody (1:600, L26) (Dako) and a monoclonal mouse antibody (1:5000, KP1) (Dako), respectively. A Benchmark Ventana autostainer (Ventana Medical Systems SA, Illkirch, France) was used for detection, and TMA slides were simultaneously immunostained to avoid inter-manipulation variability. Immunostaining was scored by a pathologist (DFB) as follows: 0 = no positive cell; + = some positive cells; ++ = a clear CD3, CD20 or CD68 infiltration.
MGMT promoter methylation status
The MGMT promoter's (MGMTP) methylation status was assessed in patients treated with first-line chemotherapy. The DNA methylation status of the MGMT promoter was determined by bisulfite modification and subsequent Nested Methylation Specific PCR as previously described [16]. Sodium bisulfite specifically modifies non-methylated cytosines, but not methylated cytosines, to uracil. The sodium bisulfite treatment was carried out using the EZ DNA Methylation Kit (Zymo Research). The stage-1 PCR amplifies a 289-bp fragment of the MGMT gene using primers that do not discriminate between methylated and unmethylated alleles. The primer sequences are as follows: Forward 5′ GGATATGTTGGGATAGTT 3′, Reverse 5′ CCAAAAACCCCAAACCC 3′. PCR conditions were as follows: 95°C for 15 min, then 30 cycles of 95°C for 30 s, 52°C for 30 s and 72°C for 30 s, and finally 10 min at 72°C. The stage-1 PCR products were then diluted 100-fold, and 5 μl was subjected to a stage-2 PCR in which primers were specific to methylated or unmethylated alleles. Primer sequences are as follows: for the methylated reactions, Forward 5′ TTTCGACGTTCGTAGGTTTTCG 3′, Reverse 5′ GCACTCTTCCGAAAACGAAACG 3′; for the unmethylated reactions, Forward 5′ TTTGTGTTTTGATGTTTGTAGGTTTTTGT 3′, Reverse 5′ AACTCCACACTCTTCCAAAAACAAAACA 3′. PCR conditions were as follows: 95°C for 15 min, then 30 cycles of 95°C for 30 s, 62°C for 30 s and 72°C for 30 s, and finally 10 min at 72°C. PCR products were separated on 2% agarose gels stained with ethidium bromide and visualized under UV illumination. As a positive control for methylated alleles, we used DNA from lymphocytes treated with SssI methyltransferase (New England Biolabs: Ozyme, St-Quentin-Yvelines, France) and modified by bisulfite treatment.
Data analysis summary
All raw and normalized data files for the microarray analysis have been deposited under accessions E-TABM-897 and E-TABM-898 at the European Bioinformatics Institute http://www.ebi.ac.uk/microarray-as/ae. All genomic and transcriptomic analysis was carried out using R software http://www.R-project.org. For details, please refer to Additional file 2.
Gene expression analysis
Raw gene expression data were normalized in batches using the RMA method [17], yielding normalized log2 intensities, and quality control (QC) reports were generated using the affyQCReport R package. Clustering analysis was performed as previously reported [18]. To identify differentially expressed genes, we used the Bayes moderate T-test implemented in the limma R package. Gene sets analysis using KEGG and Biocarta pathways as well as Gene Ontology terms, Molecular Signature Database gene sets and Stanford Microarray Database gene sets was performed on the 1000 genes most differentially expressed (500 genes up-regulated in responders and 500 genes up-regulated in non-responders) using hypergeometric tests. Custom gene sets were also built using Murat et al.'s data and included in the gene sets analysis [12]. In order to classify our samples according to Phillips et al.'s system, we used their expression data to build a centroid-based classifier, and after checking that it was able to reclassify Phillips et al.'s samples properly, we classified our series based on these centroids. In order to classify our samples according to Verhaak et al.'s system, we used their published centroid-based classifier [8,10].
CGHarray analysis
For CGHarray data, after a QC and filtering step, remaining spots were normalized using the lowess print-tip method, then replicated spots were averaged, yielding normalized log2 ratios. Smoothed log2 ratios were then obtained using the tilingArray R package. Gain and loss status, respectively, were determined for each clone based on a smoothed log2 ratio above (below) the distribution mode plus (minus) one standard deviation. Homozygous deletions and amplicons, respectively, were detected using a sample-based estimate of the tumor cell rate RTC as clones yielding smoothed log2 ratios below log2(1-RTC) (above log2(1+ 1.5* RTC)). Recurrent minimal genomic alterations (MCR) were obtained as previously described [19] . To identify clones or regions with differential genomic status, we used Fisher's exact test.
In all cases, control for multiple testing was done with the Benjamini and Hochberg approach.
Survival curves were calculated according to the Kaplan-Meier method, and differences between curves were assessed using the log-rank test.
Independent data set
The influence of the p16 homozygous genomic deletions was studied in an independent data set of 222 GBMs from the Pitié-Salpêtrière Hospital's neuro-oncology department; the p16 deletion and MGMTP methylation statuses of these data set samples were available. This data set consists largely of patients whose data have been previously published [20]. These patients were treated with either radiation therapy alone or with radiation therapy followed by adjuvant chemotherapy with alkylating agents (BCNU or temozolomide).
Results
Classical and mesenchymal GBMs respond differently to radiotherapy and to first-line chemotherapy
First, in order to assess if responders and non-responders to either radiation therapy or first-line chemotherapy corresponded to different transcriptomic subgroups of GBMs, we performed an unsupervised hierarchical clustering analysis of the 56 GBMs. As shown in Figure 1, three main transcriptomic subgroups were identified. This clustering was robust and conserved across different gene lists and clustering methods. The centroids generating this classification are provided in Additional file 1 Table S2. However, none of the three clusters was enriched in responders or non-responders, and neither the PFS nor the OS differed between the three clusters. As shown in Figure 1, some responders and non-responders had very similar gene expression profiles.
Figure 1.

Unsupervised clustering of the 56 glioblastomas. Unsupervised hierarchical clustering of the 56 GBMs. The heatmap was done with the 72 probe sets used in the centroid classifier that was able to generate the 3 groups identified through unsupervised clustering (Additional file 1 Table S2). Samples and genes were clustered using Ward's linkage and 1-Pearson correlation coefficient. For each probe set, the lowest and highest intensity values are displayed in blue and red, respectively. Treatment: C = First-line chemotherapy, R = Radiotherapy. Response: N = non-responder, Y = responder. Phillips = class according to Phillips et al.'s classification [8], blue P = Proneural, green P = Proliferative, M = Mesenchymal. Verhaak = class according to Verhaak et al.'s classification [10], N = Neural, C = Classical, M = Mesenchymal, P = Proneural. The GBMs were classified into three groups: one group enriched in EGFR-amplified patients (n = 19, blue cluster), one group characterized by a high level of expression of immune and extra-cellular matrix genes (n = 12, red cluster) and one group characterized by a higher of expression of neural genes (n = 25, green cluster). There was a significant overlap when using Phillips et al.'s classes (Fisher's exact test p-value = 1.7 × 10⁻⁸) and a larger overlap with Verhaak et al.'s classes (Fisher's exact test p-value = 2.2 × 10⁻¹⁴).
Next, in order to assess if transcriptomic subgroups of GBMs previously identified in larger series of patients were associated with a specific pattern of response to radiotherapy or to chemotherapy, we classified our 56 samples according to Phillips et al.'s and Verhaak et al.'s transcriptomic classifications and estimated the response rate in each subgroup [8,10]. As shown in Figure 1, there was a significant but not complete overlap between our three subgroups of GBMs and the classes of GBMs identified in these studies. As shown in Table 1, Verhaak et al.'s classes (but not Phillips et al.'s classes) were significantly associated with response to treatment. Indeed, we found that GBMs classified as mesenchymal were more likely to respond to radiotherapy (8 out of 10) than to chemotherapy (1 out of 7) (Fisher's exact test, p = 0.01), whereas GBMs classified as classical were more likely to respond to chemotherapy (7 out of 8) than to radiotherapy (3 out of 11) (Fisher's exact test, p = 0.02). Accordingly, as shown in Figure 2, patients with a mesenchymal GBM had a better outcome when treated with radiotherapy, whereas patients with a classical GBM had a better outcome when treated with first-line chemotherapy. In the neural GBMs, the overall response rate to either radiotherapy or chemotherapy was higher than in the other subgroups (8 responders out of 9 neural GBMs versus 23 responders out of 47 non-neural GBMs, Fisher's exact test, p = 0.03).
Table 1.
Response to radiotherapy according to Phillips and Verhaak classifications
| Response to chemotherapy | Response to radiotherapy | Fisher's exact test |
|||
|---|---|---|---|---|---|
| No | Yes | No | Yes | ||
| Phillips subgroups | |||||
| Mes. | 4 | 7 | 5 | 6 | NS |
| PN | 2 | 3 | 6 | 7 | NS |
| Proliferative | 4 | 2 | 4 | 6 | NS |
| Verhaak subgroups | |||||
| Mes. | 6 | 1 | 2 | 8 | p = 0.01* |
| Neural | 0 | 3 | 1 | 5 | p = 0.03° |
| PN | 3 | 1 | 4 | 3 | NS |
| Classical | 1 | 7 | 8 | 3 | P = 0.02* |
Mes. = Mesenchymal, PN = Proneural
* comparison of the frequencies of response to chemotherapy and to radiotherapy in mesenchymal and classical GBMs
° comparison of the frequency of response to treatment in neural vs. other classes of GBMs
Figure 2.
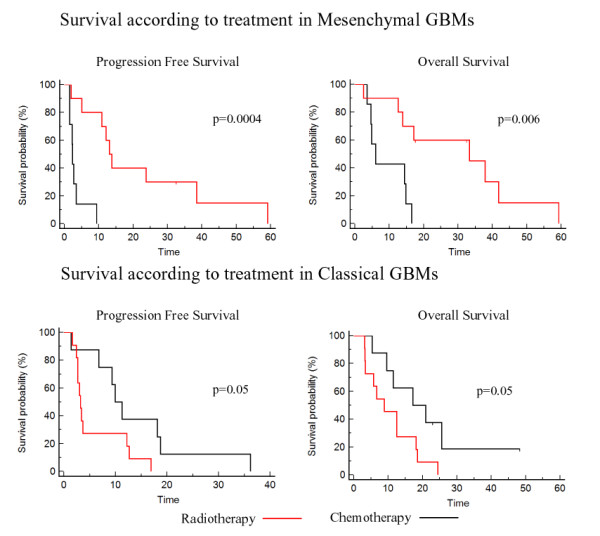
Survival according to treatment in mesenchymal and classical GBMs. Progression-free survival and overall survival according to treatment (radiotherapy = red, first-line chemotherapy = black) in the GBMs of the present study classified as mesenchymal or classical according to Verhaak et al.'s classes [10].
Molecular characteristics associated with response to radiation therapy
In a second step, we focused on all patients treated with radiotherapy alone to identify the molecular characteristics associated with a response to radiation therapy. Comparison of the genomic profiles of responders (n = 21) and non-responders (n = 18) demonstrated that the two groups of patients had very similar genomic profiles (Figure 3). In both groups, there was a high frequency of chromosome 7 gain and chromosome 10 loss, consistent with the most frequently observed genomic abnormalities in GBMs. Only three Minimal Common Regions (MCR) were significantly different between the two groups (Fisher's exact test p-value <0.05), albeit at a low frequency (Table 2). Several genes located in these MCRs were also differentially expressed, but to our knowledge, none of them has been reported to play a role in response to radiation therapy (Table 2 and Additional file 1 Table S3).
Figure 3.

Genomic profiles of patients with short and long PFS after radiation therapy. CGH array genomic profiles of the patients with short (< 5 months) and long (> 10 months) PFS after radiotherapy. For each chromosome, the telomere of the short arm is on the left and the telomere of the long arm is on the right. Genomic gains and losses are shown in red and green, respectively. The y-axis corresponds to the frequency of gains and losses in each group of patients.
Table 2.
Minimal Common Regions differentiating responders from non-responders to radiation therapy and first-line chemotherapy
| Event | Chr | Treatment | Differentially expressed genes located in the MCR | ||
|---|---|---|---|---|---|
| Radiation therapy | |||||
| % in NR | % in R | p-value | |||
| Loss | 5p15.3 | 0 | 33 | 0.04 | |
| Loss | 5p15.2-3 | 0 | 29 | 0.01 | CMBL (FC = 1.3) |
| Gain | 17q24-25 | 22 | 0 | 0.02 | TANC2 (FC = 1.1), DCAF7 (FC = 1.2), LRRC37A (FC = 1.3), PITPNC1 (FC = 1.6) |
| Chemotherapy | |||||
| % in NR | % in R | p-value | |||
| Amp. | 7p11.2 | 0.35 | 0.81 | 0.02 | |
| Del. | 9p21.3 | 0 | 0.82 | < 10-4 | MTAP (FC = 2), CDKN2A (FC = 2.6) |
| Loss | 9p24 | 0.12 | 0.64 | 0.01 | |
| Loss | 9p24 | 0.12 | 0.64 | 0.01 | KIAA1432 (FC = 1.4), KDM4C (FC = 1.2) |
| Loss | 9p24;p23;p22 | 0.12 | 0.64 | 0.01 | ZDHHC21 (FC = 1.6) |
| Gain | 11p15 | 0.18 | 0.64 | 0.02 | PGAP2 (FC = 0.8) |
| Gain | 11q13 | 0.18 | 0.91 | 0.0003 | C11orf68 (FC = 0.8), B3GNT1 (FC = 0.75), RAB1B (FC = 0.86) |
| Gain | 17p13 | 0.18 | 0.64 | 0.02 | CRK (FC = 0.83), INPP5K (FC = 0.88), TSR1 (FC = 0.87), METT10 D (FC = 0.77), SGSM2(FC = 0.75) |
| Gain | 17p13 | 0.18 | 0.64 | 0.02 | METT10 D (FC = 0.77) |
| Gain | 19p13.3 | 0.35 | 0.91 | 0.006 | PPAP2C (FC = 0.74), SHC2 (FC = 0.8), MOBKL2A (FC = 0.81), SCAMP4 (FC = 0.8), BTBD2 (FC = 0.8), FAM108A1 (0.86), SF3A2 (FC = 0.74), AP3D1 (0.77), GNG7 (0.46), ZNF555 (0.82), DOHH (0.82), C19orf29 (0.8), NFIC (0.75) |
| Gain | 19p13.3;p13.2;p13.1 | 0.29 | 0.91 | 0.002 | SLC25A23 (0.6), CLEC4 M (0.85), ZNF846 (0.7), OLFM2 (0.6), S1PR2 (0.8), DHPS (0.85), TNPO2 (0.76), ZNF791 (0.77) |
| Gain | 19p13.1 | 0.29 | 0.91 | 0.002 | EPS15L1 (0.83), OCEL1 (0.85), TMEM161A (0.82), NCAN (0.3) |
| Gain | 19p12 | 0.29 | 0.91 | 0.002 | |
| Gain | 19p12;p11 | 0.29 | 0.91 | 0.002 | |
| Gain | 19q11;q12 | 0.29 | 0.82 | 0.002 | FXYD3 (0.84) |
| Gain | 19q12; q13.1 |
0.35 | 0.91 | 0.006 | FAM98C (0.77) |
| Gain | 20p13 | 0.12 | 0.82 | 0.0004 | ZCCHC3 (0.81), SOX12 (0.84), RBCK1 (0.8), CSNK2A1 (0.81), MAVS (0.8), ATRN (0.76) |
| Gain | 20p12.3; p11.2 |
0.18 | 0.64 | 0.002 | RRBP1 (0.73) |
| Gain | 20p11.2 | 0.12 | 0.64 | 0.003 | |
| Gain | 20p11.2; p11.1; q11.1;q11.2 |
0.24 | 0.73 | 0.02 | CST8 (0.87) |
| Gain | 20q11.2 | 0.24 | 0.82 | 0.006 | PLUNC (0.88), CHMP4B (0.83) |
| Gain | 20q11.2 | 0.24 | 0.82 | 0.006 | CHMP4B (0.83), LOC647979 (0.67) |
| Gain | 20q11.2;q12 | 0.18 | 0.73 | 0.006 | SNHG11 (0.75) |
| Gain | 20q13.1 | 0.18 | 0.73 | 0.006 | SLC13A3 (0.81) |
| Gain | 20q13.1 | 0.24 | 0.73 | 0.02 | PREX1 (0.72) |
| Gain | 20q13.3 | 0.24 | 0.73 | 0.02 | CDH4 (0.5), OSBPL2 (0.82) |
Chr= chromosome, NR= Non-responder, R= Responder, % = Frequency of the event, FC= Fold change in NR versus R, Amp. = Amplification, Del. = Homozygous deletion
Recurrent alterations were defined for the entire population of samples if the identical alteration was present in at least two samples. Computation of recurrent minimal genomic alterations was done in a similar way to a method previously described using original R code [19]. Comparison of the genomic profiles of responders (n = 21) and non-responders (n = 18) demonstrated that three Minimal Common Regions (MCRs) were significantly different between the two groups (Fisher's exact test p-value <0.05). Comparison of the genomic profiles of responders (n = 11) versus non-responders (n = 17) to first-line chemotherapy demonstrated substantial genomic differences, with twenty-four MCRs being significantly (p < 0.05) associated with the chemotherapy response. Differentially expressed genes with a p-value <0.05 and located in the MCR are shown with their corresponding fold changes.
Therefore, we focused on the comparison of the gene expression profiles of responders (n = 19) and non-responders (n = 15). As suggested by the observation that responders and non-responders to radiotherapy could have very similar expression profiles, the differences between responders and non-responders were modest; nevertheless, 417 genes were up-regulated in non-responders and 449 up-regulated in responders with p < 0.05 and fold change > 1.5 (Additional file 1 Table S4). To characterize the differences between the two groups, we performed a gene set analysis on the 1000 genes most differentially expressed (500 genes up-regulated in responders and 500 genes up-regulated in non-responders). This demonstrated that these gene lists were enriched in genes with very different ontologies (Table 3, Table 4 and Additional file 1 Table S5). The list of up-regulated genes in responders was most significantly enriched in genes involved in the immune response, namely in immune genes previously reported to be associated with an improved outcome after radiochemotherapy (Cluster G24, Table 4) [12]. This enrichment was seen in non-specific inflammatory response genes as well as in genes involved in the B cell-mediated response and T cell activation (Table 3, Table 4). In order to validate these findings at the protein level, an immunohistochemical study of CD3, CD20 and CD68 markers was performed in the tumors of responders and non-responders to radiotherapy. Neither GBM samples of responders nor those of non-responders were infiltrated by CD20 cells. However, infiltration by CD3 cells and by both CD3 and CD68 was much more frequent in responders than in non-responders to radiotherapy (Table 5, Fisher's exact test, p-value = 0.04). On the other hand, the list of up-regulated genes in non-responders was most significantly enriched in genes induced by hypoxia, suggesting a higher level of hypoxia in the non-responders (Table 3, Table 4). As hypoxia is a well-known mechanism of radiation resistance, these results suggest that even in GBMs, which are highly hypoxic tumors, a higher level of hypoxia raises the level of resistance to radiation therapy.
Table 3.
Summary of the most relevant gene sets enriched in responders and non-responders to radiotherapy
| Gene sets most significantly enriched in responders | BH adjusted p-value |
Gene sets most significantly enriched in non-responders | BH adjusted p-value |
|---|---|---|---|
| Murat et al. immune gene cluster (G24) | < 10-4 | MSigDB C2 pathways MENSE_HYPOXIA_UP | < 10-4 |
| GO:0042613 - MHC class II protein complex | < 10-4 | SMD processes core_hypoxia1_sw | < 10-4 |
| SMD cancerModules Immune (humoral) and inflammatory response | < 10-4 | MSigDB C2 pathways HYPOXIA_REVIEW | 0.001 |
| GO:0006955 - immune response | < 10-4 | SMD cancerModules DRG (dorsal root ganglia) genes | 0.006 |
| MSigDB C2 pathways LEE_TCELLS2_UP | < 10-4 | MSigDB C2 pathways HYPOXIA_REG_UP | 0.01 |
| GO:0006954 - inflammatory response | < 10-4 | ||
| GO:0045087 - innate immune response | < 10-4 |
Summary of gene sets analysis using KEGG, Biocarta pathways, Gene Ontology (GO) terms, Molecular Signatures Database (MSigDB) gene sets, Stanford microarray database (SMS) and Murat et al.'s gene sets [12]. BH: Benjamini and Hochberg.
Table 4.
Most differentially expressed genes between responders and non-responders to radiotherapy
| Twenty most up-regulated genes in responders to radiotherapy | ||||
|---|---|---|---|---|
| Probe set | Gene symbol | Description | FC | p-value |
| 211538_s_at | HSPA2 | Heat shock 70 kDa protein 2 | 3.4 | < 10-4 |
| 209687_at | CXCL12 | Chemokine ligand 12 (SDF1) | 2.6 | 0.001 |
| 209480_at | HLA-DQB1 | MHC complex, class II, DQ beta 1 | 2.5 | 0.023 |
| 221900_at | COL8A2 | Collagen, type VIII, alpha 2 | 2.5 | 0.004 |
| 226818_at | MPEG1 | Macrophage expressed gene 1 | 2.4 | < 10-4 |
| 219759_at | ERAP2 | Endoplasmic reticulum aminopeptidase 2 | 2.3 | 0.019 |
| 220146_at | TLR7 | Toll-like receptor 7 | 2.3 | 0.002 |
| 222881_at | HPSE | Heparanase | 2.2 | < 10-4 |
| 239270_at | PLCXD3 | Phosphatidylinositol-specific Phospholipase C, × domain containing 3 | 2.2 | 0.001 |
| 218858_at | DEPDC6 | DEP domain containing 6 | 2.2 | 0.001 |
| 209343_at | EFHD1 | EF-hand domain family, D1 | 2.2 | 0.004 |
| 205034_at | CCNE2 | Cyclin E2 | 2.2 | 0.004 |
| 223170_at | TMEM98 | Transmembrane protein 98 | 2.2 | 0.012 |
| 203184_at | FBN2 | Fibrillin 2 | 2.2 | 0.020 |
| 1557395_at | LOC255130 | 2.2 | 0.035 | |
| 204466_s_at | SNCA | Synuclein, alpha | 2.1 | 0.017 |
| 228598_at | DPP10 | Dipeptidyl-peptidase 10 | 2.1 | 0.023 |
| 1567628_at | CD74 | CD74 molecule, MHC complex | 2.1 | 0.006 |
| 219750_at | TMEM144 | Transmembrane protein 144 | 2.1 | 0.04 |
| 228376_at | GGTA1 | Glycoprotein, alpha-galactosyltransferase 1 | 2.1 | 0.006 |
| Twenty genes most differentially up-regulated in non-responders to radiotherapy | ||||
| 220405_at | SNTG1 | Syntrophin, gamma 1 | 3.4 | 0.001 |
| 236761_at | LHFPL3 | Lipoma HMGIC fusion partner-like 3 | 3.2 | 0.035 |
| 204913_s_at | SOX11 | SRY (sex determining region Y)-box 11 | 3.1 | 0.038 |
| 205230_at | RPH3A | Rabphilin 3A homolog (mouse) | 2.8 | 0.014 |
| 202859_x_at | IL8 | Interleukin 8 | 2.8 | 0.023 |
| 206201_s_at | MEOX2 | Mesenchyme homeobox 2 | 2.7 | 0.047 |
| 230498_at | MCHR1 | Melanin-concentrating hormone receptor 1 | 2.7 | 0.006 |
| 1554452_at | HIG2 | Hypoxia-inducible protein 2 | 2.7 | 0.003 |
| 206984_s_at | RIT2 | Ras-like without CAAX 2 | 2.6 | 0.023 |
| 225285_at | BCAT1 | Branched chain aminotransferase 1, cytosolic | 2.4 | < 10-4 |
| 223278_at | GJB2 | Gap junction protein, beta 2, 26kDa | 2.4 | 0.021 |
| 205358_at | GRIA2 | Glutamate receptor, ionotropic, AMPA 2 | 2.4 | 0.027 |
| 227361_at | HS3ST3B1 | Heparan sulfate (glucosamine) 3-O-sulfotransferase 3B1 | 2.4 | 0.038 |
| 211527_x_at | VEGFA | Vascular endothelial growth factor A | 2.4 | 0.015 |
| 219196_at | SCG3 | Secretogranin III | 2.3 | 0.025 |
| 232099_at | PCDHB16 | Protocadherin beta 16 | 2.3 | 0.010 |
| 217562_at | FAM5C | Family with sequence similarity 5, member C | 2.3 | 0.023 |
| 214920_at | THSD7A | Thrombospondin, type I, domain containing 7A | 2.3 | 0.025 |
| 202499_s_at | SLC2A3 | Solute carrier family 2 (facilitated glucose transporter), member 3 | 2.2 | < 10-4 |
| 202912_at | ADM | Adrenomedullin | 2.2 | 0.016 |
List of the 20 genes most up-regulated and with a p-value <0.05 in responders versus non-responders and in non-responders versus responders to radiotherapy. FC: Fold change, p-value: Limma T-test p-value. Immune genes and hypoxia genes are underlined in responders and non-responders, respectively.
Table 5.
CD20, CD3 and CD68 immunohistochemistry in responders and non-responders to radiation therapy
| Responders | Non-responders | Fisher's exact test | |||||
|---|---|---|---|---|---|---|---|
| Negative | + | ++ | Negative | + | ++ | p-value | |
| CD20 | 15 | 0 | 0 | 10 | 0 | 0 | NS |
| CD3 | 4 | 6 | 5 | 7 | 3 | 0 | 0.04 |
| CD68 | 5 | 7 | 3 | 6 | 4 | 1 | NS |
| CD3 and CD68 | 5 | 10 | 8 | 2 | 0.04 | ||
Molecular characteristics associated with response to first-line chemotherapy
Comparison of the genomic profiles (gains, losses, homozygous deletions and amplifications) of responders (n = 11) versus non-responders (n = 17) to first-line chemotherapy (in contrast to radiation therapy) demonstrated substantial genomic differences (Figure 4). CDKN2A (p16) locus homozygous deletions on 9p21, EGFR amplification and 24 MCRs (3 loss and 21 gains) were significantly associated with response to chemotherapy (Fisher's exact test, p < 0.05) (Table 2 and Additional file 1 Table S6). CDKN2A (p16) locus homozygous deletion was the most significant event; it was observed in 82% of responders but in none of the non-responders (Fisher's exact test, p < 10-4). It was associated with a significant down-regulation of the expression of CDKN2A in responders (p = 0.04). Concerning MTAP and CDKN2B, which are also located in the p16 locus, a significant down-regulation of the expression in responders was observed only for MTAP (p = 0.0003). Among the other genomic alterations that have been reported to alter the retinoblastoma (RB) signaling pathway in GBMs (i.e., CDK4 or CDK6 or CCND2 amplification and RB1 or CDKN2C homozygous deletion), we found a CDK4 amplification in three non-responders and a CCND2 amplification in one responder who had also a p16 deletion. Thus, in contrast to p16 deletion, other genomic alterations disrupting the RB pathway did not seem to be associated with response to chemotherapy.
Figure 4.

Genomic profiles of non-responders and responders to first-line chemotherapy. CGH array genomic profiles of the non-responders and the responders to first line chemotherapy. For each chromosome, the telomere of the short arm is on the left and the telomere of the long arm is on the right. Genomic gains and losses are shown in red and green, respectively. p16 locus homozygous deletion is shown in yellow. The y-axis corresponds to the frequency of gains and losses in each group of patients.
EGFR amplification was more frequently observed in responders than in non-responders (81% vs. 35%, Fisher's exact test, p = 0.02). All lost MCRs were located on chromosome 9p22-24, and these loci were not independent. Among the genes located in these MCRs (Table 2), none has been reported to be involved in chemosensitivity. Gained MCRs were located on chromosomes 11p, 11q, 17p, 19p, 19q, 20p and 20q. Genes located in these MCRs and significantly overexpressed in responders are summarized in Table 2. To our knowledge, none of these genes has been associated with chemosensitivity.
Surprisingly, MGMTP methylation analysis demonstrated that most patients in this series were MGMTP unmethylated (8 out of 11 responders and 14 out of 17 non-responders); thus, these genomic abnormalities may actually represent alternative mechanisms of chemosensitivity in MGMTP unmethylated patients.
Next, we compared the gene expression profiles of responders (n = 12) and non-responders (n = 10). The differences between the two groups were less important than the analogous differences between responders and non-responders to radiotherapy, with 292 genes being up-regulated in non-responders and 203 genes being up-regulated in responders with a p-value <0.05 and a fold change >1.5 (Additional file 1 Table S7). Gene set analysis on the 1000 genes most differentially expressed between the two groups (500 genes up-regulated in responders and 500 genes up-regulated in non-responders) was performed. In agreement with the genomic analysis, the list of up-regulated genes in non-responders was enriched in genes located on 9p (Table 6). Interestingly, this gene list was also enriched in genes reported to be up-regulated in embryonic and neural stem cells, whereas the list of genes up-regulated in responders was enriched in genes up-regulated in the normal brain, suggesting a link between resistance to chemotherapy and a more undifferentiated phenotype of the tumor (Table 6, Table 7 and Additional file 1 Table S8). Consistently, the list of genes up-regulated in responders was enriched in a set of normal brain genes (Cluster 18, Table 7) associated with improved outcome after chemoradioherapy whereas the list of genes up-regulated in non-responders was enriched in a set of stem-cell genes (Cluster 28_98, Table 7) associated with a worse outcome after concomitant chemoradiotherapy [12]. Among the stem-cell genes, HOXA10 and HOXC6, were the most up-regulated genes in non-responders to chemotherapy.
Table 6.
Summary of the most relevant gene sets enriched in responders and non-responders to chemotherapy
| Gene sets most significantly enriched in responders | BH adjusted p-value |
Gene sets most significantly enriched in non-responders | BH adjusted p-value |
|---|---|---|---|
| MSigDB C2 pathways AGEING_BRAIN_UP | < 10-4 | SMD chromArms 9p | 0.005 |
| SMD cancerModules CNS genes | < 10-4 | MSigDB C2 pathways STEMCELL_NEURAL_UP | 0.007 |
| Murat et al. normal brain gene cluster (G18) | < 10-4 | MSigDB C2 pathways LEE_TCELLS2_UP | 0.01 |
| SMD tissues Brain_sw | 0.06 | GO:0001952 - regulation of cell-matrix adhesion | 0.02 |
| MSigDB C2 pathways STEMCELL_EMBRYONIC_UP Murat et al. stem cell gene cluster (G28_G98) |
0.02 1 |
Summary of gene sets analysis using KEGG, Biocarta pathways, Gene Ontology (GO) terms, Molecular Signatures Database (MSigDB) gene sets and Stanford microarray database (SMD) and Murat et al.'s gene sets [12]. BH: Benjamini and Hochberg.
Table 7.
Most differentially expressed genes between responders and non-responders to first-line chemotherapy
| Twenty genes most up-regulated in responders to chemotherapy | ||||
|---|---|---|---|---|
| Probe set | Gene symbol | Description | FC | p-value |
| 203296_s_at | ATP1A2 | ATPase, Na+/K+ transporting, alpha 2 (+) polypeptide | 5.4 | 0.003 |
| 230865_at | LIX1 | Lix1 homolog (mouse) | 3.8 | 0.005 |
| 209728_at | HLA-DRB4 | MHC, DR beta 4 | 3.8 | 0.002 |
| 223075_s_at | AIF1L | Allograft inflammatory factor 1-like | 3.6 | 0.002 |
| 210738_s_at | SLC4A4 | Solute carrier family 4, sodium bicarbonate cotransporter, member 4 | 3.5 | 0.02 |
| 223434_at | GBP3 | Guanylate binding protein 3 | 3.5 | 0.01 |
| 228581_at | KCNJ10 | Potassium inwardly-rectifying channel, subfamily J, member 10 | 3.4 | 0.008 |
| 229778_at | C12orf39 | chromosome 12 open reading frame 39 | 3.3 | 0.02 |
| 205143_at | NCAN | Neurocan | 3.3 | 0.02 |
| 225911_at | NPNT | Nephronectin | 3.3 | 0.004 |
| 209074_s_at | FAM107A | Family with sequence similarity 107, member A | 3.3 | 0.004 |
| 206306_at | RYR3 | Ryanodine receptor 3 | 3.1 | 0.04 |
| 217057_s_at | GNAS | GNAS complex locus | 3.1 | 0.03 |
| 220029_at | ELOVL2 | Elongation of very long chain fatty acids (FEN1/Elo2, SUR4/Elo3, yeast)-like 2 | 3.1 | 0.008 |
| 1558010_s_at | SLC1A2 | Solute carrier family 1 (glial high affinity glutamate transporter), member 2 | 3.1 | 0.01 |
| 223699_at | CNDP1 | Carnosine dipeptidase 1 (metallopeptidase M20 family) | 2.9 | 0.02 |
| 211597_s_at | HOPX | Homeodomain-only protein | 2.8 | 0.002 |
| 209631_s_at | GPR37 | G protein-coupled receptor 37 (endothelin receptor type B-like) | 2.8 | 0.002 |
| 204379_s_at | FGFR3 | Fibroblast growth factor receptor 3 | 2.8 | 0.03 |
| 214279_s_at | NDRG2 | NDRG family member 2 | 2.7 | 0.008 |
| Twenty genes most up-regulated in non-responders to chemotherapy | ||||
| 210809_s_at | POSTN | Periostin, osteoblast specific factor | 4.3 | 0.05 |
| 223278_at | GJB2 | Gap junction protein, beta 2, 26kDa | 4.1 | 0.01 |
| 231735_s_at | MALAT1 | Metastasis associated lung adenocarcinoma transcript 1 | 3.6 | 0.003 |
| 206785_s_at | KLRC1///KLRC2 | Killer cell lectin-like receptor subfamily C, member 1///member 2 | 3.3 | 0.03 |
| 230472_at | IRX1 | Iroquois homeobox protein 1 | 3.1 | 0.03 |
| 213350_at | RPS11 | Ribosomal protein S11 | 2.8 | 0.004 |
| 228367_at | ALPK2 | Alpha-kinase 2 | 2.7 | 0.01 |
| 209644_x_at | CDKN2A | Cyclin-dependent kinase inhibitor 2A (p16) | 2.7 | 0.04 |
| 221872_at | RARRES1 | Retinoic acid receptor responder (tazarotene induced) 1 | 2.6 | 0.04 |
| 224321_at | TMEFF2 | Transmembrane protein with EGF-like and two follistatin-like domains 2 | 2.5 | 0.004 |
| 225314_at | OCIAD2 | OCIA domain containing 2 | 2.5 | 0.02 |
| 206858_s_at | HOXC6 | Homeobox C6 | 2.5 | 0.01 |
| 213150_at | HOXA10 | Homeobox A10 | 2.4 | 0.04 |
| 235412_at | ARHGEF7 | Rho guanine nucleotide exchange factor (GEF) 7 | 2.4 | 0.03 |
| 209687_at | CXCL12 | Chemokine (C-X-C motif) ligand 12 | 2.3 | 0.03 |
| 206282_at | NEUROD1 | Neurogenic differentiation 1 | 2.2 | 0.02 |
| 227388_at | TUSC1 | Tumor suppressor candidate 1 | 2.2 | 0.0007 |
| 1562403_a_at | SLC8A3 | Solute carrier family 8 (sodium-calcium exchanger), member 3 | 2.2 | 0.02 |
| 201387_s_at | UCHL1 | Ubiquitin carboxyl-terminal esterase L1 (ubiquitin thiolesterase) | 2.2 | 0.01 |
| 231984_at | MTAP | Methylthioadenosine phosphorylase | 2.0 | 0.0003 |
List of the 20 genes most up-regulated and with a p-value <0.05 in responders versus non-responders and in non-responders versus responders to first-line chemotherapy. FC: Fold change, p-value: Limma T-test p-value. Normal brain genes and stem-cell genes are underlined in responders and non-responders, respectively.
Impact of p16 locus homozygous deletions on outcome after adjuvant chemotherapy in an independent data set
As the p16 locus homozygous deletion was the most consistent finding in patients responding to first-line chemotherapy, we focused on the study of this genomic abnormality in an independent series of patients treated either by radiotherapy alone (n = 79) or by radiotherapy followed by adjuvant chemotherapy (n = 143) for whom the MGMTP methylation status was also available (Table 8). We hypothesized that, if this genomic abnormality was consistently associated with chemosensitivity, then, as has been demonstrated for MGMTP methylation, the benefit of adjuvant chemotherapy would be more pronounced in the group of patients with the p16 deletion.
Table 8.
Characteristics of the patients from the Pitié-Salpêtrière database
| Treatment group | Age (median) | Karnofsky (median) | Surgery (% B/P/C) |
MGMTP methylated | |
|---|---|---|---|---|---|
| P16 not deleted (n = 141) | |||||
| RT alone | N = 47 | 57 | 80 | 8/27/65 | 55% |
| RT+CT | N = 94 | 55 | 80 | 13/24/63 | 46% |
| P16 deleted (n = 81) | |||||
| RT alone | N = 32 | 57 | 80 | 15/25/60 | 53% |
| RT+CT | N = 49 | 57 | 80 | 10/27/63 | 53% |
Surgery (B/P/C): Percentage of Biopsy/Partial/Complete surgery; MGMTP methylated: percentage of patients with methylated MGMT; RT: radiotherapy; RT+CT: radiotherapy and adjuvant chemotherapy.
In the patients with the p16 deletion, we found that, regardless of MGMTP methylation status, those treated with radiotherapy and adjuvant chemotherapy had a significantly longer PFS (10.7 vs. 7.9 months, p = 0.007, if unmethylated; 9.7 vs. 7.9 months, p = 0.01, if methylated) and OS (25.3 vs. 12.2 months, p = 0.002, if unmethylated; 18.6 vs. 12.2 months, p = 0.01, if methylated) than those treated with radiotherapy alone (Figure 5). This association was independent of age, Karnofsky performance status and type of surgery. In contrast, among patients without the p16 deletion who were treated with radiotherapy and adjuvant chemotherapy, only those patients with a methylated MGMTP had a longer PFS (11.8 vs. 6.3 months, p = 0.008) and a longer OS (18.4 vs. 15 months, p = 0.05) than those treated with radiotherapy alone (Figure 5). Patients without the p16 deletion treated with radiotherapy and adjuvant chemotherapy and with an unmethylated MGMTP did not fare better than patients without the p16 deletion who were treated with radiotherapy alone.
Figure 5.

Survival according to treatment, radiotherapy alone or radiotherapy and adjuvant chemotherapy, p16 deletion and MGMTP methylation in an independent series of 222 GBMs. The y-axis corresponds to the survival probability and the x-axis to survival time (months). Survival curves on the left correspond to the patients with p16 deletions; survival curves on the right correspond to patients without p16 deletions. These survival curves show that patients with p16 deletions benefit from adjuvant chemotherapy regardless of their MGMTP methylation status, whereas patients without p16 deletions benefit from adjuvant chemotherapy only when they have a methylated MGMTP.
The finding that MGMTP unmethylated patients benefit from adjuvant chemotherapy when the p16 locus is deleted is consistent with the association between p16 deletion and chemosensitivity. However, we found no additive effect between MGMTP methylation and p16 deletion. Indeed, in the group of patients with a p16 deletion who were treated with radiotherapy and adjuvant chemotherapy, the outcomes were similar between MGMTP methylated and unmethylated patients (Figure 5).
Discussion
Several microarray studies have focused on the relationship between gene expression profiles, genomic profiles and overall survival in high-grade gliomas [4,6-10,21], but few studies have used microarray technology to describe the molecular characteristics associated with the response of the tumor to therapy [11,12]. A recent study examined the gene expression profile and survival in GBM patients treated with either radiation therapy alone or with concomitant chemoradiotherapy with temozolomide, but this study essentially focused on patients treated with concomitant chemoradiotherapy [12]. Thus, until now, no study had performed an extensive microarray-based study of the gene expression and genomic characteristics of GBMs with different responses after either radiation therapy alone or first-line chemotherapy. The present study has several limitations. Beside the limited number of patients, the response criteria used to define response to radiotherapy are debatable. Furthermore, the fact that most responders to first-line chemotherapy were MGMTP unmethylated suggests that this group of patients might not be completely representative of the entire population of GBMs. However, despite these limitations, the present study provides new information regarding the molecular characteristics associated with responses to radiotherapy and to first-line chemotherapy in GBMs.
Our first objective was to assess if responders and non-responders to radiotherapy or to chemotherapy corresponded to distinct transcriptomic subgroups of GBMs. Using unsupervised hierarchical clustering, we were unable to identify any transcriptomic subgroups of responders or non-responders. However, we found an association between Verhaak et al.'s transcriptomic classification of GBMs and the response rates to radiotherapy and to chemotherapy [10]. This classification has been established by the Cancer Genome Atlas Network and is presently the most accomplished transcriptomic classification system for GBMs [10]. It distinguishes four subgroups of GBMs. Classical GBMs are characterized by a 95% rate of EGFR amplification, p16 locus deletion and an astrocytic gene expression profile. Mesenchymal GBMs are characterized by a high rate of NF1 mutation/deletion and an activated astroglial gene expression profile. Proneural GBMs are characterized by a high rate of PDGFRA amplification and IDH1 mutations and an oligodendroglial gene expression profile. Neural GBMs are characterized by a normal brain-like gene expression profile [10]. Using this classification, it has been suggested that classical and mesenchymal GBMs, unlike proneural GBMs, benefit from more aggressive treatment consisting of concomitant chemoradiotherapy or radiotherapy followed by prolonged adjuvant chemotherapy (> 3 cycles). However, there are currently no data concerning the response rates of these subgroups of GBMs to either radiotherapy alone or to first-line chemotherapy. Interestingly, we found that classical GBMs were more likely to respond to first-line chemotherapy than to radiotherapy (87.5% vs. 27%, p = 0.02), whereas mesenchymal GBMs were more likely to respond to radiotherapy than to first-line chemotherapy (80% vs. 15%, p = 0.01). We also observed that neural GBMs had higher response rates to both radiotherapy and chemotherapy than the other subtypes (88% versus 49%, p = 0.03). Of course, these results must be considered with caution because of the limited number of GBMs studied and because of the selection criteria used in the present study. However, in line with Verhaak et al.'s findings, these results suggest that these transcriptomic subgroups of GBMs might benefit from different therapeutic strategies.
In our cohort, the transcriptomic and genomic characteristics associated with a therapeutic response differed between patients treated with radiation therapy and patients treated with first-line chemotherapy. These results are in agreement with a recent study showing that the molecular characteristics predictive of resistance to chemoradiotherapy were not predictive of resistance to radiation therapy alone [12]. They are also in agreement with the finding that in the present study, responders to radiotherapy were mostly mesenchymal GBMs, whereas responders to chemotherapy were mostly classical GBMs, though this might also be related to the different criteria used to define response in our two groups of patients.
In examining the differences between responders and non-responders to radiation therapy, our main finding is relevant to the differential expression of genes implicated in the micro-environment. As observed in another study, genes implicated in the innate immune response were enriched in responders to radiation therapy [12]. Consistently, we found that the tumors of responders were much more frequently infiltrated by both T lymphocytes and microglial cells than were those of non-responders. This finding is also in agreement with the high response rate to radiotherapy observed among the mesenchymal GBMs. Indeed, these GBMs are characterized by a high level of inflammation and microglial infiltration [10]. This finding suggests that stimulating innate immunity might enhance tumor control and encourage the use of immunotherapy [22]. It is also interesting to link this result with epidemiological studies that have demonstrated a lower incidence of gliomas in patients with allergies, as these studies suggest that particular immune characteristics may protect against gliomas [23]. Recently, the expression of inflammation genes in gliomas has also been inversely correlated with the expression of CD133, a marker of stem cells [24]. On the other hand, hypoxia-induced genes were enriched in non-responders to radiation therapy. Hypoxia is a well known factor involved in radiation resistance [25]. GBMs are highly hypoxic tumors, and hypoxia plays a key role in their pathogenesis [26]. It enhances angiogenesis and selects for highly malignant cells resistant to hypoxic cell death and with increased migration capabilities [26]. Furthermore, hypoxia has been shown to maintain tumor stem cells in GBMs, which have been suggested to promote radioresistance [27]. Hypoxia gene expression profiles have been shown to be associated with poor outcome in several cancers, but not in GBMs [28]. The volume of the hypoxic tumor and the maximum level of hypoxia in GBMs measured using [18F]fluoromisonidazole positron emission tomography have been associated with a shorter PFS and OS after radiation therapy [29], and similar results have been obtained using binding of EF5 to measure tissue hypoxia [30]. However, up to now, therapeutic strategies aiming at reducing hypoxia to increase the efficacy of radiation therapy have failed to demonstrate efficacy in gliomas [31]. Interestingly, in our series, VEGFA was one of the most overexpressed hypoxia-induced genes in non-responders. VEGFA enhances endothelial cell survival, proliferation, migration and blood vessel permeability [32,33]. This in turn contributes to heterogeneous oxygen delivery and hypoxia [34]. Anti-VEGF treatments have been demonstrated to normalize the structure and function of the abnormal neovasculature [34-36], thus restoring normal blood flow, diminishing vascular leakage, reducing hypoxia and ultimately making tumor cells more sensitive to radiation therapy. Therefore, the overexpression of VEGFA and hypoxia-induced genes in non-responders to radiation therapy in our cohort supports the use of therapies that combine anti-angiogenics with radiation therapy to enhance the efficacy of radiotherapy by reducing tumor hypoxia [35].
In examining the differences between responders and non-responders to first-line chemotherapy, we found that the genes up-regulated in non-responders were enriched in neural and embryonic stem-cell genes, whereas those up-regulated in responders were enriched in normal brain genes. This is consistent with the finding in another study that a stem-cell gene expression profile was associated with shorter survival after combined radiochemotherapy [12] and with several reports suggesting that cancer stem cells are more resistant to chemotherapy [37-39].
Another interesting result of our study is that the most striking genomic difference between responders and non-responders to first-line chemotherapy was the overrepresentation of homozygous p16 locus deletions in responders. P16/CDKN2A deletions occur in about 30-50% of GBMs but in 95% of classical GBMs [10,40]. Consistently, we found that classical GBMs were more likely to respond to first-line chemotherapy. The association between p16 deletions and enhanced chemosensitivity to adjuvant temozolomide has already been suggested [41]. Several experimental studies have also suggested that p16 expression is associated with chemoresistance in gliomas [42-44]. In order to validate the association between p16 deletion and chemosensitivity, we assessed the impact of p16 deletion in an independent series of patients treated either with radiation therapy alone or with radiation therapy and adjuvant chemotherapy. In this dataset, we observed a benefit of adjuvant chemotherapy in both MGMTP methylated and unmethylated patients when p16 was deleted, whereas this benefit was only observed in MGMTP methylated patients when p16 was not deleted, supporting the association between p16 deletion and chemosensitivity. This also suggests that p16 deletion might be an alternative mechanism of chemosensitivity in MGMTP unmethylated patients and is consistent with our finding that most of the responders to first-line chemotherapy were MGMTP unmethylated.
The present study demonstrates that the response of GBMs to either first-line chemotherapy or radiotherapy relies on different molecular mechanisms. According to their transcriptomic and genomic characteristics, some patients benefit more from chemotherapy and others more from radiotherapy. These results encourage the combination of both treatment strategies to increase the likelihood of treatment response and suggest that prognostic markers could be identified both to predict chemo-or radiotherapy efficacy and to develop new therapeutic strategies.
Competing interests
The authors declare that they have no competing interests.
Authors' contributions
FD and AdR performed the majority of the experiments and analysis. FD, AdR, JH, MS and FB drafted the manuscript. DFB and CC performed the immunohistochemistry study. AI and YM performed the analysis of the independent data set. OC, DFB, LKT, MW, MS, FMV and JH provided the samples. AdR, DSR and ET provided the bioinformatic tools and participated in the analysis. DFB performed the central pathological review. HC and JYD assisted with design of the study and with critical examination of the manuscript. MS and FB conceived of and designed the study, participated in experimental design and interpretation of results and helped edit the manuscript. All authors read and approved the final manuscript.
Supplementary Material
Additional Tables. Table S1. Patients' clinical characteristics, MGMTP status and classification according to the Phillips and Verhaak classifications. Table S2. Centroid-based classifier generating the three groups of gliomas in the present study. Table S3. Complete list of minimal common regions and clones with a p-value <0.05 in responders and non-responders to radiation therapy. Genes located in these loci and their corresponding expression p-values are shown. Table S4. List of 1000 genes most differentially expressed between responders and non-responders to radiotherapy (500 genes up-regulated in responders and 500 genes up-regulated in non-responders). Table S5. List of gene sets with a hypergeometric p-value <0.05 in responders and non-responders to radiotherapy. Table S6. Complete list of minimal common regions and clones with a p-value <0.05 in responders and non-responders to first-line chemotherapy. Genes located in these loci and their corresponding expression p-values are shown. Table S7. List of 1000 genes most differentially expressed between responders and non-responders to first-line chemotherapy (500 genes up-regulated in responders and 500 genes up-regulated in non-responders). Table S8. List of gene sets with a hypergeometric p-value <0.05 in responders and non-responders to first-line chemotherapy.
Additional methods. Additional information regarding gene expression and genome data analysis
Contributor Information
François Ducray, Email: francois.ducray@chu-lyon.fr.
Aurélien de Reyniès, Email: reyniesa@ligue-cancer.net.
Olivier Chinot, Email: olivier.chinot@ap-hm.fr.
Ahmed Idbaih, Email: ahmed.idbaih@gmail.com.
Dominique Figarella-Branger, Email: dominique.figarella-branger@mail.ap-hm.fr.
Carole Colin, Email: carole.colin@univ-med.marseille.fr.
Lucie Karayan-Tapon, Email: l.karayan-tapon@chu-poitiers.fr.
Hervé Chneiweiss, Email: Herve.Chneiweiss@inserm.fr.
Michel Wager, Email: m.wager@chu-poitiers.fr.
François Vallette, Email: Francois.Vallette@univ-nantes.fr.
Yannick Marie, Email: yamarie@ccr.jussieu.fr.
David Rickman, Email: rickmand@ligue-cancer.net.
Emilie Thomas, Email: thomase@ligue-cancer.net.
Jean-Yves Delattre, Email: jean-yves.delattre@psl.aphp.fr.
Jérôme Honnorat, Email: Jerome.honnorat@chu-lyon.fr.
Marc Sanson, Email: marc.sanson@psl.aphp.fr.
François Berger, Email: fberger@ujf-grenoble.fr.
Acknowledgements
We thank F. Petel for his help managing the microarray data database of the CIT3. This work is part of the national program Cartes d'Identité des Tumeurs (CIT) funded and developed by the Ligue Nationale Contre le Cancer.
References
- McLendon R, Friedman A, Bigner D, Van Meir EG, Brat DJ, Marie Mastrogianakis G, Olson JJ, Mikkelsen T, Lehman N, Aldape K. et al. Comprehensive genomic characterization defines human glioblastoma genes and core pathways. Nature. 2008;23;455(7216):1061–8. doi: 10.1038/nature07385. Epub 2008 Sep 4. [DOI] [PMC free article] [PubMed] [Google Scholar]
- Parsons DW, Jones S, Zhang X, Lin JC, Leary RJ, Angenendt P, Mankoo P, Carter H, Siu IM, Gallia GL. et al. An Integrated Genomic Analysis of Human Glioblastoma Multiforme. Science. 2008;321(5897):1807–1812. doi: 10.1126/science.1164382. [DOI] [PMC free article] [PubMed] [Google Scholar]
- Ducray F, Idbaih A, de Reynies A, Bieche I, Thillet J, Mokhtari K, Lair S, Marie Y, Paris S, Vidaud M. et al. Anaplastic oligodendrogliomas with 1p19q codeletion have a proneural gene expression profile. Mol Cancer. 2008;7:41. doi: 10.1186/1476-4598-7-41. [DOI] [PMC free article] [PubMed] [Google Scholar]
- Freije WA, Castro-Vargas FE, Fang Z, Horvath S, Cloughesy T, Liau LM, Mischel PS, Nelson SF. Gene expression profiling of gliomas strongly predicts survival. Cancer Res. 2004;64:6503–6510. doi: 10.1158/0008-5472.CAN-04-0452. [DOI] [PubMed] [Google Scholar]
- Idbaih A, Marie Y, Lucchesi C, Pierron G, Manie E, Raynal V, Mosseri V, Hoang-Xuan K, Kujas M, Brito I. et al. BAC array CGH distinguishes mutually exclusive alterations that define clinicogenetic subtypes of gliomas. Int J Cancer. 2008;122:1778–1786. doi: 10.1002/ijc.23270. [DOI] [PubMed] [Google Scholar]
- Liang Y, Diehn M, Watson N, Bollen AW, Aldape KD, Nicholas MK, Lamborn KR, Berger MS, Botstein D, Brown PO, Israel MA. Gene expression profiling reveals molecularly and clinically distinct subtypes of glioblastoma multiforme. Proc Natl Acad Sci USA. 2005;102:5814–5819. doi: 10.1073/pnas.0402870102. [DOI] [PMC free article] [PubMed] [Google Scholar]
- Nutt CL, Mani DR, Betensky RA, Tamayo P, Cairncross JG, Ladd C, Pohl U, Hartmann C, McLaughlin ME, Batchelor TT. et al. Gene expression-based classification of malignant gliomas correlates better with survival than histological classification. Cancer Res. 2003;63:1602–1607. [PubMed] [Google Scholar]
- Phillips HS, Kharbanda S, Chen R, Forrest WF, Soriano RH, Wu TD, Misra A, Nigro JM, Colman H, Soroceanu L. et al. Molecular subclasses of high-grade glioma predict prognosis, delineate a pattern of disease progression, and resemble stages in neurogenesis. Cancer Cell. 2006;9:157–173. doi: 10.1016/j.ccr.2006.02.019. [DOI] [PubMed] [Google Scholar]
- Shirahata M, Iwao-Koizumi K, Saito S, Ueno N, Oda M, Hashimoto N, Takahashi JA, Kato K. Gene expression-based molecular diagnostic system for malignant gliomas is superior to histological diagnosis. Clin Cancer Res. 2007;13:7341–7356. doi: 10.1158/1078-0432.CCR-06-2789. [DOI] [PubMed] [Google Scholar]
- Verhaak RG, Hoadley KA, Purdom E, Wang V, Qi Y, Wilkerson MD, Miller CR, Ding L, Golub T, Mesirov JP. et al. Integrated genomic analysis identifies clinically relevant subtypes of glioblastoma characterized by abnormalities in PDGFRA, IDH1, EGFR, and NF1. Cancer Cell. 2010;17:98–110. doi: 10.1016/j.ccr.2009.12.020. [DOI] [PMC free article] [PubMed] [Google Scholar]
- French PJ, Swagemakers SM, Nagel JH, Kouwenhoven MC, Brouwer E, van der Spek P, Luider TM, Kros JM, van den Bent MJ, Sillevis Smitt PA. Gene expression profiles associated with treatment response in oligodendrogliomas. Cancer Res. 2005;65:11335–11344. doi: 10.1158/0008-5472.CAN-05-1886. [DOI] [PubMed] [Google Scholar]
- Murat A, Migliavacca E, Gorlia T, Lambiv WL, Shay T, Hamou MF, de Tribolet N, Regli L, Wick W, Kouwenhoven MC. et al. Stem cell-related "self-renewal" signature and high epidermal growth factor receptor expression associated with resistance to concomitant chemoradiotherapy in glioblastoma. J Clin Oncol. 2008;26:3015–3024. doi: 10.1200/JCO.2007.15.7164. [DOI] [PubMed] [Google Scholar]
- Hegi ME, Diserens A-C, Gorlia T, Hamou M-F, de Tribolet N, Weller M, Kros JM, Hainfellner JA, Mason W, Mariani L. et al. MGMT Gene Silencing and Benefit from Temozolomide in Glioblastoma. N Engl J Med. 2005;352:997–1003. doi: 10.1056/NEJMoa043331. [DOI] [PubMed] [Google Scholar]
- Stupp R, Mason WP, van den Bent MJ, Weller M, Fisher B, Taphoorn MJ, Belanger K, Brandes AA, Marosi C, Bogdahn U. et al. Radiotherapy plus concomitant and adjuvant temozolomide for glioblastoma. N Engl J Med. 2005;352:987–996. doi: 10.1056/NEJMoa043330. [DOI] [PubMed] [Google Scholar]
- Macdonald DR, Cascino TL, Schold SC Jr, Cairncross JG. Response criteria for phase II studies of supratentorial malignant glioma. J Clin Oncol. 1990;8:1277–1280. doi: 10.1200/JCO.1990.8.7.1277. [DOI] [PubMed] [Google Scholar]
- Criniere E, Kaloshi G, Laigle-Donadey F, Lejeune J, Auger N, Benouaich-Amiel A, Everhard S, Mokhtari K, Polivka M, Delattre JY. et al. MGMT prognostic impact on glioblastoma is dependent on therapeutic modalities. J Neurooncol. 2007;83:173–179. doi: 10.1007/s11060-006-9320-0. [DOI] [PubMed] [Google Scholar]
- Irizarry RA, Bolstad BM, Collin F, Cope LM, Hobbs B, Speed TP. Summaries of Affymetrix GeneChip probe level data. Nucleic Acids Res. 2003;31:e15. doi: 10.1093/nar/gng015. [DOI] [PMC free article] [PubMed] [Google Scholar]
- Boyault S, Rickman DS, de Reynies A, Balabaud C, Rebouissou S, Jeannot E, Herault A, Saric J, Belghiti J, Franco D. et al. Transcriptome classification of HCC is related to gene alterations and to new therapeutic targets. Hepatology. 2007;45:42–52. doi: 10.1002/hep.21467. [DOI] [PubMed] [Google Scholar]
- Rouveirol C, Stransky N, Hupe P, Rosa PL, Viara E, Barillot E, Radvanyi F. Computation of recurrent minimal genomic alterations from array-CGH data. Bioinformatics. 2006;22:849–856. doi: 10.1093/bioinformatics/btl004. [DOI] [PubMed] [Google Scholar]
- Houillier C, Lejeune J, Benouaich-Amiel A, Laigle-Donadey F, Criniere E, Mokhtari K, Thillet J, Delattre JY, Hoang-Xuan K, Sanson M. Prognostic impact of molecular markers in a series of 220 primary glioblastomas. Cancer. 2006;106:2218–2223. doi: 10.1002/cncr.21819. [DOI] [PubMed] [Google Scholar]
- Nigro JM, Misra A, Zhang L, Smirnov I, Colman H, Griffin C, Ozburn N, Chen M, Pan E, Koul D. et al. Integrated array-comparative genomic hybridization and expression array profiles identify clinically relevant molecular subtypes of glioblastoma. Cancer Res. 2005;65:1678–1686. doi: 10.1158/0008-5472.CAN-04-2921. [DOI] [PubMed] [Google Scholar]
- Carpentier AF, Meng Y. Recent advances in immunotherapy for human glioma. Curr Opin Oncol. 2006;18:631–636. doi: 10.1097/01.cco.0000245321.34658.f4. [DOI] [PubMed] [Google Scholar]
- Linos E, Raine T, Alonso A, Michaud D. Atopy and risk of brain tumors: a meta-analysis. J Natl Cancer Inst. 2007;99:1544–1550. doi: 10.1093/jnci/djm170. [DOI] [PubMed] [Google Scholar]
- Schwartzbaum JA, Huang K, Lawler S, Ding B, Yu J, Chiocca EA. Allergy and inflammatory transcriptome is predominantly negatively correlated with CD133 expression in glioblastoma. Neuro Oncol. 2010;12:320–327. doi: 10.1093/neuonc/nop035. [DOI] [PMC free article] [PubMed] [Google Scholar]
- Hockel M, Vaupel P. Tumor hypoxia: definitions and current clinical, biologic, and molecular aspects. J Natl Cancer Inst. 2001;93:266–276. doi: 10.1093/jnci/93.4.266. [DOI] [PubMed] [Google Scholar]
- Louis DN. Molecular pathology of malignant gliomas. Annu Rev Pathol. 2006;1:97–117. doi: 10.1146/annurev.pathol.1.110304.100043. [DOI] [PubMed] [Google Scholar]
- Heddleston JM, Li Z, McLendon RE, Hjelmeland AB, Rich JN. The hypoxic microenvironment maintains glioblastoma stem cells and promotes reprogramming towards a cancer stem cell phenotype. Cell Cycle. 2009;8:3274–3284. doi: 10.4161/cc.8.20.9701. [DOI] [PMC free article] [PubMed] [Google Scholar]
- Chi JT, Wang Z, Nuyten DS, Rodriguez EH, Schaner ME, Salim A, Wang Y, Kristensen GB, Helland A, Borresen-Dale AL. et al. Gene expression programs in response to hypoxia: cell type specificity and prognostic significance in human cancers. PLoS Med. 2006;3:e47. doi: 10.1371/journal.pmed.0030047. [DOI] [PMC free article] [PubMed] [Google Scholar]
- Spence AM, Muzi M, Swanson KR, O'Sullivan F, Rockhill JK, Rajendran JG, Adamsen TC, Link JM, Swanson PE, Yagle KJ. et al. Regional Hypoxia in Glioblastoma Multiforme Quantified with [18F]Fluoromisonidazole Positron Emission Tomography before Radiotherapy: Correlation with Time to Progression and Survival. Clin Cancer Res. 2008;14:2623–2630. doi: 10.1158/1078-0432.CCR-07-4995. [DOI] [PMC free article] [PubMed] [Google Scholar]
- Evans SM, Judy KD, Dunphy I, Jenkins WT, Hwang WT, Nelson PT, Lustig RA, Jenkins K, Magarelli DP, Hahn SM. et al. Hypoxia is important in the biology and aggression of human glial brain tumors. Clin Cancer Res. 2004;10:8177–8184. doi: 10.1158/1078-0432.CCR-04-1081. [DOI] [PubMed] [Google Scholar]
- Simon JM, Noel G, Chiras J, Hoang-Xuan K, Delattre JY, Baillet F, Mazeron JJ. Radiotherapy and chemotherapy with or without carbogen and nicotinamide in inoperable biopsy-proven glioblastoma multiforme. Radiother Oncol. 2003;67:45–51. doi: 10.1016/S0167-8140(03)00007-0. [DOI] [PubMed] [Google Scholar]
- Plate KH, Breier G, Weich HA, Risau W. Vascular endothelial growth factor is a potential tumour angiogenesis factor in human gliomas in vivo. Nature. 1992;359:845–848. doi: 10.1038/359845a0. [DOI] [PubMed] [Google Scholar]
- Shweiki D, Itin A, Soffer D, Keshet E. Vascular endothelial growth factor induced by hypoxia may mediate hypoxia-initiated angiogenesis. Nature. 1992;359:843–845. doi: 10.1038/359843a0. [DOI] [PubMed] [Google Scholar]
- Jain RK, di Tomaso E, Duda DG, Loeffler JS, Sorensen AG, Batchelor TT. Angiogenesis in brain tumours. Nat Rev Neurosci. 2007;8:610–622. doi: 10.1038/nrn2175. [DOI] [PubMed] [Google Scholar]
- Duda DG, Jain RK, Willett CG. Antiangiogenics: the potential role of integrating this novel treatment modality with chemoradiation for solid cancers. J Clin Oncol. 2007;25:4033–4042. doi: 10.1200/JCO.2007.11.3985. [DOI] [PMC free article] [PubMed] [Google Scholar]
- Jain RK. Normalization of tumor vasculature: an emerging concept in antiangiogenic therapy. Science. 2005;307:58–62. doi: 10.1126/science.1104819. [DOI] [PubMed] [Google Scholar]
- Liu G, Yuan X, Zeng Z, Tunici P, Ng H, Abdulkadir IR, Lu L, Irvin D, Black KL, Yu JS. Analysis of gene expression and chemoresistance of CD133+ cancer stem cells in glioblastoma. Mol Cancer. 2006;5:67. doi: 10.1186/1476-4598-5-67. [DOI] [PMC free article] [PubMed] [Google Scholar]
- Salmaggi A, Boiardi A, Gelati M, Russo A, Calatozzolo C, Ciusani E, Sciacca FL, Ottolina A, Parati EA, La Porta C. et al. Glioblastoma-derived tumorospheres identify a population of tumor stem-like cells with angiogenic potential and enhanced multidrug resistance phenotype. Glia. 2006;54:850–860. doi: 10.1002/glia.20414. [DOI] [PubMed] [Google Scholar]
- Bleau AM, Hambardzumyan D, Ozawa T, Fomchenko EI, Huse JT, Brennan CW, Holland EC. PTEN/PI3K/Akt pathway regulates the side population phenotype and ABCG2 activity in glioma tumor stem-like cells. Cell Stem Cell. 2009;4:226–235. doi: 10.1016/j.stem.2009.01.007. [DOI] [PMC free article] [PubMed] [Google Scholar]
- Ohgaki H, Kleihues P. Genetic pathways to primary and secondary glioblastoma. Am J Pathol. 2007;170:1445–1453. doi: 10.2353/ajpath.2007.070011. [DOI] [PMC free article] [PubMed] [Google Scholar]
- Wemmert S, Ketter R, Rahnenfuhrer J, Beerenwinkel N, Strowitzki M, Feiden W, Hartmann C, Lengauer T, Stockhammer F, Zang KD. et al. Patients with high-grade gliomas harboring deletions of chromosomes 9p and 10q benefit from temozolomide treatment. Neoplasia. 2005;7:883–893. doi: 10.1593/neo.05307. [DOI] [PMC free article] [PubMed] [Google Scholar]
- Gomez-Manzano C, Lemoine MG, Hu M, He J, Mitlianga P, Liu TJ, Yung AW, Fueyo J, Groves MD. Adenovirally-mediated transfer of E2F-1 potentiates chemosensitivity of human glioma cells to temozolomide and BCNU. Int J Oncol. 2001;19:359–365. doi: 10.3892/ijo.19.2.359. [DOI] [PubMed] [Google Scholar]
- Hama S, Heike Y, Naruse I, Takahashi M, Yoshioka H, Arita K, Kurisu K, Goldman CK, Curiel DT, Saijo N. Adenovirus-mediated p16 gene transfer prevents drug-induced cell death through G1 arrest in human glioma cells. Int J Cancer. 1998;77:47–54. doi: 10.1002/(SICI)1097-0215(19980703)77:1<47::AID-IJC9>3.0.CO;2-#. [DOI] [PubMed] [Google Scholar]
- Weller M, Rieger J, Grimmel C, Van Meir EG, De Tribolet N, Krajewski S, Reed JC, von Deimling A, Dichgans J. Predicting chemoresistance in human malignant glioma cells: the role of molecular genetic analyses. Int J Cancer. 1998;79:640–644. doi: 10.1002/(SICI)1097-0215(19981218)79:6<640::AID-IJC15>3.0.CO;2-Z. [DOI] [PubMed] [Google Scholar]
Associated Data
This section collects any data citations, data availability statements, or supplementary materials included in this article.
Supplementary Materials
Additional Tables. Table S1. Patients' clinical characteristics, MGMTP status and classification according to the Phillips and Verhaak classifications. Table S2. Centroid-based classifier generating the three groups of gliomas in the present study. Table S3. Complete list of minimal common regions and clones with a p-value <0.05 in responders and non-responders to radiation therapy. Genes located in these loci and their corresponding expression p-values are shown. Table S4. List of 1000 genes most differentially expressed between responders and non-responders to radiotherapy (500 genes up-regulated in responders and 500 genes up-regulated in non-responders). Table S5. List of gene sets with a hypergeometric p-value <0.05 in responders and non-responders to radiotherapy. Table S6. Complete list of minimal common regions and clones with a p-value <0.05 in responders and non-responders to first-line chemotherapy. Genes located in these loci and their corresponding expression p-values are shown. Table S7. List of 1000 genes most differentially expressed between responders and non-responders to first-line chemotherapy (500 genes up-regulated in responders and 500 genes up-regulated in non-responders). Table S8. List of gene sets with a hypergeometric p-value <0.05 in responders and non-responders to first-line chemotherapy.
Additional methods. Additional information regarding gene expression and genome data analysis