Abstract
Motivation: The availability of flexible open source software for the analysis of gene expression raw level data has greatly facilitated the development of widely used preprocessing methods for these technologies. However, the expansion of microarray applications has exposed the limitation of existing tools.
Results: We developed the oligo package to provide a more general solution that supports a wide range of applications. The package is based on the BioConductor principles of transparency, reproducibility and efficiency of development. It extends the existing tools and leverages existing code for visualization, accessing data and widely used preprocessing routines. The oligo package implements a unified paradigm for preprocessing data and interfaces with other BioConductor tools for downstream analysis. Our infrastructure is general and can be used by other BioConductor packages.
Availability: The oligo package is freely available through BioConductor, http://www.bioconductor.org.
Contact: benilton.carvalho@cancer.org.uk; rafa@jhu.edu
Supplementary information: Supplementary data are available at Bioinformatics online.
1 INTRODUCTION
Open source software significantly simplified the development and distribution of preprocessing methods for gene expression microarrays. The BioConductor project (Gentleman et al., 2004) is one hub of tools for the analysis of genomic data and distributes, among others, the affy package (Gautier et al., 2004), the most used tool for analysis of Affymetrix gene expression arrays. In addition to Affymetrix, other manufacturers (e.g. Illumina, NimbleGen and Agilent) also commercialize microarray solutions, increasing the number of applications of the technology.
With different microarray applications, the investigator can analyze genomic data from different perspectives: Gitan et al. (2002) use tiling arrays to identify, at high resolution, regions of DNA and histone modifications; The International HapMap Consortium (2003) uses genome-wide single nucleotide polymorphism (SNP) and copy number variant (CNV) arrays to obtain: (i) genotype calls, later used in association studies; and (ii) extract copy number estimates to assess chromosomal aberrations; Clark et al. (2007) use exon arrays to analyze alternative splicing. As new applications became available and designs by other manufacturers became more popular (see Supplementary Material), users developed suboptimal solutions to allow the use of the existing code in affy on these new arrays. This strategy did not succeed because the new designs did not share the structure used by the Affymetrix gene expression arrays, such as density and array annotation standards.
Based on the BioConductor principles of transparency, reproducibility and efficiency of development, we developed the oligo package. Its infrastructure, presented in Section 2, is general and can be used by other BioConductor packages. The package natively supports feature-level data for different applications and manufacturers, as shown in Section 3. It implements a unified framework for preprocessing microarray data and interfaces with other BioConductor tools for downstream analysis.
2 INFRASTRUCTURE
The package contains structures to simplify usage and interaction with other packages. A clear distinction is made between feature-level, summarized and annotation data, and this is reflected by the different classes that are implemented using the S4 scheme intrinsic to the R environment.
Before importing data, the researcher must have the respective annotation package already installed in the system. The annotation package provides array coordinates, feature types, sequences, feature names and other relevant information for preprocessing. Affymetrix shares these data using a number of file suffixes: CDF (expression and SNP arrays), BPMAP (tiling arrays) and PGF + CLF (exon and gene arrays). NimbleGen distributes their annotations through NimbleGen Design Files (NDFs), regardless of the array type, but an additional position (POS) file, containing up-to-date genomic coordinates, is not uncommon. Table 1 describes the suffixes used by some manufacturers, and we note that oligo currently supports Affymetrix and NimbleGen arrays. Using the annotation files provided by the manufacturer, the researcher can create the annotation package using the pdInfoBuilder BioConductor package.
Table 1.
File suffixes used by manufacturers for different array types
| Manufacturer | Intensities | Design | Type |
|---|---|---|---|
| Affymetrix | CEL | CDF | Expression/SNP |
| PGF + CLF | exon/gene | ||
| BPMAP | tiling | ||
| Agilent | GPR | GAL | All |
| Illumina | TXT | BPM | All |
| NimbleGen | XYS | NDF | All |
The raw data files contain observed fluorescence intensities used in analysis; the design files provide information specific to the array, such as dimensions, physical locations, probe types and sequences. Currently, oligo supports Affymetrix and NimbleGen arrays.
Bolstad et al. (2003); Carvalho et al. (2007, 2010); Irizarry et al. (2003a, 2006a, b, 2008); Ritchie et al. (2009); Scharpf et al. (2008) show significant improvements on the results when alternative algorithms are used as replacement for the solutions provided by the manufacturers. In fact, the novel methodologies described by Carvalho et al. (2007); Irizarry et al. (2008); Scharpf et al. (2008) use early versions of the oligo package hereby described to implement their solutions. Regardless of the application, these depend on two factors: (i) the ability to access the data at the rawest possible level, after image processing (which is beyond the scope of this material); and (ii) the existence of an environment that provides analysis and visualization tools. The manufacturers whose products are currently supported by oligo provide these data using CEL (Affymetrix) and XYS (NimbleGen) files. These files supply array coordinates and observed intensities, which can be easily imported with oligo after installing the associated annotation package created by pdInfoBuilder.
The oligo package implements multiple classes to manage raw intensities. They are used to differentiate data originating from different applications, such as gene expression versus exon data. Because the same method can behave differently when applied to objects of distinct applications, we make use of this feature to increase the flexibility of the package. From the eSet class defined in Biobase, we created the FeatureSet class, the template for feature-level data subclasses. Each application has its own FeatureSet subclass, as shown in Table 2. We make no distinction in terms of the manufacturer: data generated on chips of the same application, even from different manufacturers, will belong to the same FeatureSet extension. This unified framework increases productivity, because the preprocessing steps for arrays on the same application are essentially the same, regardless of the manufacturer.
Table 2.
Raw data and annotation classes used by the oligo package
| FeatureSet class | PDInfo class | Arrays |
|---|---|---|
| ExpressionFeatureSet | ExpressionPDInfo | Expression |
| ExonFeatureSet | ExonPDInfo | Exon |
| GeneFeatureSet | GenePDInfo | Gene |
| SnpFeatureSet | SnpPDInfo | SNP |
| SnpCnvFeatureSet | SnpCnvPDInfo | SNP+CNV |
| TilingFeatureSet | TilingPDInfo | Tiling |
This infrastructure is beneficial for both developers and end-users. Developers can use oligo solutions to facilitate the integration of their tools with BioConductor. The researcher benefits from the unified model that the package makes available, as the consistency in data delivery and handling improves efficiency.
3 APPLICATIONS
In this section, we use the oligo package with data of different types. We demonstrate its use to preprocess gene expression data in Section 3.1. Section 3.2 shows how it can be used to obtain genotype calls from SNP arrays. In Section 3.3, we show how it can be used to preprocess exon data at both exon and transcript levels. Section 3.4 uses data from tiling arrays to show how objects created by oligo can be used with methods defined by other BioConductor packages. The Supplementary Material contains the actual code used in these examples.
3.1 Preprocessing expression arrays
After loading oligo, the user identifies the CEL or XYS files that represent the study in question. This is done with the list.celfiles or list.xysfiles functions. These functions accept the same arguments as list.files.
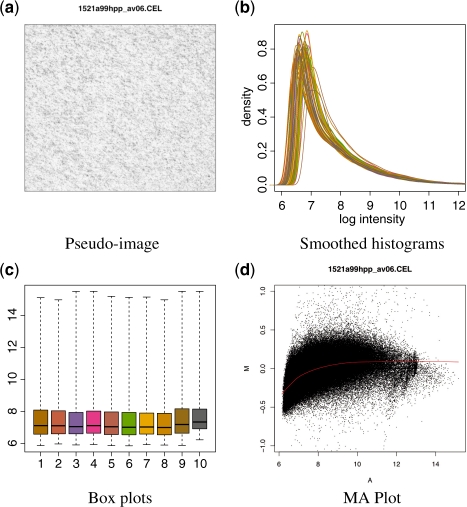
The read.celfiles and read.xysfiles functions import the CEL and XYS files into the R session. The returned object belongs to one of the FeatureSet classes shown in Table 2 and represents the raw data. These objects can be visualized through different strategies: Figure 1 shows, respectively, the pseudo-image, smoothed histograms, boxplots and MA plot for the Latin Square data on the Human Genome U95 array, made available by Affymetrix. Figure1a–d are produced, respectively, with the image, hist, boxplot and MAplot methods.
Fig. 1.
The oligo package provides several tools for the visualization of raw data, represented in the package through the FeatureSet subclasses. In (a), the pseudo-image can be used to visually inspect the data for spatial artifacts. Using oligo, one can produce such figures using the image method. (b) shows the smoothed histogram, implemented in oligo via the hist method, providing a way to compare the distribution of intensities across multiple samples. In (c), we show boxplots generated with the boxplot method, also used to assess the data distribution. The MAplot method can be used to generate the MA plot shown in (d), used to assess the dependency of log-ratios on the average log-intensity of the data.
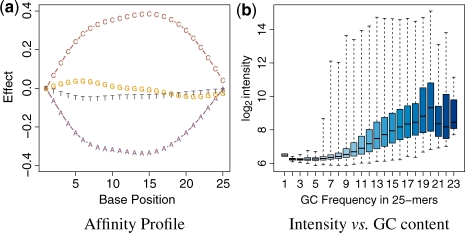
The oligo package is tightly integrated with important BioConductor tools. Probe sequences are stored using the DNAStringSet objects, defined in the Biostrings package. This allows a compact representation of the data and simplifies the interfacing with other tools. The getBaseProfile and getAffinitySplineCoefficients functions can be combined to obtain the affinity profile shown in Figure 2a. The alphabetFrequency method in Biostrings is easily used with the pm method in oligo to show the dependency of log2 intensities on GC content, as shown in Figure 2b.
Fig. 2.
The package is tightly integrated with other BioConductor tools to improve the user experience. (a) shows the affinity profile, which can be produced with oligo. In this figure, we can easily observe the clear interaction of nucleotide and position on the log2-intensity. For (b), storing sequence information using the DNAStringSet class in Biostrings provides a compact representation of the data and allow efficient calculation, as shown above with the log2-intensity boxplot stratified by GC content.
Expression data can be preprocessed using RMA (Irizarry et al., 2003a, b) by applying the rma method to the ExpressionFeatureSet object. The data will be background corrected (if the background argument is set to TRUE), quantile normalized (if the normalize argument is TRUE) and summarized using the median-polish. The resulting object is an ExpressionSet, defined by the Biobase package. The Supplementary Material shows one detailed example of how to use oligo to preprocess the expression data.
3.2 Obtaining genotype calls from SNP arrays
Carvalho et al. (2007) describe the Corrected Robust Linear Model with Maximum likelihood distance (CRLMM) algorithm to genotype SNP arrays. This method is implemented in oligo and, to use it, the investigator needs the annotation data package specific to the design used in the experiment. These annotation packages are available through the BioConductor website and, because they contain hand-curated data, we recommend users refrain from creating (with the pdInfoBuilder package) their own annotation packages for SNP chips. Table 3 describes the supported designs and the respective annotation packages.
Table 3.
SNP array designs currently supported by the oligo package and their respective annotation packages
| Design | Annotation Package |
|---|---|
| Mapping 50K XBA | pd.mapping50k.xba240 |
| Mapping 50K HIND | pd.mapping50k.hind240 |
| Mapping 250K NSP | pd.mapping250k.nsp |
| Mapping 250K STY | pd.mapping250k.sty |
| Genomewide SNP 5.0 | pd.genomewidesnp.5 |
| Genomewide SNP 6.0 | pd.genomewidesnp.6 |
These annotation packages are made available through the BioConductor website and contain hand-curated data, required by the CRLMM algorithm.
To demonstrate its genotyping capability, we use 269 CEL files on the XBA array, available on the HapMap website. The crlmm function requires the CEL file names and an output directory, where the results are stored. The output directory must not exist prior to the call and the software will take care of this task. The crlmm function is applied directly on the CEL files, to minimize the memory footprint. A detailed demonstration on how to use crlmm is shown in the Supplementary Material.
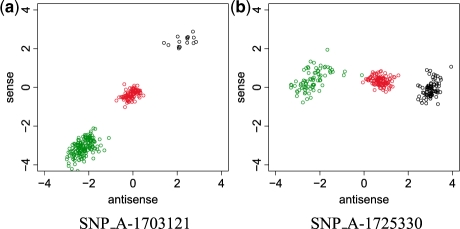
The getCrlmmSummaries function reads the results obtained by CRLMM back into the R session. The calls and confs methods are accessors to genotype calls and confidence values. Calls are coded as integers 1 (AA), 2 (AB) and 3 (BB). The confidence score is the estimated probability that the algorithm made the right call. The plotM function provides the visualization of the results, as Figure 3a and b show.
Fig. 3.
Log-ratio data used by CRLMM for genotype calling, which can be seriously affected by probe effects. In this plot, genotype calls provided by oligo are represented in different colors (black, AA; red, AB; green, BB) and each point represents one sample. SNP_A-1703121 shows significant discrimination on both strands and, as competing algorithms, CRLMM has excellent performance on similar scenarios. SNP_A-1725330 presents poor discrimination on the sense strand, because CRLMM does not average across strands, it can successfully predict the genotype calls. In comparable situations, competing algorithms are known to fail.
3.3 Preprocessing exon arrays
The oligo package also supports the Affymetrix exon and gene arrays. Their annotation packages are available via BioConductor. These chips are extensions of the 3′ IVT expression arrays and, as such, users are often interested in preprocessing them using the RMA algorithm. With these designs, the researcher can use oligo to obtain RMA summaries at exon and transcript levels.
The read.celfiles function imports any CEL file. The software identifies specifically if the files refer to exon or gene arrays and returns an object of the appropriate class. Raw data visualization can also be performed using the techniques presented in Section 3.1.
Similarly, the rma method provides RMA summaries and, in the case of the exon and gene arrays, accepts one extra argument: target. The possible values for target are probeset, core, extended and full. The first value will allow summarization to the exon level; the other three provide summarization to the gene level, using the Affymetrix definition of meta probesets.
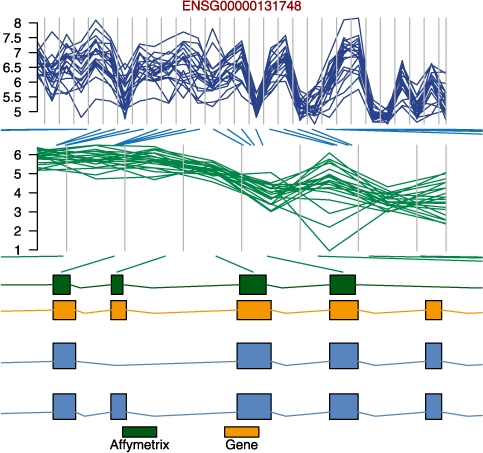
The flexibility of oligo and its annotation packages allows integration with other BioConductor tools. Below, we use the biomaRt, Biostrings, BSgenome and GenomeGraphs packages to obtain more information on probesets and to visualize the results (see Fig. 4) at a specific genomic location. The Supplementary Material shows detailed information on how to combine sequence information obtained through oligo to get updated genomic coordinates by sequence alignment using the Biostrings and BSgenome packages.
Fig. 4.

Visual representation of the observed log2-intensities and summarized data at the exon level for a fragment of gene ENSG00000131748. On the top panel of the figure, each line represents one different sample; the vertical bins represent the start and end positions for each probe (first subfigure) and probeset (second subfigure). On the bottom panel, the block diagram shows the probes, gene and transcript, respectively, in green, orange and blue. Here, the oligo, biomaRt, Biostrings, BSgenome and GenomeGraphs packages were used together to provide an improved visualization of the data at a specific genomic location.
3.4 Interfacing with ACME to find enriched regions using tiling arrays
The oligo package handles tiling data from both Affymetrix and NimbleGen, as long as the annotation packages are created through the pdInfoBuilder package and installed in the system.
The functions read.celfiles2 and read.xysfiles2 can be used to import the data into the R session. The difference between read.celfiles/read.xysfiles and read.celfiles2/read.xysfiles2 is that the former reads in the data as one-channel data and the latter reads it in as two-channel data. The getNgsColorsInfo function parses the names of the XYS files and returns an object with suggested channels and sample names that can be combined with read.xysfiles2.
Using ChIP-chip data provided by NimbleGen, we use oligo to import the XYS files and combine their contents to create an object that can be used with the ACME package. The ACME package calculates enrichment, using algorithms that are insensitive to normalization strategies and array noise. We refer the interested user to the Supplementary Material, which contains detailed information on the use of oligo interfacing the ACME package. For this example dataset, we show below some enriched regions (flagged with TF = TRUE) found on Chromosome 1 for Sample 1:

4 DISCUSSION
The integration of data management, visualization and analysis is essential in current research. Weaknesses in existing tools are more evident today that more applications and array manufacturers are available. To overcome the deficiencies introduced by suboptimal solutions and improve the delivery of original strategies, we developed the oligo package. It uses the commonalities of oligonucleotide microarray designs and applications to provide an open-source solution that centralizes the preprocessing tasks under a solid framework that can be reused by other developers, improving the consistency between packages within the BioConductor project.
The structure used by oligo is flexible and its objects inherit the properties of Biobase objects, using the standards set by the BioConductor project. Because it is implemented in R, every feature of this statistical software is at the researcher's disposal. This simplifies the interface with many other packages from both projects (R and BioConductor), widening the options during analysis. Classes used by its companion, the pdInfoBuilder package, are based on a broader class, offering inheritability properties and transparency to the user, who benefits from the fact that annotation packages use SQL databases to minimize their memory footprint.
The oligo and affy packages are closely related: the former uses the knowledge acquired by the latter to provide solutions for limitations found so far. The main improvements offered by oligo are: (i) support to multiple vendors and platforms; (ii) efficient storage and access schemes for annotation of current high-throughput arrays, whose metadata have become significantly large; and (iii) native support to manufacturer files.
Using oligo, one can handle data from different applications (expression, tiling, SNP/CNV, exon and gene) of two manufacturers (Affymetrix and NimbleGen), using their native file schemes, avoiding potential problems introduced by conversion tools. We demonstrated how one can use our package to preprocess and visualize oligonucleotide microarray data. We show how the package can serve as an interface between the data files and methodologies implemented by other BioConductor packages. These features define a unified framework that allows the efficient use of the environment set by both R and BioConductor projects and increase the productivity of novel methods and algorithms.
Supplementary Material
ACKNOWLEDGEMENTS
Robert Gentleman, Wolfgang Huber, Martin Morgan, Seth Falcon, Marc Carlson, Vincent Carey, Robert Scharpf and James MacDonald for insights, comments and lengthy discussions on the package implementation. Ming-Wen An for suggestions that significantly improved the readability of the manuscript. Marvin Newhouse and Jiong Yang for all the help with the computational environment.
Funding: Doctoral scholarship awarded by the Brazilian Funding Agency CAPES (Coordenação de Aprimoramento Pessoal de Nível Superior) and National Institutes of Health grants R01RR021967 and P41HG004059.
Conflict of Interest: none declared.
REFERENCES
- Bolstad BM, et al. A comparison of normalization methods for high density oligonucleotide array data based on variance and bias. Bioinformatics. 2003;19:185–193. doi: 10.1093/bioinformatics/19.2.185. [DOI] [PubMed] [Google Scholar]
- Carvalho BS, et al. Exploration, normalization, and genotype calls of high-density oligonucleotide SNP array data. Biostatistics. 2007;8:485–499. doi: 10.1093/biostatistics/kxl042. [DOI] [PubMed] [Google Scholar]
- Carvalho BS, et al. Quantifying uncertainty in genotype calls. Bioinformatics. 2010;26:242–249. doi: 10.1093/bioinformatics/btp624. [DOI] [PMC free article] [PubMed] [Google Scholar]
- Clark TA, et al. Discovery of tissue-specific exons using comprehensive human exon microarrays. Genome Biol. 2007;8:R64. doi: 10.1186/gb-2007-8-4-r64. [DOI] [PMC free article] [PubMed] [Google Scholar]
- Gautier L, et al. affy—analysis of affymetrix genechip data at the probe level. Bioinformatics. 2004;20:307–315. doi: 10.1093/bioinformatics/btg405. [DOI] [PubMed] [Google Scholar]
- Gentleman RC, et al. Bioconductor: open software development for computational biology and bioinformatics. Genome Biol. 2004;5:R80. doi: 10.1186/gb-2004-5-10-r80. [DOI] [PMC free article] [PubMed] [Google Scholar]
- Gitan RS, et al. Methylation-specific oligonucleotide microarray: a new potential for high-throughput methylation analysis. Genome Res. 2002;12:158–164. doi: 10.1101/gr.202801. [DOI] [PMC free article] [PubMed] [Google Scholar]
- Irizarry RA, et al. Comprehensive high-throughput arrays for relative methylation (CHARM) Genome Res. 2008;18:780–790. doi: 10.1101/gr.7301508. [DOI] [PMC free article] [PubMed] [Google Scholar]
- Irizarry R, et al. Exploration, normalization, and summaries of high density oligonucleotide array probe level data. Biostatistics. 2003a;4:249–264. doi: 10.1093/biostatistics/4.2.249. [DOI] [PubMed] [Google Scholar]
- Irizarry R, et al. Use of mixture models in a microarray-based screening procedure for detecting differentially represented yeast mutants. Stat. Appl. Genet. Mol. Biol. 2003b;2 doi: 10.2202/1544-6115.1002. Article1. [DOI] [PubMed] [Google Scholar]
- Irizarry R, et al. Comparison of affymetrix genechip expression measures. Bioinformatics. 2006a;22:789–794. doi: 10.1093/bioinformatics/btk046. [DOI] [PubMed] [Google Scholar]
- Irizarry R, et al. Feature-level exploration of a published affymetrix genechip control dataset. Genome Biol. 2006b;7:404. doi: 10.1186/gb-2006-7-8-404. [DOI] [PMC free article] [PubMed] [Google Scholar]
- Ritchie ME, et al. R/Bioconductor software for Illumina's Infinium whole-genome genotyping BeadChips. Bioinformatics. 2009;25:2621–2623. doi: 10.1093/bioinformatics/btp470. [DOI] [PMC free article] [PubMed] [Google Scholar]
- Scharpf RB, et al. Hidden Markov models for the assessment of chromosomal alterations using high-throughput SNP arrays. Ann. Appl. Stat. 2008;2:687–713. doi: 10.1214/07-AOAS155. [DOI] [PMC free article] [PubMed] [Google Scholar]
- The International HapMap Consortium. The International HapMap Project. Nature. 2003;426:789–796. doi: 10.1038/nature02168. [DOI] [PubMed] [Google Scholar]
Associated Data
This section collects any data citations, data availability statements, or supplementary materials included in this article.


