

Abstract
The initiation of axonal filopodia is the first step in the formation of collateral branches and synaptic structures. In sensory neurons, nerve growth factor (NGF) promotes the formation of axonal filopodia and branches. However, the signaling and cytoskeletal mechanisms of NGF-induced initiation of axonal filopodia are not clear. Axonal filopodia arise from precursor axonal cytoskeletal structures termed filamentous actin (F-actin) patches. Patches form spontaneously and are transient. Although filopodia emerge from patches, only a fraction of patches normally gives rise to filopodia. Using chicken sensory neurons and live imaging of enhanced yellow fluorescent protein (eYFP)–actin dynamics, we report that NGF promotes the formation of axonal filopodia by increasing the rate of F-actin patch formation but not the fraction of patches that give rise to filopodia. We also demonstrate that activation of the phosphatidylinositol 3-kinase (PI3K)–Akt pathway is sufficient and required for driving the formation of axonal F-actin patches, filopodia, and axon branches. Using the green fluorescent protein–plekstrin homology domain of Akt, which targets to PI3K-generated phosphatidylinositol-3,4,5-triphosphate (PIP3), we report localized microdomains of PIP3 accumulation that form in synchrony with F-actin patches and that NGF promotes the formation of microdomains of PIP3 and patches. Finally, we find that, in NGF, F-actin patches form in association with axonal mitochondria and oxidative phosphorylation is required for patch formation. This investigation demonstrates that surprisingly NGF promotes formation of axonal filopodia by increasing the formation of cytoskeletal filopodial precursors (patches) through localized microdomains of PI3K signaling but not the emergence of filopodia from patches.
Introduction
The axon is characterized by a cytoskeleton consisting of a prominent array of microtubules and neurofilaments but sparse actin filaments [filamentous actin (F-actin)] and minimal protrusive activity (for review, see Letourneau, 2009). The shaft of the axon forms behind the advancing growth cone through the process of consolidation, which suppresses protrusive activity and maintains the growth cone polarized at the tip of the axon (Dent and Gertler, 2003). Filopodia are finger-like protrusions that form through polymerization and reorganization of the axonal F-actin cytoskeleton (Steketee et al., 2001; Svitkina et al., 2003; Faix et al., 2009). The formation of filopodia from the axon is the first step in the generation of axon collateral branches and synaptic structures. Extracellular signals, including neurotrophins, regulate the formation of filopodia, branches, and synapses (Cohen-Cory and Fraser, 1995; Bastmeyer and O'Leary, 1996 Takei and Nawa, 1998; Gallo and Letourneau, 2000; Kalil et al., 2000; Dent et al., 2003; Dwivedy et al., 2007; Yoshihara et al., 2009). However, a coherent understanding of the spatiotemporal dynamics of the cytoskeletal reorganization underlying the formation axonal filopodia is lacking.
The defining characteristic of filopodia is a bundle of F-actin that supports and drives the extension of the filopodium. Recent studies have determined that axonal and dendritic filopodia emerge from precursor F-actin structures (Lau et al., 1999; Andersen et al., 2005; Loudon et al., 2006; Korobova and Svitkina, 2008; Mingorance-Le Meur and O'Connor, 2009), which in embryonic sensory neurons we have termed “axonal F-actin patches” (Loudon et al., 2006; Gallo, 2006). F-actin patches are localized accumulations of F-actin that form spontaneously, grow in size, and eventually dissipate. Filopodia arise from patches, but only a subset of patches gives rise to filopodia. Thus, the cytoskeletal reorganization leading to formation of filopodia from the axon precedes the emergence of the filopodium.
Phosphoinositide 3-kinase (PI3K) is activated by nerve growth factor (NGF) signaling through the TrkA receptor (Soltoff et al., 1992), and inhibition of PI3K prevents NGF-induced filopodial formation (Gallo and Letourneau, 1998). PI3K regulates the dynamics of dendritic filopodia in response to neurotrophins (Luikart et al., 2008) and the branching of axons and dendrites (Jaworski et al., 2005; Kwon et al., 2006; Drinjakovic et al., 2010), presumably through regulation of F-actin by downstream signaling components (e.g., Akt, Rac1 GTPase, ERM proteins) (Cosker and Eickholt, 2007). However, the specific roles of PI3K in regulating the cytoskeletal dynamics leading to formation of filopodia from the axon shaft remain to be elucidated. We report that localized microdomains of axonal PI3K activity drive the formation of axonal F-actin patches and show that NGF increases the formation of axonal filopodia by signaling through PI3K–Akt to promote the rate of formation of F-actin patches but surprisingly not the emergence of filopodia from F-actin patches. Collectively, the results place PI3K as a major determinant of the formation of axonal filopodia from the earliest stage of the cytoskeletal mechanism, ultimately leading to the formation of filopodia and branches from the axon.
Materials and Methods
Tissue culture.
Embryonic day 7 (E7) chicken dorsal root ganglia (DRG) (eggs obtained from Charles River Laboratories) were cultured as explants or dissociated for transfection following published protocols (Loudon et al., 2006). Explants and dissociated neurons were cultured in defined medium (F-12H with additives; Invitrogen) on glass coverslips or video dishes (Whitlon and Baas, 1992) coated with 25 μg/ml laminin (Invitrogen) following published protocols (Lelkes et al., 2006; Ketschek et al., 2007). NGF treatment was standardized using 20 ng/ml for before–after treatment experimental designs and when neurons were cultured in the continuous presence of NGF.
Transfection.
Dissociated neurons from 40 E7 DRGs were transfected with enhanced yellow fluorescent protein (eYFP)–β-actin (Clontech), mCherry–β-actin (kindly provided by Dr. E. Dent, University of Wisconsin, Madison, WI), mCherry–CAAX (kind gift from Drs. E. Dent and W. Bement, University of Wisconsin), and plekstrin homology (PH)–Akt–green fluorescent protein (GFP) plasmid (Addgene) (Kwon et al., 2007). Plasmids were prepared using standard methods (Qiaprep kit; Qiagen). Transfections were performed using the Amaxa Biosystems Nucleofector II setting G-013 using the transfection reagents of the manufacturer as directed and 10 μg of plasmid per transfection. Immediately after electroporation, the dissociated cells were cultured overnight in F-12H medium on video dishes.
Reagents.
NGF was obtained from R & D Systems and used at a final concentration of 20 ng/ml. The control antennapedia peptide (Antp), the PI3K peptide [Arg-Gln-Ile-Lys-Ile-Trp-Phe-Gln-Asn-Arg-Arg-Met-Lys-Trp-Lys-Lys-Ser-Asp-Gly-Gly-Tyr(PO3H2)-Met-Asp-Met-Ser] and an additional control consisting of the PI3Kpep peptide with the Tyr(PO3H2) replaced by an alanine were synthesized by American Peptide Company (95–99% purity). All peptides were dissolved at 0.5 mg/ml in F-12H medium, used at a final concentration of 50 μg/ml (Williams and Doherty, 1999; Chadborn et al., 2006; Gallo, 2008), and stored at −70°C. The PI3K inhibitor LY294002 [2-(4-morpholinyl)-8-phenyl-1(4H)-benzopyran-4-one], in solution, was obtained from Calbiochem and used at a final concentration of 10 μm. The Akt Inhibitor VII (Akti) was purchased from Calbiochem dissolved with F-12H medium for a stock concentration of 100 μm and used at a final concentration of 50 μm. To block binding of integrins to laminin, we used a well established blocking antibody to chicken β1 integrins (W1B10; Sigma), which we have characterized previously in our culturing system (Ketschek et al., 2007).
Imaging of cytoskeletal dynamics and mitochondria.
All imaging, data acquisition, and analysis were performed using a Carl Zeiss 200M microscope equipped with an Orca ER camera (Hamamatsu) (same imaging setup as described previously by Loudon et al., 2006). Live and fixed cultures were observed using a 100×, 1.3 numerical aperture objective for both phase and fluorescence microscopy. For live imaging, the stage was heated and held constant by a Carl Zeiss multiplate heating insert with objective heater. Quantitative analysis of patches was performed using the protocols previously described by Loudon et al. (2006). To measure β-actin patch formation and lifespans, images were acquired using 6 s interframe intervals for 3–5 min. Time-lapse and quantitative analysis was performed using the interactive measurement module of the AxioVision Software. Mitochondria in eYFP–actin-transfected axons were labeled by a 30 min treatment with 0.05 nm MitoTracker Red (Invitrogen). To determine the relationship between formation of actin patches and mitochondria, when an eYFP–actin patch was observed to form, we switched to the mitochondrial channel and determined whether the patch colocalized with a mitochondrion.
Immunocytochemistry.
To detect the distribution of β-integrins along axons, we used an antibody to the extracellular domain of chicken β1-integrin (W1B10; Sigma). We similarly used an antibody to the extracellular domain of TrkA (kind gift from Dr. F. Lefcort, University of Montana, Bozeman, MT) as we described previously (Gallo et al., 1997). For combined antibody and phalloidin staining, cells were grown on coverslips, fixed with 0.25% glutaraldehyde for 15 min, washed and treated with sodium borohydride (2 mg/ml) for 15 min, followed by a 15 min treatment with blocking solution (BLK) consisting of 10% goat serum in PBS. Primary antibodies to β1-integrin (1:400) or TrkA (1:1000) were applied in BLK along with anti-tubulin directly conjugated to fluorescein (DM1A-FITC; Sigma). The tubulin antibody has the function of reporting on regions of the axon with compromised axonal membrane permeability, which were excluded from analysis in determining the distribution of extracellular receptors (as in the study by Lemons and Condic, 2006) (supplemental Fig. S4, available at www.jneurosci.org as supplemental material). After washing with PBS (three times) and additional treatment with BLK (15 min), cells were then stained with Alexa-647–phalloidin to detect F-actin (Invitrogen) following the directions of the manufacturer and rhodamine-conjugated secondary antibodies directed to the receptor antibodies for 40 min in BLK containing 0.1% Triton X-100. Coverslips were mounted in no-fade medium and stored at −20°C until analysis.
Statistical analysis.
All statistical analysis was performed using Instat software (GraphPad Software). When datasets did not satisfy the Kolmogorov–Smirnov test using the Dallal and Wilkinson approximation for normality automatically performed by the software, then nonparametric tests were selected. Analysis of the distribution of data into categories was performed using the χ2 test. Although shown as percentage to normalize across groups, χ2 test were performed on the raw datasets and not the normalized percentage values.
Results
NGF promotes formation of axonal filopodia by increasing the rate of formation of F-actin patches
Axonal filopodia emerge from precursor structures characterized by accumulations of F-actin along the axon shaft (axonal F-actin patches: Lau et al., 1999; Andersen et al., 2005; Loudon et al., 2006; Korobova and Svitkina, 2008; Mingorance-Le Meur and O'Connor, 2009). As determined by live imaging of the dynamics of fluorescently labeled actin, F-actin patches form spontaneously in the axon shaft, and their life cycle can be operationally defined as consisting of four phases (Fig. 1 A): (1) “initiation,” the initial formation of a patch, followed by (2) “elaboration” as the patch increases in size and actin content, (3) patch “dissipation” as the patch decreases in size and eventually fades, and (4) the “transition phase,” representing the emergence of a protrusive filopodial shaft from a patch. Although filopodia emerge from patches, only a subset of F-actin patches enter the transition phase and give rise to filopodia before fully dissipating (Loudon et al., 2006).
Figure 1.

NGF promotes formation of axonal filopodia through increasing the rate of formation of axonal F-actin patches. A, Schematic of the “life cycle” of axonal F-actin patches as determined through live imaging of axonal actin dynamics using genetically encoded fluorescently labeled actin (eYFP–actin; time-lapse sequence, seconds denoted). Initiation of patches is defined as when a focal spot of actin fluorescence increases in intensity above the background signal present in the axon, defining the location of patch formation. The elaboration phase reflects the increase in intensity and size of the patch (0–12 s). Eventually, patches enter the dissipation phase as they decrease in intensity and size and eventually are no longer detectable above background signal (15–24 s). The lifespan of patches is defined as the time lapsed between initiation and full dissipation. Filopodia emerge from patches during the lifespan of patches. We refer to the emergence of a filopodium from a patch as the transition phase (arrow at 15 s). In embryonic day 7 cultured sensory axons, ∼25% of patches enter the transition phase (see D). B, NGF treatment promotes the rate of formation of axonal filopodia. Data in B–D are from the same axons (n = 14) transfected with eYFP–β-actin. Data were collected from the distal 20 μm of the axon before and after treatment with NGF. C, NGF treatment increases the rate of formation of axonal F-actin patches. D, NGF treatment does not affect the percentage of F-actin patches that enter the transition phase. E, NGF does not affect the lifespan of F-actin patches. Statistical p values obtained from paired t tests (2-tailed values shown).
In our studies, we used embryonic day 7 chicken dorsal root ganglion neurons because they can be cultured on laminin in the absence of neurotrophins (Guan et al., 2003; Roche et al., 2009). These culturing conditions select for NGF-responsive TrkA-positive neurons, allowing investigation of NGF-naive axons before and after treatment with NGF (supplemental Fig. S1A, available at www.jneurosci.org as supplemental material). Treatment of NGF-naive neurons with soluble NGF increased the numbers of axonal filopodia by increasing the rate of formation of filopodia (Fig. 1 B) (counts of filopodial numbers shown in supplemental Fig. S1B, available at www.jneurosci.org as supplemental material). To elucidate the mechanism by which NGF regulates the formation of filopodia from F-actin patches, we determined the effects of NGF treatment (30 min) on axonal actin dynamics in NGF-naive embryonic neurons transfected with eYFP–β-actin. We imaged actin dynamics in the same axons before and after treatment with NGF and determined (1) the rate of F-actin patch initiation (patches/distal 20 μm of axon/3 min), (2) percentage of patches that enter the transition phase thereby giving rise to a filopodium (transition frequency), and (3) the lifespan of the F-actin patches (time from when patch is first detectable above background to when it is no longer detectable above background) (as performed previously by Loudon et al., 2006). NGF treatment increased the frequency of F-actin patch initiation compared with control (Fig. 1 C). However, NGF treatment did not alter the percentage of patches transitioning into filopodia (Fig. 1 D). Independent of NGF treatment, 23–27% of axonal eYFP–β-actin patches gave rise to filopodia (Fig. 1 D). Furthermore, we found no difference in the lifespan of the actin patches after NGF treatment (Fig. 1 E). The observation that NGF increases the rate of F-actin patch formation was confirmed by counting the numbers of F-actin patches in axons stained with phalloidin, which exhibited increased numbers of patches (supplemental Fig. S1B, available at www.jneurosci.org as supplemental material) and was also observed in the before–after treatment live-imaging approach using mCherry–β-actin (p < 0.01; n = 13 axons). These data reveal that NGF controls the formation of filopodia by regulating the frequency of formation of F-actin patches but does not regulate the probability that a patch will give rise to a filopodium or the lifespan of patches. Thus, the mechanism underlying the initiation of F-actin patches is the major target of NGF signaling resulting in increase rates of axonal filopodial formation.
Localized axonal microdomains of phosphatidylinositol (3,4,5)-trisphosphate accumulation correlate with formation and development of F-actin patches
NGF signals through the receptor tyrosine kinase TrkA, resulting in activation of multiple signaling pathway, including the PI3K and downstream serine–threonine kinase Akt pathway (for review, see Kaplan and Miller, 2000). We have shown previously that inhibition of PI3K blocks the formation of axonal filopodia (Gallo and Letourneau, 1998), but the specific role of PI3K in the cytoskeletal dynamics underlying the formation of filopodia is not known. We thus sought to investigate the spatiotemporal dynamics of PI3K activity in axons relative to the dynamics of axonal F-actin patches, the precursors to formation of filopodia from the axon. PI3K phosphorylates the membrane lipid phosphatidylinositol (4,5)-bisphosphate (PIP2), resulting in increased levels of phosphatidylinositol (3,4,5)-trisphosphate (PIP3) (Cantley, 2002). PIP3 in turn targets the downstream kinase Akt to the membrane through binding the PH domain of Akt (Lemmons et al., 2002). We therefore used GFP–Akt–PH domain (Kwon et al., 2007) to monitor the localization of PIP3 along axons growing from neurons cultured in the presence of NGF. For analysis, we selected neurons with low expression levels of GFP–Akt–PH so not to compete with the binding of endogenous proteins to PIP3 while also allowing local differences in GFP signal to be detectable above background (for additional information, see Materials and Methods). Initial imaging studies revealed “microdomains” of GFP–Akt–PH accumulation along axons and at sites that subsequently gave rise to filopodia (Fig. 2 A). The mean rate of formation of microdomains of GFP–Akt–PH accumulation was decreased by 92% after treatment with 10 μm LY294002, a well characterized inhibitor of PI3K (Kong and Yamori, 2008) (supplemental Fig. S2, available at www.jneurosci.org as supplemental material), consistent with the notion that GFP–Akt–PH reports on the localized activity of PI3K. We next determined whether microdomains of GFP–Akt–PH correlated in space and time with initiation and development of axonal F-actin patches reported by mCherry–actin and found that microdomains of GFP–Akt–PH formed in synchrony with axonal F-actin patches (Fig. 2 B). Interestingly, microdomains of GFP–Akt–PH persisted throughout the lifespan of axonal F-actin patches and dissipated with a temporal profile similar to F-actin patches (Fig. 2 C), indicating that PI3K activity may regulate F-actin patches throughout their development. Correlation analysis of the lifespans of axonal F-actin patches and their respective microdomains of GFP–Akt–PH revealed a coefficient (r 2) of 0.86, and the slope of the correlation (0.9 ± 0.1 SEM) was significantly different from zero (p < 0.0001). Finally, we imaged the initiation and development of microdomains of GFP–Akt–PH and axonal F-actin patches using a 2 s interframe interval to further characterize the relationship between these two events. We found that 84% (n = 25) became detectable in synchrony, and 16% of microdomains became detectable 2–4 s before F-actin patches (supplemental Fig. S3, available at www.jneurosci.org as supplemental material). Similar to data acquired using a 6 s time interval, the lifespans of microdomains and patches were highly correlated (r 2 = 0.94). Collectively, these data confirm the synchrony between formation of microdomains and F-actin patches.
Figure 2.
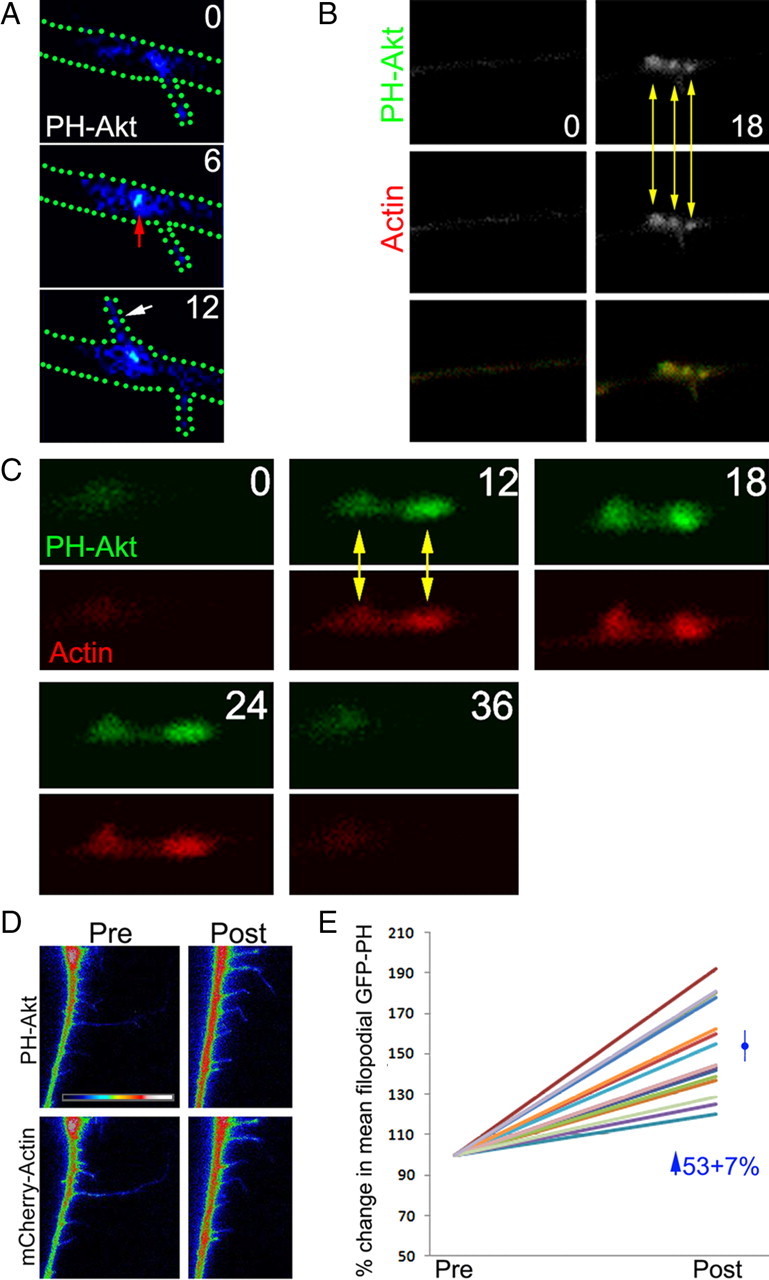
Axonal microdomains of PIP3 accumulation form in synchrony with axonal F-actin patches. A, Example of an axon transfected with PH–Akt–GFP and imaged at 0, 6, and 12 s. The outline of the axon is shown by green dots. Note the accumulation of PH–Akt–GFP present at the base of an established filopodium at 0 s (arrowhead). Between 0 and 6 s, a focal accumulation of PH–Akt–GFP develops slightly to the right of the existing filopodium (red arrow), and between 6 and 12 s, a filopodium emerges from the region exhibiting the accumulation of PH–Akt–GFP. B, Dual imaging of PH–Akt–GFP and mCherry–actin. Between 0 and 18 s, three separate F-actin patches are formed in close vicinity in the axon, and each patch colocalizes with a microdomain of PH–Akt–GFP (yellow arrows). C, Time-lapse sequence of dual imaging of PH–Akt–GFP and mCherry–actin showing the synchronous initiation, elaboration, and dissipation of two F-actin patches and associated microdomains of PH–Akt–GFP (numbers indicates seconds). D, Examples of PH–Akt–GFP and mCherry–actin levels in axonal filopodia before and after NGF treatment. The PH–Akt–GFP signal in the axon appears saturated as a result of the need to increase contrast so as to reveal the relatively lower signal in the filopodial shafts. E, Quantification of the mean intensity of PH–Akt–GFP signal in the shafts of filopodia of 13 neurons (each neuron shown with a different color line) before and after treatment with NGF. The post value is expressed relative to the pre value for each neuron (set at 100%). NGF treatment induced a mean increase of 53% in the levels of PH–Akt–GFP in the shafts of axonal filopodia.
Expression of PH–Akt–GFP allowed us to visualize accumulation of the reporter along axons. However, there can be no confidence that all sites of accumulation can be detected in every axon because of the background signal in the relatively large volume of the axon. Therefore, to determine the degree of correlation between the formation of microdomains of PH–Akt–GFP and axonal F-actin patches, we focused on detectable microdomains of PH–Akt–GFP and then determined whether these microdomains correlated with sites of F-actin patch formation (revealed by mCherry–actin). Using this analytical approach, we determined that 94 and 92% of microdomains of PH–Akt–GFP colocalized with axonal F-actin patches in axons cultured in the absence (n = 47) or presence (n = 39) of NGF, respectively. Given that inhibition of PI3K blocked the formation of almost all F-actin patches regardless of NGF treatment (Fig. 3 B), we believe that cases in which F-actin patches formed without detectable microdomains of PH–Akt–GFP are attributable to issues related to detection limit for microdomains of PH–Akt–GFP relative to the background signal in the large volume of the axon.
Figure 3.

Inhibition of PI3K and Akt blocks formation of NGF-independent and NGF-induced axonal F-actin patches. A, The rate of formation of filopodia from the distal 20 μm of axons was tracked using phase-contrast optics (100×) from axons before and after treatment with the PI3K inhibitor LY294002 (LY; 10 μm) in the absence of NGF (NGF−) or cotreatment with NGF (NGF+) and LY294002 (30 min treatments in all cases). A total of 13 (NGF−) and 14 (NGF+) axons were measured. All data are expressed normalized to the pretreatment group. B, LY294002 blocks formation of F-actin patches in the presence (+) or absence (−) of NGF. The rate of axonal F-actin patch formation was determined from imaging of eYFP–actin-transfected axons as in Figure 1. A total of 10 (NGF−) and 11 (NGF+) axons were measured using the before–after treatment design as in A. C, The experiment was performed as in A but using 50 μm Akti. No filopodia were observed to form (N.O.) after treatment with Akti in the absence or presence of NGF, demonstrating a strong inhibitory effect but preventing statistical analysis. A total of eight (NGF−) and seven (NGF+) axons were measured. D, Akti blocks formation of F-actin patches in the presence or absence of NGF. Similar to C, the rate of patch formation was determined from eight (NGF−) and nine (NGF+) axons. Paired t test was performed.
Microdomains of PH–Akt–GFP and actin patches are not reflective of volumetric changes or accumulation of membrane. Imaging of axons cotransfected with DsRed (Discosoma sp. red fluorescent protein), as a volumetric reporter, and PH–Akt–GFP did not reveal volumetric differences at sites of microdomain formation (supplemental Fig. S4, available at www.jneurosci.org as supplemental material). CAAX is a membrane targeting sequence that targets proteins to the plasma membrane (Fu and Casey, 1999; Philips, 2005). We did not detect accumulations of mCherry–CAAX, at sites of actin patch formation reported by eGFP–actin (supplemental Fig. S4, available at www.jneurosci.org as supplemental material).
NGF promotes the formation of localized axonal microdomains of PIP3
To determine the effects of NGF on axonal microdomains of PIP3, revealed by GFP–Akt–PH accumulation, we used a before–after treatment with NGF imaging paradigm in the same neurons. Similar to its effects on the formation of actin patches, NGF promoted the rate of formation of GFP–Akt–PH -microdomains in axons. Before treatment with NGF, axons exhibited formation of 3.8 ± 0.38 microdomains/3 min/distal 40 μm of axon compared with 8.2 ± 0.6 after NGF (p < 0.005, paired t test). Axonal microdomains of GFP–Akt–PH were present in the absence of NGF and correlated with axonal F-actin patch formation, indicating that NGF-independent patch formation is also controlled by PI3K activity, an issue addressed in subsequent experiments (see Fig. 3). Regardless of NGF treatment, axonal F-actin patches formed in synchrony with microdomains of GFP–Akt–PH and their respective lifespans exhibited similar correlations: r 2 before NGF = 0.87 slope = 0.9 ± 0.1; r 2 after NGF = 0.81 slope = 0.95 ± 0.11. Thus, NGF activates the coordinated formation of axonal F-actin patches and microdomains of PIP3 but does not alter the net dynamics of their development.
We also determined whether NGF treatment altered the levels of GFP–Akt–PH in the shafts of axonal filopodia. Axons transfected with GFP–Akt–PH and mCherry–actin were imaged before and after treatment with NGF. The mean intensity of GFP–Akt–PH was determined in 6–10 axonal filopodia per neuron, and the mean value for each neuron was determined before and after NGF treatment. This metric revealed a 53% increase in the mean intensity of GFP–Akt–PH in the shafts of filopodia after NGF treatment (Fig. 2 D,E). Using a similar analysis, we did not detect a change in the mCherry–actin signal in the same filopodia (data not shown; p > 0.6). Thus, NGF treatment affects the localization of GFP–Akt–PH, reflective of PIP3 accumulation, in both axonal F-actin patches and filopodial shafts. It will be of interest to determine whether and how the activity of PI3K in microdomains is translated into increased activity of PI3K in filopodial shafts. However, this seems unlikely because filopodia often persist longer than patches and the associated microdomains, required to initiate them. The filopodium may represent a defined subcellular domain of PI3K signaling as has been shown for calcium signaling (Davenport et al., 1993; Robles et al., 2003).
The PI3K–Akt pathway is required for NGF-dependent and -independent formation of F-actin patches and filopodia
The formation of axonal F-actin patches correlates with axonal microdomains of GFP–Akt–PH both before and after treatment with NGF. Therefore, we sought to determine the role of PI3K in the formation of axonal F-actin patches and filopodia. PI3K activity was inhibited using 10 μm LY294002 in a before–after treatment experimental paradigm imaging axonal actin dynamics. Treatment with LY294002 greatly diminished the rate of formation of filopodia (Fig. 3 A) and axonal F-actin patches (Fig. 3 B) regardless of NGF treatment. We next sought to determine whether Akt, a downstream effector of PI3K targeted to sites of PI3K activity through its PH domain, is involved in the formation of axonal F-actin patches by treating cultures with Akt inhibitor VII (Hiromura et al., 2004). Inhibition of Akt, similar to inhibition of PI3K, greatly decreased the rate of formation of axonal filopodia (Fig. 3 C) and F-actin patches (Fig. 3 D) regardless of NGF treatment. In conjunction with the observation of axonal microdomains of GFP–Akt–PH, these data indicate that Akt activity downstream of localized PI3K activity is required for initiation of F-actin patches in both the presence and absence of NGF.
Direct activation of PI3K is sufficient to promote the formation of axonal F-actin patches and filopodia
We next sought to determine whether direct activation of PI3K, in the absence of additional pathways activated by NGF, could promote the formation of axonal F-actin patches and filopodia. To directly activate PI3K, we treated neurons with a cell-permeable peptide consisting of a phosphorylated EGFR sequence that directly activates PI3K activity (Williams and Doherty, 1999; Chadborn et al., 2006; Gallo, 2008). Axonal actin dynamics were monitored in eYFP–actin-transfected neurons in the absence of NGF treated for 40–100 min with either the cell-permeable PI3K activating peptide (PI3Kpep) or one of two control peptides consisting either of only the cell-permeable domain (antennapedia) or the PI3Kpep with the phospho-tyrosine replaced by alanine (PI3KpepAla). Relative to control peptides, PI3Kpep caused striking changes in axonal morphology characterized by increased numbers of filopodia (Fig. 4 A). PI3Kpep promoted the rate of axonal F-actin patch initiation (Fig. 4 B) and also increased the lifespan of patches (Fig. 4 C) but did not affect the percentage of patches that gave rise to filopodia (transition frequency) (Fig. 4 C). Treatment with PI3KpepAla (19 axons, 93 patches) did not alter the lifespan of patches (p > 0.2) or the transition frequency (p > 0.7) relative to baseline cultures without NGF. However, PI3KpepAla decreased the rate of formation of axonal eYFP–actin patches by 36% (p = 0.04). A slight inhibitory effect of PI3KpepAla was also detected as a 20% decrease of the number of patches detected by phalloidin staining (p = 0.07; n = 54–56 axons per group). Collectively, the data demonstrate that PI3Kpep promotes patch formation, whereas the PI3KpepAla has minor inhibitory effects, perhaps as a result of partially binding PI3K but not activating it.
Figure 4.

Direct activation of PI3K promotes axonal F-actin patch formation. A, Examples of the distal segments of eYFP–actin-transfected axons treated with the control antennapedia (Antp) peptide or PI3Kpep for 60 min. Arrow shows direction of the growth cone, not shown but just beyond the edge of the images. B, Quantification of the rate of formation of axonal F-actin patches, measured in the distal 0–20 and 20–40 μm of the axons, in response to Antp or PI3Kpep treatment. In both groups, the distal-most 0–20 μm segment exhibited greater rates of F-actin patch formation relative to the more proximal 20–40 μm segment. In both segments, PI3Kpep treatment increased the rate of F-actin patch formation. n = 20 axons per group. Data in C and D were obtained from analysis of the same set of axons. C, Treatment with PI3Kpep, relative to Antp, increased the lifespan of axonal actin patches but had no effect on the percentage of patches transitioning leading to emergence of filopodia. D, Although both NGF and PI3Kpep increase the number of axonal filopodia, the effects of PI3Kpep and NGF on the numbers of axonal filopodia are not additive. Filopodia were counted in the distal 40 μm of axons stained with phalloidin (n > 67 axons per group) treated for 1 h with NGF, PI3Kpep, or NGF plus PI3K. E, Examples of axons treated for 2 h with Antp or PI3Kpep and stained with anti-tubulin antibodies to reveal microtubules. Note that the PI3Kpep-treated axon exhibits more laterally projecting microtubules into branches than the Antp-treated axon. F, Quantification of the number of axon branches in the distal 100 μm of axons treated for 2 h with PI3Kpep or Antp. Mann–Whitney test was performed because neither dataset exhibited a normal distribution. n = 67 and 93 axons for the Antp and PI3Kpep groups, respectively.
Because PI3Kpep increased the lifespan of patches but did not affect the transition frequency, we determined whether PI3Kpep altered the point during the lifespan of patches when they underwent transition and gave rise to a filopodium. To obtain sufficient temporal resolution, for this analysis, we focused on patches with lifespans ≥30 s in both Antp and PI3Kpep groups. Patches underwent transition at the 62 + 8% (n = 14) and 66 + 4% (n = 23) point of the lifespan in Antp- and PI3Kpep-treated axons (p = 0.69), respectively, in which 0% is the time of patch initiation and 100% is full dissipation. Thus, although PI3Kpep increased the lifespan of patches, the patches gave rise to filopodia at the same relative point in their temporal development as control patches. Collectively, these observations indicate that activation of PI3K with PI3Kpep promotes patch formation and increases their lifespans, but the mechanism of transition to filopodial emergence from patches remains relatively unaffected as evidenced by a lack of effect on the transition frequency and the time point when transition occurs during the lifespan of the patches. The discrepancy between the increase in lifespan observed with PI3Kpep treatment but not with NGF treatment likely reflects a difference between receptor-mediated activation of the PI3K pathway (e.g., receptor desensitization, internalization, activation of additional pathways) and the direct manipulation of the pathway using a reagent that is expected to drive PI3K activity until otherwise overwhelmed by endogenous negative regulatory mechanisms (e.g., phosphatases). Indeed, previous work has shown the presence of endogenous signaling loops that can control the extent of PI3K signaling (Merlot and Firtel, 2003).
Interestingly, in both Antp- and PI3Kpep-treated axons, we noted that the rate of formation of axonal F-actin patches was greatest in the distal-most 0–20 μm of the axon relative to the more proximal 20–40 μm (Fig. 4 B), consistent with our previous report of a similar gradient in the formation of filopodia imaged using phase-contrast microscopy (Loudon et al., 2006). The difference between the mean rate of patch formation between the two axon segments was of 35 and 37% in the Antp and PI3Kpep axons, respectively. The observation that activation of PI3K increases the rate of F-actin patch formation, but does not alter the normal gradient in the competency of the axon to form F-actin patches, indicates that additional required components of the mechanism of F-actin patch formation are heterogeneously distributed within the axon in a manner independent of PI3K activity.
Analysis of fixed axons stained with phalloidin, to detect F-actin, confirmed that treatment with PI3Kpep increased the numbers of patches and filopodia in a manner dependent on Akt activity (supplemental Fig. S5, available at www.jneurosci.org as supplemental material). Furthermore, cotreatment with PI3Kpep and NGF did not have additive effects on the numbers of axonal filopodia (Fig. 4 D), consistent with the idea that PI3K signaling is downstream of NGF in the regulation of F-actin patches. Finally, treatment with PI3Kpep promoted the rate of formation of axonal microdomains of GFP–Akt–PH. Axons treated with the antennapedia peptide formed 2.36 ± 0.25 microdomains/3 min/distal 20 μm of axon (n = 24) compared with 4.08 ± 0.39 in axons treated with PI3Kpep (n = 22; p < 0.0001).
Direct activation of PI3K is sufficient to increase the number of axon branches
We thus sought to determine whether treatment with PI3Kpep, to directly activate PI3K, could promote formation of axon collateral branches. Collateral branches were defined as axonal projections longer than 10 μm and containing microtubules, which reflect mature branches supported by a microtubule cytoskeleton (Gallo and Letourneau, 1998, 1999). As determined by analysis of cultures stained to reveal microtubules (Gallo and Letourneau, 1998), treatment for 2 h with PI3Kpep increased the numbers of axon collateral branches present along the distal 100 μm of axons relative to treatment with the antennapedia peptide alone (Fig. 4 E,F). Thus, direct activation of PI3K promotes the formation of axonal filopodia and also the formation of mature axon branches.
PI3K activity and NGF treatment promote branching of axonal filopodia
PI3K activity has been reported in the shafts of dendritic filopodia (Luikart et al., 2008), and we similarly detected increased levels of GFP–Akt–PH in the shafts of axonal filopodia after treatment with NGF (Fig. 2 D,E). Thus, we also investigated potential roles of PI3K in regulation of the dynamics of axonal filopodia. Analysis of filopodial dynamics revealed that treatment with PI3Kpep did not alter the percentage of filopodia that remained stable (i.e., exhibiting neither protrusion nor retraction) during the imaging period (Fig. 5 A). However, in the presence of PI3Kpep, filopodia that were dynamic more frequently exhibited both protrusion and retraction relative to control peptide-treated filopodia (Fig. 5 A). This observation indicates that PI3K activity promotes cycling between protrusion and retraction but does not “awaken” stable filopodia.
Figure 5.

PI3K promotes filopodial dynamics and branching. A, The behavior of the tips of filopodia present at the beginning of the time-lapse sequence were analyzed and categorized based on their net dynamics during the sequence (only filopodia that were not branched were scored). Stable filopodia exhibited neither protrusion nor retraction, and treatment with PI3Kpep did not alter the proportion of stable filopodia. Dynamic filopodia either exhibited only protrusion (Pro) or only retraction (Ret) or bouts of both protrusion and retraction (Pro & Ret). Treatment with the PI3Kpep promoted cycling between protrusion and retraction in filopodia that exhibited dynamics (χ2 test on raw data; for entire figure, n = 19 and 20 axons in Antp and PI3Kpep treatment groups, distal 40 μm of each axon sampled). B, Example of branched filopodia from a PI3Kpep-treated axon as visualized through expression of eYFP–actin. Arrowheads denote branching points. C, Time-lapse sequence (seconds) of two filopodia exhibiting filopodial actin “patch” formation (arrows a and b) from an axon expressing eYFP–actin treated with PI3Kpep. Patch a gives rise to a branch (18–24 s, arrowhead). Patch b forms and dissipates without giving rise to a branch. D, Treatment with PI3Kpep, relative to Antp, increased the percentage of filopodia that exhibited actin patches but has no effect on the probability that a filopodial patch will give rise to a branch. χ2 tests.
We observed that the axonal filopodia of PI3Kpep-treated neurons exhibited increased branching, as reflected by the presence of one or more additional filopodial shafts emerging from the primary filopodial shaft (Fig. 5 B). Only 14% of filopodia along the axons of neurons treated with the control peptide (antennapedia) exhibited branching compared with 39% after treatment with PI3K (n > 180 filopodia per group; χ2 test, p < 0.0001). Similarly, analysis of the percentage of filopodia that underwent branching during the time-lapse video sequences revealed that PI3Kpep treatment increased the probability that a filopodium underwent one or more instances of branching. Although 4% of filopodia underwent branching in the antennapedia-treated samples, 14% branched in the presence of PI3Kpep (χ2 test, p < 0.005). Treatment with NGF increased the percentage of branched filopodia in a manner similar to direct activation of PI3K and increased the percentage of filopodia with one or more branches from 13 to 35% (χ2 test, p < 0.03; n = 50 and 49 of phalloidin-stained axons scored, respectively).
Imaging of actin dynamics revealed that filopodial branching, similar to formation of axonal filopodia, was preceded by a focal accumulation of actin located along the filopodial shaft (Fig. 5 C). We will refer to these focal accumulations of actin as filopodial patches but do not intend to indicate that they are structurally and mechanistically identical to axonal F-actin patches. We observed filopodial patches in both control and PI3Kpep-treated filopodia. However, relative to control Antp-treated filopodia, treatment with PI3Kpep increased the percentage of filopodia initiating one or more filopodial patches (Fig. 5 D). PI3Kpep did not, however, affect the percentage of filopodial patches that gave rise to filopodial branches (Fig. 5 D). Thus, the formation of PI3Kpep-induced filopodial branches appears to follow the same general rules as the induction of filopodia from the axon shaft.
Laminin signaling through β1-integrins promotes axonal F-actin patch formation in the absence of NGF
In our culturing system, in the absence of NGF, axons are growing through signals derived from the laminin substratum and baseline numbers of axonal filopodia and patches form without NGF treatment (Fig. 1). We have shown previously that inhibition of laminin–integrin binding through treatment with a function-blocking anti-β1 integrin antibody caused axon stalling and retraction in a dose-dependent manner, which correlates with approximately 50 and 90% decreases in neuronal attachment to the substratum (Ketschek et al., 2007). We therefore sought to determine whether the axonal F-actin patches that form in the absence of NGF are dependent on laminin–integrin signaling. Treatment with a “low” concentration of the anti-β1 integrin antibody, which causes axon stalling but not retraction, decreased the numbers of axonal F-actin patches by ∼40% (Fig. 6 A), similar to its partial effect on neuronal attachment to laminin (Ketschek et al., 2007). Treatment with high concentration of the anti-β1 integrin antibody caused axon retraction and the formation of pronounced axonal F-actin bundles (data not shown but similar to bundles induced by semaphorin-3A) (Gallo, 2006) and prevented clear analysis of F-actin patches. Analysis of the rate of formation of microdomains of GFP–Akt–PH in axons before and after antibody treatment revealed a 36% decrease (n = 6; p < 0.001, paired t test). Collectively, these data indicate that axonal F-actin patches that form in the absence of NGF are under regulation by laminin through integrin-based PI3K–Akt signaling (Cary et al., 1999; Tucker et al., 2005).
Figure 6.

β1-Integrins regulate the number of F-actin patches in the absence of NGF. A, Quantification of the number of axonal F-actin patches, as determined from phalloidin staining, in the distal 0–20 and 20–40 μm of the axon after a 30 min treatment with a function-blocking monoclonal β1-integrin antibody (11 μg/ml W1B10) or control IgG (11 μg/ml mouse IgG). B, Example of the distribution of surface β1-integrin clusters and axonal F-actin patches. Three patches are noted, a relatively large patch (large green arrow) and two smaller patches (small green arrows, likely during early elaboration or late dissipation phases). The patches are present in the proximity of a bright cluster of β1-integrins (red arrow). Additional clusters of β1-integrins of varying intensity that do not have associated F-actin patches are also noted (yellow arrows).
To gain additional insight into the relationship between integrin receptors and axonal F-actin patches, we determined their relative distributions in axons using a protocol designed to specifically reveal surface β1-integrins (Lemons and Condic, 2006). Briefly, cells are fixed but the membrane is not extracted before application of primary antibodies, thereby minimizing entry of antibodies into the cytoplasm. Staining is then performed with an antibody to an extracellular domain of β1-integrins and a monoclonal anti-tubulin antibody directly conjugated to fluorescein. Areas of axons with damaged membranes that allowed for entry of antibodies into the cytoplasm are readily excluded from analysis because of the presence of tubulin staining in axon segments (supplemental Fig. S6, available at www.jneurosci.org as supplemental material). β1-Integrin staining in regions of axons that do not exhibit tubulin staining is thus reflective of surface integrins. Consistent with previous reports, we observed that surface integrins are primarily detectable as clusters along the axon (Fig. 6 B). Interestingly, we did not observe direct colocalization of surface β1-integrin clusters with axonal F-actin patches (Fig. 6 B) (supplemental Fig. S6, available at www.jneurosci.org as supplemental material). However, when a patch was observed, a cluster of β1-integrins was also detected a mean distance of 1.04 ± 0.45 μm (mean ± SD; n = 104 patches from 14 axons) away from the center of patch. Of 104 measured patches, two exhibited direct colocalization with β1 clusters, and three patches did not have a β1-integrin cluster within a 3 μm radius. Thus, although laminin-integrin signaling regulates the formation of axonal F-actin patches and microdomains of GFP–Akt–PH, integrin clusters do not regulate formation of patches with direct spatial apposition but rather within their vicinity, indicating that integrin clusters may provide a “permissive” intra-axonal environment for patch formation.
NGF induces axonal F-actin patches at sites of TrkA clusters
NGF-induced formation of axonal filopodia is dependent on signaling through the TrkA receptor (Gallo and Letourneau, 1998). TrkA receptors are activated by NGF at concentrations significantly lower than the p75 neurotrophin receptor, and 0.1 ng/ml NGF is sufficient to significantly activate the TrkA receptor with maximal activation at 1 ng/ml (Kaplan et al., 1991). Consistent with a TrkA-based mechanism, concentrations of NGF as low as 0.05 ng/ml increased the numbers of axonal F-actin patches (supplemental Fig. S7, available at www.jneurosci.org as supplemental material). To gain additional insights into how TrkA receptor signaling orchestrates the formation of patches, we determined the distribution of TrkA receptors relative to F-actin patches using an anti-chicken TrkA antibody directed at the extracellular domain of the receptor (Gallo et al., 1997). To maximize the detection of surface TrkA receptors over internalized receptors, we used the same approach as described previously for monitoring surface β1-integrins. Consistent with our previous report (Gallo et al., 1997), TrkA receptors are found in clusters along the axon (Fig. 7 A). In the absence of NGF, only 12% of patches colocalized with TrkA receptor clusters (n = 84 patches, 20 axons). However, after NGF treatment, 59% of patches directly colocalized with TrkA clusters (n = 142 patches, 20 axons) (Fig. 7 B). Because NGF promotes patch formation by ∼100% above the baseline set by laminin signaling alone (Fig. 1), it is not surprising that not all patches formed after treatment with NGF directly colocalize with TrkA clusters because some patches would be expected to form through the NGF-independent β1-integrin regulated mechanism. We also noted that 14% (no NGF) and 18% (NGF-treated) of F-actin patches that did not exhibit direct colocalization with a TrkA cluster were nonetheless surrounded by clusters of TrkA (Fig. 7 C), a type of organization we refer to as “rosette.” Counts of the numbers of clusters found in rosettes around patches revealed that NGF treatment doubled the numbers of TrkA clusters per F-actin patch relative to no NGF (p < 0.0001, Mann–Whitney test; n = 28 and 59 patches with rosettes for no NGF and NGF, respectively). These data indicate that NGF elicits patch formation through a subset of axonal TrkA clusters.
Figure 7.

NGF-induced F-actin patches colocalize with clusters of TrkA. A, Example of the distribution of TrkA clusters along the distal axon. B, Example of a representative axonal F-actin patch, from an NGF-treated axon, showing colocalization with a TrkA cluster. C, Example of a rosette of TrkA clusters surrounding an axonal F-actin patch. Individual TrkA clusters are denoted by the yellow arrows.
NGF-induced axonal F-actin patches form in association with mitochondria
Although our data indicate that integrin-dependent but NGF-independent axonal F-actin patches form in the vicinity of clusters of β1-integrins and NGF-induced patches form in apposition to clusters of TrkA receptors, in both cases not all receptor clusters on axons were associated with axonal F-actin patch formation. These observations indicate that site of the formation of an axonal F-actin patch requires more than just the presence of the relevant receptors. We therefore investigated additional aspects of cellular organization that may contribute to the localization of axonal F-actin patch formation.
For actin to be polymerization competent, it must be loaded with ATP and the ATPase activity of actin is a major sink for neuronal ATP consumption (Bernstein and Bamburg, 2003). Thus, starting with this consideration, we sought to determine the relationship between sites of axonal F-actin patch formation and axonal mitochondria, a major source of ATP for the axon. Furthermore, at least one actin regulatory protein (WAVE) has been found associated with the surface of mitochondria (Danial et al., 2003; Sung et al., 2008). As shown previously (Figs. 4 B, 6 A), the rate of F-actin patch formation and number of patches are greatest in the distal-most 20 μm of the axon. The distribution of axonal mitochondria, as revealed by MitoTracker staining, exhibits a similar gradient in the distal axon (Fig. 8 A), suggesting a possible relationship between the formation of axonal F-actin patches and the location of mitochondria.
Figure 8.

Relationship between sites of F-actin patch formation and axonal mitochondria. A, Relative distribution of mitochondria and the relative rate of formation of F-actin patches as a function of distoproximal location along the distal 40 μm of axons in the presence of NGF. For mitochondria, the total staining intensity of MitoTracker in the distal 40 μm of axons is expressed as the mean percentage of intensity in 5 μm axon segments. n = 10 axons. Both the amount of MitoTracker staining and the rate of axonal F-actin patch formation decrease in the proximal 20–40 μm of the axon relative to the distal 0–20 μm. B, Example of two eYFP–actin patches (green arrows) forming in axonal regions populated by mitochondria (revealed by MitoTracker Red labeling). The black and white panel shows the locations of the mitochondria at 0 s, denoted by the brackets. Seconds into the time-lapse after time = 0 s are denoted. C, Graphical representation of the sites of formation of F-actin patches and mitochondrial localization in the dataset. Note that the locations of all patches formed during the imaging period are shown and color coded, as noted in the legend below the image, to denote their relationship to mitochondria, the base of existing filopodia, or the absence of any detectable landmark. D, Treatment with 25 mm sodium azide (NaAz; 15–20 min) to inhibit mitochondrial respiration decreased rates of patch formation. Rates of patch formation and patch lifespans were determined from the distal 40 μm of axons imaged for 5 min before and again after 15–20 min of treatment with sodium azide. A total of seven and nine axons were sampled for no NGF (NGF−) and NGF (NGF+) groups, respectively. Paired t test used for analysis.
To directly determine the relationship between sites of axonal F-actin patch formation and the localization of individual mitochondria, we imaged 10 axons cultured in NGF, transfected with eYFP–actin and loaded with MitoTracker Red to reveal mitochondria in dual-channel imaging. Of a total of 92 patches that formed, 71 patches (77%) overlapped with mitochondria (Fig. 8 B). To visually appreciate the relationship between the location of the formation of axonal F-actin patches and mitochondria, we generated a linear representation of each axon and noted the location of mitochondria and the sites of patch formation (Fig. 8 C). Of all patches that formed overlapping with mitochondria, 65% of these patches belonged to sets of two to three patches that formed in sequence over the same mitochondrion (Fig. 8 C). Because mitochondria account for 15 ± 2% of the total area of the axon sampled in the time-lapse sequences, the association is not likely attributable to random overlap. Of the remaining 21 patches that did not colocalize with mitochondria, 14 of 21 (77%) formed at the base of a preexisting stable filopodium (shown in Fig. 8 C), suggesting that in some cases the base of the filopodium may contain “remnants” of a previous patch that can serve as a nucleus for patch reemergence. The remaining seven patches (8% of all patches) formed in regions of the axon that contained neither mitochondria nor were representative of the base of an existing filopodium.
We next determined the relationship between mitochondria and sites of axonal F-actin patch formation in neurons raised in the absence of NGF. Surprisingly, in the absence of NGF, we did not observe as a strong relationship between the localization of mitochondria and site of formation of actin patches. In the absence of NGF, 34% of patches formed in association with mitochondria (p < 0.0001, χ2 test, compared with in the presence of NGF). Furthermore, unlike in the presence of NGF when 77% of patches that were not associated with mitochondria arose at the base of existing filopodia, in the absence of NGF only 33% did so (n = 22 patches). However, similar to in the presence of NGF, mitochondria accounted for 14 ± 2% of the total area of the axon sampled in the time-lapse sequences. Thus, NGF orchestrates the association of sites of patch formation with mitochondria and the base of existing filopodia.
Treatment with PI3Kpep, similar to treatment with NGF, also promoted colocalization of axonal F-actin patch formation with axonal mitochondria. After treatment with PI3Kpep, 66% of patches (n = 96 patches) formed in apposition with axonal mitochondria in contrast to 40% (n = 58 patches) in controls treated with the control PI3KpepAla (χ2 test, p < 0.003). The PI3KpepAla treatment group was however not different from the absence of NGF treatment group (χ2 test, p = 0.57; see above), the baseline group for treatment with any peptide. These data indicate that PI3K signaling suffices to induce the coordination of sites of axonal F-actin patch formation with axonal mitochondria.
We next determined whether mitochondrial oxidative phosphorylation is required for the formation of axonal F-actin patches. Sodium azide inhibits mitochondrial respiration through inhibition of cytochrome c oxidase (Duncan and Mackler, 1966) and ATP synthetase (Herweijer et al., 1985), resulting in dissipation of mitochondrial potential and shape changes [25 mm, 15 min treatment (Kaasik et al., 2007)] and depleting ATP levels by ∼60% within 10 min of treatment [5 mm (Gomez-Niño et al., 2009)]. We therefore determined the effects of sodium azide (25 mm, 15–20 min treatment) on the rate of formation of axonal F-actin patches using neurons cultured in the presence or absence of NGF. Regardless of the presence of NGF, sodium azide treatment inhibited the formation of axonal F-actin patches by 61% (NGF+) and 72% (NGF−) (Fig. 8 D). Although treatment with sodium azide decreased the formation of new patches, it also increased the lifespan of patches that formed, similarly in the presence or absence of NGF (Fig. 8 D). These data indicate that, regardless of NGF, ATP generated from mitochondrial respiration contributes to patch initiation and the maintenance of actin turnover in axonal patches (Minamide et al. 2000).
Discussion
Collateral branching is a fundamental mechanism for the generation of appropriate synaptic networks and underlies aspects of neuronal plasticity in the context of injury (Hagg, 2006). In this study, we detail novel aspects of the cytoskeletal and signaling mechanism that mediate the formation of axonal filopodia, the first step in branching. We report that axonal microdomains of PIP3 generated by the activity of PI3K drive the formation of F-actin patches, which are cytoskeletal precursors to the formation of filopodia. Our results provide a new perspective on the regulation of axonal filopodial formation by surprisingly showing that NGF promotes the formation of axonal filopodia by increasing the rate of formation of axonal F-actin patches without altering the rate of formation of filopodia from patches.
The axon exhibits low protrusive activity and sparse actin filaments (Letourneau, 2009) and forms through the poorly understood process of consolidation (Dent and Gertler, 2003). Consolidation is an active process that suppresses actin-based protrusive activity along the axon through RhoA, RhoA-kinase, myosin II, and calpain-mediated proteolysis of cortactin (Loudon et al., 2006; Mingorance-Le Meur and O'Connor, 2009). Thus, a major challenge is to determine the mechanisms that locally regulate the axonal F-actin cytoskeleton resulting in the formation of filopodia from the consolidated axon. In this report, we elucidate this issue by demonstrating that both the extracellular matrix (e.g., laminin) and growth factors (e.g., NGF) locally promote the formation of axonal F-actin patches, and in turn filopodia, through localized microdomains of PI3K activity.
The formation of axonal filopodia can be regulated at the level of the rate of formation of axonal F-actin patches without affecting the emergence of filopodia from the patches. Thus, we suggest that axonal patches represent an axonal “program” for filopodial formation whose activation is regulated by extracellular signaling. The transition phase of F-actin patch development gives rise to the filopodial shaft and likely involves the reorganization of F-actin by actin binding proteins, as demonstrated for the filament bundling protein fascin (Svitkina et al., 2003; Vignjevic et al., 2006). A link between PI3K-mediated patch formation and the transition phase may rest in the connection between PI3K, PKC, and fascin. Fascin is a PKC substrate (Vignjevic et al., 2006) and PI3K can potentiate PKC activity (Parekh et al., 2000). Thus, PI3K activity may regulate formation of filopodial actin bundles from patches through PKC/fascin. Furthermore, Ezrin/Radixin/Moesin are important for the formation of filopodia (Parisiadou et al., 2009) and are under regulation by PI3K (Gallo, 2008). PI3K also drives additional signaling pathways that can regulate the cytoskeleton, including the RhoA-family GTPases Cdc42 and Rac1, and GSK-3β (Cosker and Eickholt, 2007). The axonal F-actin patch system provides an excellent platform for dissecting the functions of additional signaling components in the mechanism used by PI3K to control formation of axonal filopodia.
Although our data show that NGF regulates the formation of filopodia at the level of patch formation but not the emergence of filopodia from patches, it remains a possibility that other signals (e.g., netrin) may elicit formation of filopodia by regulating the transition phase of patch development, possibly through regulation of Ena/Vasp proteins (Lebrand et al., 2004). Furthermore, because the axon shaft contains low levels of F-actin, a major question to be addressed in future studies will be the identity of F-actin nucleating molecules that drive the formation of F-actin patches. Unpublished studies from our laboratory indicate that the Arp2/3 actin nucleating complex contributes to the formation of F-actin patches induced by NGF and PI3Kpep (M. Spillane and G. Gallo, unpublished observations). However, because Arp2/3 nucleates actin filaments branching from existing filaments (Pollard, 2007), additional nucleating systems are also likely operative in F-actin patches, possibly the neuron enriched nucleator cordon bleu (Ahuja et al., 2007) or formins (Paul and Pollard, 2009).
PI3K activity preferentially localizes to protrusive regions of non-neuronal cells and regulates protrusion (Weiger et al., 2009) and cell migration (Cain and Ridley, 2009). Previous studies on growth cones have similarly revealed an accumulation of PIP3 induced by both laminin and NGF (Ménager et al., 2004; Zhou et al., 2004), and PI3K has been involved in the formation of axonal and dendritic branches (Kwon et al., 2006; Drinjakovic et al., 2010). However, the cellular and cytoskeletal mechanism by which PI3K signaling regulates axonal morphology are poorly understood. To our knowledge, this is the first report of axonal microdomains of PIP3 accumulation. Furthermore, we demonstrate a function for these microdomains, the formation of axonal F-actin patches. Given the multitude of roles of PI3K signaling in cells, it seems likely that these microdomains may also have additional functions (e.g., membrane expansion) (Laurino et al., 2005). The restricted localization of these microdomains in axons may reflect localized targeting of PI3K or exclusion of the antagonizing phosphatase PTEN. In growth cones, semaphorin3A targets PTEN to the leading edge (Chadborn et al., 2006), thereby decreasing levels of PIP3, and, in non-neuronal cells, PTEN activity maintains polarized PIP3 levels in the leading edge (Merlot and Firtel, 2003) suggesting that the targeting of PTEN to cellular subdomains may be a relevant mechanism. Additional studies will be required to determine the mechanisms that drive the localized formation of axonal microdomains of PIP3 accumulation.
The data demonstrate that both β1-integrin and TrkA receptor signaling drives formation of actin patches through PI3K signaling. The distributions of F-actin patches vis-à-vis β1-integrins and TrkA receptors indicate that β1-integrins signal a permissive intra-axonal environment for patch formation, whereas TrkA receptors appear to locally induce formation of patches in response to NGF. Our data identify spatial relationships between receptor clusters and patches. Whether the clustering of receptors is required for patch formation or vice versa will be an interesting venue of future investigation. Although integrin signaling through PI3K is well established (Alahari et al., 2002), additional localized intra-axonal mechanisms likely converge to promote the formation of F-actin patches. For example, laminin induces axon branching through the activity of the Ral GTPase (Lalli and Hall, 2005), which promotes filopodial formation (Ohta et al., 1999; Sugihara et al., 2002). It will be of interest in the future to determine whether and how Ral GTPase regulates the formation of F-actin patches and filopodia. Furthermore, laminin promotes PIP3 accumulation in growth cones (Ménager et al., 2004), but whether PIP3 is involved in the Ral pathway remains to be investigated. The reason why not all TrkA clusters correlate with patches after NGF treatment remains to be elucidated. However, differential local availability within the axon of components of signal transduction pathways, cytoskeletal mechanisms, or additional aspects of cytological organization may underlie this heterogeneity.
Consistent with this idea, our observations suggest a role for axonal mitochondria in determining sites of NGF-induced F-actin patch formation. Focal application of NGF induces localized formation of axonal filopodia (Gallo and Letourneau, 1997), recruitment of mitochondria (Chada and Hollenbeck, 2004), and increased mitochondrial potential (Verburg and Hollenbeck, 2008) through a PI3K-based mechanism. Furthermore, PIP2 negatively regulates axonal mitochondria transport (De Vos et al., 2003). Our data indicate that activation of PI3K during NGF signaling suffices to coordinate the sites of actin patch formation with mitochondria. It will be of interest to further dissect the mechanism downstream of PI3K that accomplishes this coordination (Zinsmaier et al., 2009). One possibility is that actin patches may serve as docking sites for mitochondria, as suggested by the finding that depolymerization of actin filaments prevents mitochondria from accumulating at sites of localized axonal NGF signaling (Chada and Hollenbeck, 2004), which also promotes localized increases in axonal F-actin content and the formation of filopodia (Gallo and Letourneau, 1998). It is intriguing to speculate that the coordination of mitochondria with sites of patch formation along the axon by NGF/PI3K may represent a mechanism whereby the relevant building blocks of collateral branches are spatially coordinated to facilitate branch formation.
Mitochondria promote the plasticity of dendritic spines (Li et al., 2004) and the actin regulatory protein WAVE1 can colocalize with mitochondria (Danial et al., 2003; Sung et al., 2008), indicating that mitochondria may localize aspects of the actin regulatory machinery. Interestingly, halting axon extension causes both retrograde redistribution of mitochondria (Morris and Hollenbeck, 1993) and increased axonal protrusive activity (Davenport et al., 1999). To our knowledge, no study has previously directly linked these two variables, but it is tempting to speculate the redistribution of mitochondria in axons as a function of axonal growth state may in turn regulate the localization of protrusive activity along the axon shaft.
In conclusion, this report elucidates some of the earliest steps in the formation of axonal filopodia. The importance of understanding the formation of axonal filopodia is underscored by their roles in collateral branching and synaptogenesis. Our study provides novel insights into the cellular mechanism used by NGF to induce formation of axonal filopodia by demonstrating that the crucial variable regulated by NGF is the rate of formation of axonal F-actin patches through PI3K–Akt. Additional studies will be required to dissect the mechanisms that establish axonal microdomains of PI3K activity, and the signaling and cytoskeletal effectors downstream of PI3K–Akt that ultimately result in the formation of axonal F-actin patches, filopodia, and axon branches.
Footnotes
This work was supported by National Institutes of Health Grant NS048090 (G.G.). We thank Lee Silver for technical assistance and Neeraj Kulkarni for assistance with mitochondrial labeling and data analysis. We also thank the reviewers of this manuscript for their thoughtful and constructive contributions.
References
- Ahuja R, Pinyol R, Reichenbach N, Custer L, Klingensmith J, Kessels MM, Qualmann B. Cordon-bleu is an actin nucleation factor and controls neuronal morphology. Cell. 2007;131:337–350. doi: 10.1016/j.cell.2007.08.030. [DOI] [PMC free article] [PubMed] [Google Scholar]
- Alahari SK, Reddig PJ, Juliano RL. Biological aspects of signal transduction by cell adhesion receptors. Int Rev Cytol. 2002;220:145–184. doi: 10.1016/s0074-7696(02)20005-4. [DOI] [PubMed] [Google Scholar]
- Andersen R, Li Y, Resseguie M, Brenman JE. Calcium/calmodulin-dependent protein kinase II alters structural plasticity and cytoskeletal dynamics in Drosophila . J Neurosci. 2005;25:8878–8888. doi: 10.1523/JNEUROSCI.2005-05.2005. [DOI] [PMC free article] [PubMed] [Google Scholar]
- Bastmeyer M, O'Leary DD. Dynamics of target recognition by interstitial axon branching along developing cortical axons. J Neurosci. 1996;16:1450–1459. doi: 10.1523/JNEUROSCI.16-04-01450.1996. [DOI] [PMC free article] [PubMed] [Google Scholar]
- Bernstein BW, Bamburg JR. Actin-ATP hydrolysis is a major energy drain for neurons. J Neurosci. 2003;23:1–6. doi: 10.1523/JNEUROSCI.23-01-00002.2003. [DOI] [PMC free article] [PubMed] [Google Scholar]
- Cain RJ, Ridley AJ. Phosphoinositide 3-kinases in cell migration. Biol Cell. 2009;101:13–29. doi: 10.1042/BC20080079. [DOI] [PubMed] [Google Scholar]
- Cantley LC. The phosphoinositide 3-kinase pathway. Science. 2002;296:1655–1657. doi: 10.1126/science.296.5573.1655. [DOI] [PubMed] [Google Scholar]
- Cary LA, Han DC, Guan JL. Integrin-mediated signal transduction pathways. Histol Histopathol. 1999;14:1001–1009. doi: 10.14670/HH-14.1001. [DOI] [PubMed] [Google Scholar]
- Chada SR, Hollenbeck PJ. Nerve growth factor signaling regulates motility and docking of axonal mitochondria. Curr Biol. 2004;14:1272–1276. doi: 10.1016/j.cub.2004.07.027. [DOI] [PubMed] [Google Scholar]
- Chadborn NH, Ahmed AI, Holt MR, Prinjha R, Dunn GA, Jones GE, Eickholt BJ. PTEN couples Sema3A signalling to growth cone collapse. J Cell Sci. 2006;119:951–957. doi: 10.1242/jcs.02801. [DOI] [PubMed] [Google Scholar]
- Cohen-Cory S, Fraser SE. Effects of brain-derived neurotrophic factor on optic axon branching and remodelling in vivo. Nature. 1995;378:192–196. doi: 10.1038/378192a0. [DOI] [PubMed] [Google Scholar]
- Cosker KE, Eickholt BJ. Phosphoinositide 3-kinase signalling events controlling axonal morphogenesis. Biochem Soc Trans. 2007;35:207–210. doi: 10.1042/BST0350207. [DOI] [PubMed] [Google Scholar]
- Danial NN, Gramm CF, Scorrano L, Zhang CY, Krauss S, Ranger AM, Datta SR, Greenberg ME, Licklider LJ, Lowell BB, Gygi SP, Korsmeyer SJ. BAD and glucokinase reside in a mitochondrial complex that integrates glycolysis and apoptosis. Nature. 2003;424:952–956. doi: 10.1038/nature01825. [DOI] [PubMed] [Google Scholar]
- Davenport RW, Dou P, Rehder V, Kater SB. A sensory role for neuronal growth cone filopodia. Nature. 1993;361:721–724. doi: 10.1038/361721a0. [DOI] [PubMed] [Google Scholar]
- Davenport RW, Thies E, Cohen ML. Neuronal growth cone collapse triggers lateral extensions along trailing axons. Nat Neurosci. 1999;2:254–259. doi: 10.1038/6360. [DOI] [PubMed] [Google Scholar]
- Dent EW, Gertler FB. Cytoskeletal dynamics and transport in growth cone motility and axon guidance. Neuron. 2003;40:209–227. doi: 10.1016/s0896-6273(03)00633-0. [DOI] [PubMed] [Google Scholar]
- Dent EW, Tang F, Kalil K. Axon guidance by growth cones and branches: common cytoskeletal and signaling mechanisms. Neuroscientist. 2003;9:343–353. doi: 10.1177/1073858403252683. [DOI] [PubMed] [Google Scholar]
- De Vos KJ, Sable J, Miller KE, Sheetz MP. Expression of phosphatidylinositol (4,5) bisphosphate-specific pleckstrin homology domains alters direction but not the level of axonal transport of mitochondria. Mol Biol Cell. 2003;14:3636–3649. doi: 10.1091/mbc.E02-10-0638. [DOI] [PMC free article] [PubMed] [Google Scholar]
- Drinjakovic J, Jung H, Campbell DS, Strochlic L, Dwivedy A, Holt CE. E3 ligase Nedd4 promotes axon branching by downregulating PTEN. Neuron. 2010;65:341–357. doi: 10.1016/j.neuron.2010.01.017. [DOI] [PMC free article] [PubMed] [Google Scholar]
- Duncan HM, Mackler B. Electron transport systems of yeast. 3. Preparation and properties of cytochrome oxidase. J Biol Chem. 1966;241:1694–1697. [PubMed] [Google Scholar]
- Dwivedy A, Gertler FB, Miller J, Holt CE, Lebrand C. Ena/VASP function in retinal axons is required for terminal arborization but not pathway navigation. Development. 2007;134:2137–2146. doi: 10.1242/dev.002345. [DOI] [PMC free article] [PubMed] [Google Scholar]
- Faix J, Breitsprecher D, Stradal TE, Rottner K. Filopodia: Complex models for simple rods. Int J Biochem Cell Biol. 2009;41:1656–1664. doi: 10.1016/j.biocel.2009.02.012. [DOI] [PubMed] [Google Scholar]
- Fu HW, Casey PJ. Enzymology and biology of CaaX protein prenylation. Recent Prog Horm Res. 1999;54:315–342. discussion 342–343. [PubMed] [Google Scholar]
- Gallo G. RhoA-kinase coordinates F-actin organization and myosin II activity during semaphorin-3A-induced axon retraction. J Cell Sci. 2006;119:3413–3423. doi: 10.1242/jcs.03084. [DOI] [PMC free article] [PubMed] [Google Scholar]
- Gallo G. Semaphorin 3A inhibits ERM protein phosphorylation in growth cone filopodia through inactivation of PI3K. Dev Neurobiol. 2008;68:926–933. doi: 10.1002/dneu.20631. [DOI] [PubMed] [Google Scholar]
- Gallo G, Letourneau PC. Localized sources of neurotrophins initiate axon collateral sprouting. J Neurosci. 1998;18:5403–5414. doi: 10.1523/JNEUROSCI.18-14-05403.1998. [DOI] [PMC free article] [PubMed] [Google Scholar]
- Gallo G, Letourneau PC. Different contributions of microtubule dynamics and transport to the growth of axons and collateral sprouts. J Neurosci. 1999;19:3860–3873. doi: 10.1523/JNEUROSCI.19-10-03860.1999. [DOI] [PMC free article] [PubMed] [Google Scholar]
- Gallo G, Letourneau PC. Neurotrophins and the dynamic regulation of the neuronal cytoskeleton. J Neurobiol. 2000;44:159–173. doi: 10.1002/1097-4695(200008)44:2<159::aid-neu6>3.0.co;2-h. [DOI] [PubMed] [Google Scholar]
- Gallo G, Lefcort FB, Letourneau PC. The trkA receptor mediates growth cone turning toward a localized source of nerve growth factor. J Neurosci. 1997;17:5445–5454. doi: 10.1523/JNEUROSCI.17-14-05445.1997. [DOI] [PMC free article] [PubMed] [Google Scholar]
- Gomez-Niño A, Agapito MT, Obeso A, Gonzalez C. Effects of mitochondrial poisons on glutathione redox potential and carotid body chemoreceptor activity. Respir Physiol Neurobiol. 2009;165:104–111. doi: 10.1016/j.resp.2008.10.020. [DOI] [PubMed] [Google Scholar]
- Guan W, Puthenveedu MA, Condic ML. Sensory neuron subtypes have unique substratum preference and receptor expression before target innervation. J Neurosci. 2003;23:1781–1791. doi: 10.1523/JNEUROSCI.23-05-01781.2003. [DOI] [PMC free article] [PubMed] [Google Scholar]
- Hagg T. Collateral sprouting as a target for improved function after spinal cord injury. J Neurotrauma. 2006;23:281–294. doi: 10.1089/neu.2006.23.281. [DOI] [PubMed] [Google Scholar]
- Herweijer MA, Berden JA, Kemp A, Slater EC. Inhibition of energy-transducing reactions by 8-nitreno-ATP covalently bound to bovine heart submitochondrial particles: direct interaction between ATPase and redox enzymes. Biochim Biophys Acta. 1985;809:81–89. doi: 10.1016/0005-2728(85)90170-7. [DOI] [PubMed] [Google Scholar]
- Hiromura M, Okada F, Obata T, Auguin D, Shibata T, Roumestand C, Noguchi M. Inhibition of Akt kinase activity by a peptide spanning the betaA strand of the proto-oncogene TCL1. J Biol Chem. 2004;279:53407–53418. doi: 10.1074/jbc.M403775200. [DOI] [PubMed] [Google Scholar]
- Jaworski J, Spangler S, Seeburg DP, Hoogenraad CC, Sheng M. Control of dendritic arborization by the phosphoinositide-3′-kinase–Akt–mammalian target of rapamycin pathway. J Neurosci. 2005;25:11300–11312. doi: 10.1523/JNEUROSCI.2270-05.2005. [DOI] [PMC free article] [PubMed] [Google Scholar]
- Kaasik A, Safiulina D, Choubey V, Kuum M, Zharkovsky A, Veksler V. Mitochondrial swelling impairs the transport of organelles in cerebellar granule neurons. J Biol Chem. 2007;282:32821–32826. doi: 10.1074/jbc.M702295200. [DOI] [PubMed] [Google Scholar]
- Kalil K, Szebenyi G, Dent EW. Common mechanisms underlying growth cone guidance and axon branching. J Neurobiol. 2000;44:145–158. [PubMed] [Google Scholar]
- Kaplan DR, Miller FD. Neurotrophin signal transduction in the nervous system. Curr Opin Neurobiol. 2000;10:381–391. doi: 10.1016/s0959-4388(00)00092-1. [DOI] [PubMed] [Google Scholar]
- Kaplan DR, Martin-Zanca D, Parada LF. Tyrosine phosphorylation and tyrosine kinase activity of the trk proto-oncogene product induced by NGF. Nature. 1991;350:158–160. doi: 10.1038/350158a0. [DOI] [PubMed] [Google Scholar]
- Ketschek AR, Jones SL, Gallo G. Axon extension in the fast and slow lanes: substratum-dependent engagement of myosin II functions. Dev Neurobiol. 2007;67:1305–1320. doi: 10.1002/dneu.20455. [DOI] [PMC free article] [PubMed] [Google Scholar]
- Kong D, Yamori T. Phosphatidylinositol 3-kinase inhibitors: promising drug candidates for cancer therapy. Cancer Sci. 2008;99:1734–1740. doi: 10.1111/j.1349-7006.2008.00891.x. [DOI] [PMC free article] [PubMed] [Google Scholar]
- Korobova F, Svitkina T. Arp2/3 complex is important for filopodia formation, growth cone motility, and neuritogenesis in neuronal cells. Mol Biol Cell. 2008;19:1561–1574. doi: 10.1091/mbc.E07-09-0964. [DOI] [PMC free article] [PubMed] [Google Scholar]
- Kwon CH, Luikart BW, Powell CM, Zhou J, Matheny SA, Zhang W, Li Y, Baker SJ, Parada LF. Pten regulates neuronal arborization and social interaction in mice. Neuron. 2006;50:377–388. doi: 10.1016/j.neuron.2006.03.023. [DOI] [PMC free article] [PubMed] [Google Scholar]
- Kwon Y, Hofmann T, Montell C. Integration of phosphoinositide- and calmodulin-mediated regulation of TRPC6. Mol Cell. 2007;25:491–503. doi: 10.1016/j.molcel.2007.01.021. [DOI] [PMC free article] [PubMed] [Google Scholar]
- Lalli G, Hall A. Ral GTPases regulate neurite branching through GAP-43 and the exocyst complex. J Cell Biol. 2005;171:857–869. doi: 10.1083/jcb.200507061. [DOI] [PMC free article] [PubMed] [Google Scholar]
- Lau PM, Zucker RS, Bentley D. Induction of filopodia by direct local elevation of intracellular calcium ion concentration. J Cell Biol. 1999;145:1265–1275. doi: 10.1083/jcb.145.6.1265. [DOI] [PMC free article] [PubMed] [Google Scholar]
- Laurino L, Wang XX, de la Houssaye BA, Sosa L, Dupraz S, Cáceres A, Pfenninger KH, Quiroga S. PI3K activation by IGF-1 is essential for the regulation of membrane expansion at the nerve growth cone. J Cell Sci. 2005;118:3653–3662. doi: 10.1242/jcs.02490. [DOI] [PubMed] [Google Scholar]
- Lebrand C, Dent EW, Strasser GA, Lanier LM, Krause M, Svitkina TM, Borisy GG, Gertler FB. Critical role of Ena/VASP proteins for filopodia formation in neurons and in function downstream of netrin-1. Neuron. 2004;42:37–49. doi: 10.1016/s0896-6273(04)00108-4. [DOI] [PubMed] [Google Scholar]
- Lelkes PI, Unsworth BR, Saporta S, Cameron DF, Gallo G. Culture of neuroendocrine and neuronal cells for tissue engineering. In: Vunjak-Novakovic G, Freshney RI, editors. Culture of cells for tissue engineering. New York: Wiley; 2006. Chap 14. [Google Scholar]
- Lemmon MA, Ferguson KM, Abrams CS. Pleckstrin homology domains and the cytoskeleton. FEBS Lett. 2002;513:71–76. doi: 10.1016/s0014-5793(01)03243-4. [DOI] [PubMed] [Google Scholar]
- Lemons ML, Condic ML. Combined integrin activation and intracellular cAMP cause Rho GTPase dependent growth cone collapse on laminin-1. Exp Neurol. 2006;202:324–335. doi: 10.1016/j.expneurol.2006.06.008. [DOI] [PubMed] [Google Scholar]
- Letourneau PC. Actin in axons: stable scaffolds and dynamic filaments. Results Probl Cell Differ. 2009;48:65–90. doi: 10.1007/400_2009_15. [DOI] [PubMed] [Google Scholar]
- Li Z, Okamoto K, Hayashi Y, Sheng M. The importance of dendritic mitochondria in the morphogenesis and plasticity of spines and synapses. Cell. 2004;119:873–887. doi: 10.1016/j.cell.2004.11.003. [DOI] [PubMed] [Google Scholar]
- Loudon RP, Silver LD, Yee HF, Jr, Gallo G. RhoA-kinase and myosin II are required for the maintenance of growth cone polarity and guidance by nerve growth factor. J Neurobiol. 2006;66:847–867. doi: 10.1002/neu.20258. [DOI] [PMC free article] [PubMed] [Google Scholar]
- Luikart BW, Zhang W, Wayman GA, Kwon CH, Westbrook GL, Parada LF. Neurotrophin-dependent dendritic filopodial motility: a convergence on PI3K signaling. J Neurosci. 2008;28:7006–7012. doi: 10.1523/JNEUROSCI.0195-08.2008. [DOI] [PMC free article] [PubMed] [Google Scholar]
- Ménager C, Arimura N, Fukata Y, Kaibuchi K. PIP3 is involved in neuronal polarization and axon formation. J Neurochem. 2004;89:109–118. doi: 10.1046/j.1471-4159.2004.02302.x. [DOI] [PubMed] [Google Scholar]
- Merlot S, Firtel RA. Leading the way: Directional sensing through phosphatidylinositol 3-kinase and other signaling pathways. J Cell Sci. 2003;116:3471–3478. doi: 10.1242/jcs.00703. [DOI] [PubMed] [Google Scholar]
- Minamide LS, Striegl AM, Boyle JA, Meberg PJ, Bamburg JR. Neurodegenerative stimuli induce persistent ADF/cofilin-actin rods that disrupt distal neurite function. Nat Cell Biol. 2000;2:628–636. doi: 10.1038/35023579. [DOI] [PubMed] [Google Scholar]
- Mingorance-Le Meur A, O'Connor TP. Neurite consolidation is an active process requiring constant repression of protrusive activity. EMBO J. 2009;28:248–260. doi: 10.1038/emboj.2008.265. [DOI] [PMC free article] [PubMed] [Google Scholar]
- Morris RL, Hollenbeck PJ. The regulation of bidirectional mitochondrial transport is coordinated with axonal outgrowth. J Cell Sci. 1993;104:917–927. doi: 10.1242/jcs.104.3.917. [DOI] [PubMed] [Google Scholar]
- Ohta Y, Suzuki N, Nakamura S, Hartwig JH, Stossel TP. The small GTPase RalA targets filamin to induce filopodia. Proc Natl Acad Sci U S A. 1999;96:2122–2128. doi: 10.1073/pnas.96.5.2122. [DOI] [PMC free article] [PubMed] [Google Scholar]
- Parekh DB, Katso RM, Leslie NR, Downes CP, Procyk KJ, Waterfield MD, Parker PJ. Beta1-integrin and PTEN control the phosphorylation of protein kinase C. Biochem J. 2000;352:425–433. [PMC free article] [PubMed] [Google Scholar]
- Parisiadou L, Xie C, Cho HJ, Lin X, Gu XL, Long CX, Lobbestael E, Baekelandt V, Taymans JM, Sun L, Cai H. Phosphorylation of ezrin/radixin/moesin proteins by LRRK2 promotes the rearrangement of actin cytoskeleton in neuronal morphogenesis. J Neurosci. 2009;29:13971–13980. doi: 10.1523/JNEUROSCI.3799-09.2009. [DOI] [PMC free article] [PubMed] [Google Scholar]
- Paul AS, Pollard TD. Review of the mechanism of processive actin filament elongation by formins. Cell Motil Cytoskeleton. 2009;66:606–617. doi: 10.1002/cm.20379. [DOI] [PMC free article] [PubMed] [Google Scholar]
- Philips MR. Compartmentalized signalling of Ras. Biochem Soc Trans. 2005;33:657–661. doi: 10.1042/BST0330657. [DOI] [PubMed] [Google Scholar]
- Pollard TD. Regulation of actin filament assembly by Arp2/3 complex and formins. Annu Rev Biophys Biomol Struct. 2007;36:451–477. doi: 10.1146/annurev.biophys.35.040405.101936. [DOI] [PubMed] [Google Scholar]
- Robles E, Huttenlocher A, Gomez TM. Filopodial calcium transients regulate growth cone motility and guidance through local activation of calpain. Neuron. 2003;38:597–609. doi: 10.1016/s0896-6273(03)00260-5. [DOI] [PubMed] [Google Scholar]
- Roche FK, Marsick BM, Letourneau PC. Protein synthesis in distal axons is not required for growth cone responses to guidance cues. J Neurosci. 2009;29:638–652. doi: 10.1523/JNEUROSCI.3845-08.2009. [DOI] [PMC free article] [PubMed] [Google Scholar]
- Soltoff SP, Rabin SL, Cantley LC, Kaplan DR. Nerve growth factor promotes the activation of phosphatidylinositol 3-kinase and its association with the trk tyrosine kinase. J Biol Chem. 1992;267:17472–17477. [PubMed] [Google Scholar]
- Steketee M, Balazovich K, Tosney KW. Filopodial initiation and a novel filament-organizing center, the focal ring. Mol Biol Cell. 2001;12:2378–2395. doi: 10.1091/mbc.12.8.2378. [DOI] [PMC free article] [PubMed] [Google Scholar]
- Sugihara K, Asano S, Tanaka K, Iwamatsu A, Okawa K, Ohta Y. The exocyst complex binds the small GTPase RalA to mediate filopodia formation. Nat Cell Biol. 2002;4:73–78. doi: 10.1038/ncb720. [DOI] [PubMed] [Google Scholar]
- Sung JY, Engmann O, Teylan MA, Nairn AC, Greengard P, Kim Y. WAVE1 controls neuronal activity-induced mitochondrial distribution in dendritic spines. Proc Natl Acad Sci U S A. 2008;105:3112–3116. doi: 10.1073/pnas.0712180105. [DOI] [PMC free article] [PubMed] [Google Scholar]
- Svitkina TM, Bulanova EA, Chaga OY, Vignjevic DM, Kojima S, Vasiliev JM, Borisy GG. Mechanism of filopodia initiation by reorganization of a dendritic network. J Cell Biol. 2003;160:409–421. doi: 10.1083/jcb.200210174. [DOI] [PMC free article] [PubMed] [Google Scholar]
- Takei N, Nawa H. Roles of neurotrophins on synaptic development and functions in the central nervous system. Hum Cell. 1998;11:157–165. [PubMed] [Google Scholar]
- Tucker BA, Rahimtula M, Mearow KM. Integrin activation and neurotrophin signaling cooperate to enhance neurite outgrowth in sensory neurons. J Comp Neurol. 2005;486:267–280. doi: 10.1002/cne.20518. [DOI] [PubMed] [Google Scholar]
- Verburg J, Hollenbeck PJ. Mitochondrial membrane potential in axons increases with local nerve growth factor or semaphorin signaling. J Neurosci. 2008;28:8306–8315. doi: 10.1523/JNEUROSCI.2614-08.2008. [DOI] [PMC free article] [PubMed] [Google Scholar]
- Vignjevic D, Kojima S, Aratyn Y, Danciu O, Svitkina T, Borisy GG. Role of fascin in filopodial protrusion. J Cell Biol. 2006;174:863–875. doi: 10.1083/jcb.200603013. [DOI] [PMC free article] [PubMed] [Google Scholar]
- Weiger MC, Wang CC, Krajcovic M, Melvin AT, Rhoden JJ, Haugh JM. Spontaneous phosphoinositide 3-kinase signaling dynamics drive spreading and random migration of fibroblasts. J Cell Sci. 2009;122:313–323. doi: 10.1242/jcs.037564. [DOI] [PMC free article] [PubMed] [Google Scholar]
- Whitlon DS, Baas PW. Improved methods for using glass coverslips in cell culture and electron microscopy. J Histochem Cytochem. 1992;40:875–877. doi: 10.1177/40.6.1588032. [DOI] [PubMed] [Google Scholar]
- Williams EJ, Doherty P. Evidence for and against a pivotal role of PI 3-kinase in a neuronal cell survival pathway. Mol Cell Neurosci. 1999;13:272–280. doi: 10.1006/mcne.1999.0750. [DOI] [PubMed] [Google Scholar]
- Yoshihara Y, De Roo M, Muller D. Dendritic spine formation and stabilization. Curr Opin Neurobiol. 2009;19:146–153. doi: 10.1016/j.conb.2009.05.013. [DOI] [PubMed] [Google Scholar]
- Zhou FQ, Zhou J, Dedhar S, Wu YH, Snider WD. NGF-induced axon growth is mediated by localized inactivation of GSK-3beta and functions of the microtubule plus end binding protein APC. Neuron. 2004;42:897–912. doi: 10.1016/j.neuron.2004.05.011. [DOI] [PubMed] [Google Scholar]
- Zinsmaier KE, Babic M, Russo GJ. Mitochondrial transport dynamics in axons and dendrites. Results Probl Cell Differ. 2009;48:107–139. doi: 10.1007/400_2009_20. [DOI] [PubMed] [Google Scholar]