Abstract
A hard X-ray full field microscope from Xradia Inc. has been installed at SSRL on a 54-pole wiggler end station at beam line 6-2. It has been optimized to operate from 5–14 keV with resolution as high as 30 nm. High quality images are achieved using a vertical beam stabilizer and condenser scanner with high efficiency zone plates with 30 nm outermost zone width. The microscope has been used in Zernike phase contrast, available at 5.4 keV and 8 keV, as well as absorption contrast to image a variety of biological, environmental and materials samples. Calibration of the X-ray attenuation with crystalline apatite enabled quantification of bone density of plate-like and rod-like regions of mouse bone trabecula. 3D tomography of individual lacuna revealed the surrounding cell canaliculi and processes. 3D tomography of chiral branched PbSe nanowires showed orthogonal branches around a central nanowire.
Keywords: X-ray Microscopy, bone, trabecula, nanowires
INTRODUCTION
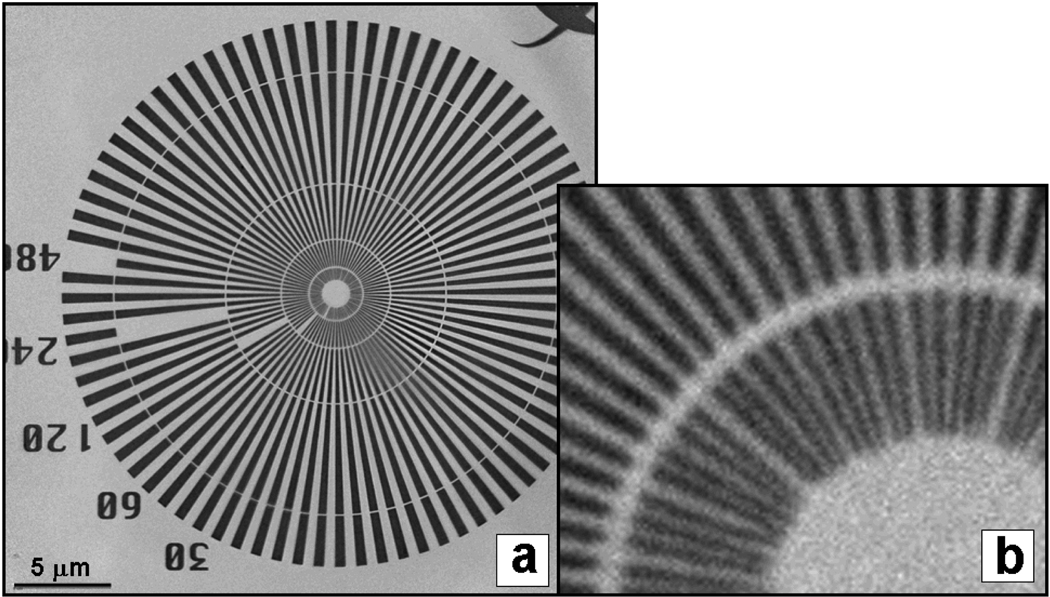
The full-field transmission x-ray microscope (TXM) on BL 6-2 at the Stanford Synchrotron Radiation Lightsource (SSRL), based on an Xradia lab model [1] is being used to image biological, environmental [2] and materials samples at up to 30 nm resolution. Used in absorption contrast from 5–14 keV and Zernike phase contrast at 5.4 and 8 keV, the TXM produces clean images at resolutions as high as 30 nm, as shown in Figure 1. Image quality has been recently improved due to upgrades to the micro zone plates [3], addition of condenser scanner to fill out the field of view and mirror pitch feedback system to maintain vertical stability of the beam. The TXM can image samples up to 50–100 microns thick, with 50 micron depth of focus. In this paper we feature 3D tomography and density quantification of trabeculae from mouse bone, and tomographic imaging of PbSe nanowires.
FIGURE 1.
Siemens test pattern with 30 nm innermost dimension imaged at 5.4 keV using stacked zone plate with 30 nm outermost zone width (a) and blowup of center region (b). Modulation transfer function (not shown) confirmed 30 nm resolution.
METHODS
The TXM is installed on a 54-pole Wiggler end station at SSRL BL6-2 which is equipped with a vertically collimating silicon mirror M0, located at 13.9 m from the source, followed by a LN-cooled Si(111) monochromator and then a toroidal silicon mirror M1, located at 18.8 m, that provides a focused beam at the TXM entrance slit located at 30 m from the source and 2 m upstream of the first optical element of the TXM. A beam stabilization system at the entrance slit of the TXM feeds back to the M1 mirror pitch via a piezo-electric transducer to ensure long-term vertical stability of the x-ray beam at the entrance slit, which is set with an opening of 300 µm. The first optical element of the TXM consists of a capillary condenser that forms a hollow cone illumination at the sample position. A pinhole to remove the remaining direct beam is inserted between the output of the condenser and the sample which is positioned by a kinematic mount on a high precision x-y-z-θ sample stage. Micro zone plates with 30–45 nm outermost zone widths focus the transmitted image onto the detector system, which consists of a scintillator screen, magnifying objective, and CCD detector. An optional phase ring can be inserted after the micro zone plate to provide Zernike phase contrast for low-absorption organic material. Typical imaging times are 1 to 20 seconds, enabling collection of a tomography set in under 30 minutes. Iterative reconstruction and mosaic tomography reconstruction using filtered back projection are available using MATLAB. A flat field of view is obtained by scanning the condenser in a programmable pattern (typically Lissajous) to spread the illumination over the 30 µm2 field of view. In cases where additional homogenization is required, a rotating, small angle scattering diffuser can be inserted into the beam approximately 3 m upstream of the TXM entrance slit.
RESULTS AND DISCUSSION
Bio-imaging and Density Quantification of Trabecula in Mouse Bone
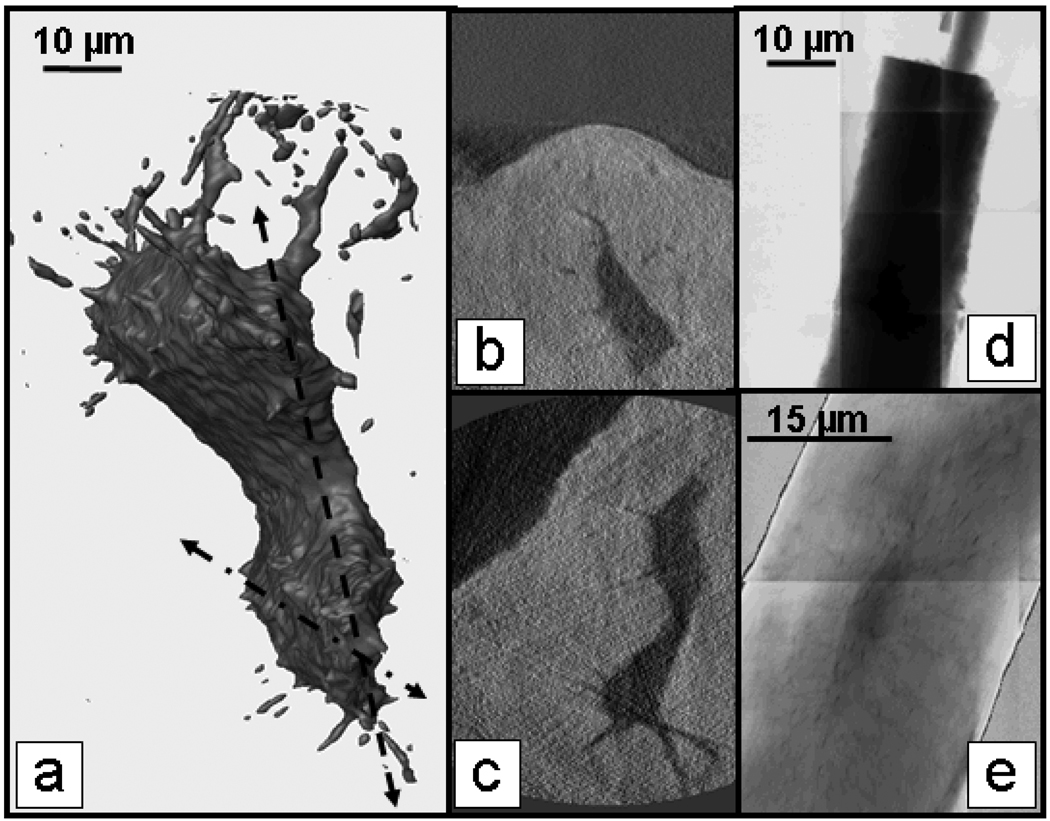
The imaging and density quantification of mouse bone was performed in collaboration with E. Almeida of NASA Ames, and M. C. H. van der Meulen of Cornell University. Trabeculae from the proximal tibial metaphysis of C57Bl6 mice were fixed in formalin and prepared by cutting open the metaphysis, washing away marrow, and cutting sections of cancellous tissue to expose individual trabeculae. In the initial studies we have obtained high-resolution images of lacunae (mineralized cavities that house bone cells) and canaliculi, the small (30–50 nm diameter) mineralized channels containing cell processes that facilitate communication and nutrient transfer between mature bone cells. The ability to image the 3D ultrastructure of bone on the nanometer level is unique to this method, and will be useful for studies on treatments that affect bone density and cell morphology. 3D tomography of a lacuna (Fig. 2a) imaged in Zernike phase contrast at 5.4 keV revealed canaliculi extending from the lacuna. Slices from the reconstruction (Fig. 2b and 2c) showed more extended regions of the canaliculi.
FIGURE 2.
Mouse bone tibia trabecula imaged at 5.4 keV. 3D tomography of bone cell lacuna (a) and slices (b) and (c) from dotted dashed line and dashed line in (a), respectively reveal canaliculi extending from the main lacuna. Mosaic absorption image (ln I0/I) of crystalline chlorapatite in absorption contrast (d) plotted vs. thickness from reconstructed slices was used for density calibration. Density map of trabecula (e) made by dividing absorption image by thickness map from tomographic reconstruction shows lower density (darker) lacuna and canaliculi. Resolution is 40 nm in tomography, and 30 nm in 2D images (d and e).
Density calibration was performed using crystalline chlorapatite (Fig. 2d), a structure close to the mineral phase responsible for the x-ray attenuation of bone tissue at 5.4 keV. The organic fraction of bone tissue has minimal absorbance at this energy, as verified by imaging of bone that was EDTA-treated to remove the mineral. For mineral density calibration, images of crystalline chlorapatite taken every 1° from −90 to 90° were reconstructed with an in-house MATLAB routine using filtered back projection. Mosaic absorption images of the crystalline apatite (ln I0/I) were plotted vs. crystal thickness from maps obtained from the MATLAB reconstruction, and linear fitting yielded the attenuation coefficient for the mineral.
Mosaics of bone trabeculae taken every 5° from −90 to 90° were reconstructed using the same MATLAB routine as for the crystalline apatite, and absorption was divided by thickness to obtain a density map of a trabecula (Fig. 2e). The reduced density of the lacuna and canaliculi are evident from the density map. The rod-like regions of the trabecula were found to have generally higher density (51–54% of pure crystalline apatite) than the plate like regions (44–53% of pure crystalline apatite). These techniques will be used to study nanoscale effects of treatments that affect bone tissue mineral density and ultrastructure.
3D Tomography of PbSe Nanowires
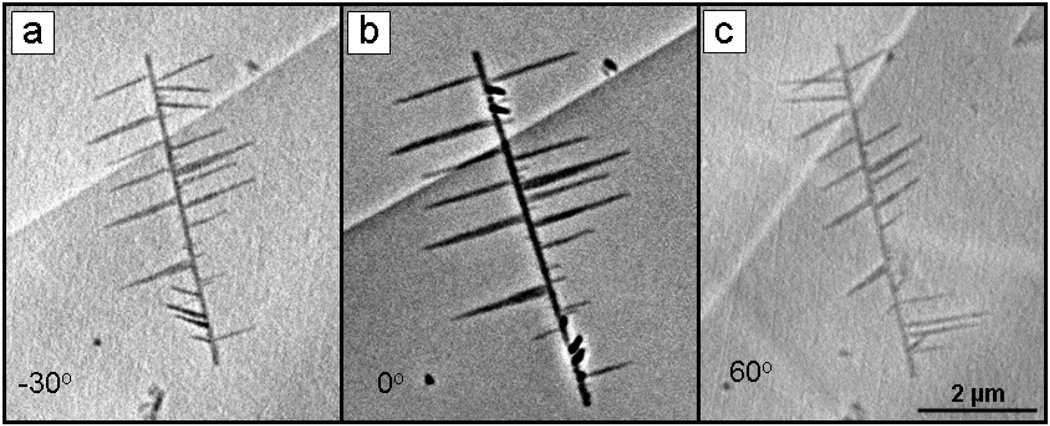
The imaging of lead selenide nanowires was performed in collaboration with Yi Cui of Stanford University. The nanowires, which have potential applications in energy harvesting or other nano-electronics, are made by vapor-liquid-solid branching from a central nanowire template [4]. An averaged (5×10 second) image taken at 5.4 keV in Zernike phase contrast (Fig. 3b) shows the orthogonal branches extending from the central nanowire. In images of the same nanowire seen at −30° and 60° the branches can all be seen clearly. The nanowire and branches have been imaged previously using TEM and SEM, but this is the first 3-dimensional imaging.
FIGURE 3.
TXM images taken at 5.4 keV in Zernike phase contrast of PbSe nanowire with orthogonal branches. Center image taken at 0° (b) is average of 5 10 second images, binning 1. Images (a) and (c) are 10 second exposures, binning 1 at −30° and 60° respectively. Resolution is 30 nm.
In summary, the TXM at BL 6-2 at SSRL is being used to obtain clear, high-resolution (30 nm) images of a range of sample types. Zernike phase contrast imaging emphasizes interfaces within organic biological tissue, and absorption images can be used to quantify and spatially map mineral density. 3D tomographic reconstruction reveals details of geometric orientation, and of morphological features from reconstructed slices. The microscope is also capable of collecting x-ray fluorescence with a 3 micron focused spot to confirm elemental identity. We are also developing the capability for XANES imaging, and planning to add a cryostat in the near future.
ACKNOWLEDGMENTS
This work has been supported by the National Institutes of Health (NIH)/ National Institute of Biomedical Imaging and Bioengineering (NIBIB) grant number 5R01EB004321. E.A. is supported by National Aeronautics and Space Administration (NASA) grant number RAD2004-0000-0110. Mouse experiments were supported by NIH National Institute of Aging grant number R01-AG028664 to M.C.H.M. Y.C. is supported by the Stanford Global Energy and Climate Project and the Center for Probing the Nanoscale (CPN) with National Science Foundation Grant PHY-0425897. J.Z. is a CPN Fellow. SSRL is supported by the Department of Energy, Office of Basic Energy Sciences.
Footnotes
PACS: 68.37.Yz X-ray microscopy, 87.85.Pq biomedical imaging, S87.17.-d Cellular structure & processes, N61.46Km Structure of nanowires.
REFERENCES
- 1.Tkachuk A, Duewer F, Cui H, Feser M, Wang S, Yun W. Z. Kristallogr. 2007;222:650–655. [Google Scholar]
- 2.Patty C, Barnett B, Mooney B, Kahn A, Levy S, Liu Y, Pianetta P, Andrews JC. Environ. Sci. Technol. 2009;43:7397–7402. doi: 10.1021/es901076q. [DOI] [PMC free article] [PubMed] [Google Scholar]
- 3.Chu YS, Yi JM, DeCarlo F, Shen Q, Lee W-K, Wu HJ, Wang CL, Wang JY, Liu CJ, Wang CH, Wu SR, Chien CC, Hwu Y, Tkachuk A, Yun W, Feser M, Liang KS, Yang CS, Je JH, Margaritondo G. Appl Phys Lett. 2008;92:103119-1–103119-3. [Google Scholar]
- 4.Zhu J, Peng H, Marshall AF, Barnett DM, Nix WD, Cui Y. Nature Nanotechnology. 2008;3:477–481. doi: 10.1038/nnano.2008.179. [DOI] [PubMed] [Google Scholar]


