Abstract
The study was undertaken to examine the potential cross talk between vasopressin and angiotensin II (ANG II) intracellular signaling pathways. We investigated in vivo and in vitro whether vasopressin-induced water reabsorption could be attenuated by ANG II AT1 receptor blockade (losartan). On a low-sodium diet (0.5 meq/day) dDAVP-treated animals with or without losartan exhibited comparable renal function [creatinine clearance 1.2 ± 0.1 in dDAVP+losartan (LSDL) vs. 1.1 ± 0.1 ml·100 g−1·day−1 in dDAVP alone (LSD), P > 0.05] and renal blood flow (6.3 ± 0.5 in LSDL vs. 6.8 ± 0.5 ml/min in LSD, P > 0.05). The urine output, however, was significantly increased in LSDL (2.5 ± 0.2 vs. 1.8 ± 0.2 ml·100 g−1·day−1, P < 0.05) in association with decreased urine osmolality (2,600 ± 83 vs. 3,256 ± 110 mosmol/kgH2O, P < 0.001) compared with rats in LSD. Immunoblotting revealed significantly decreased expression of medullary AQP2 (146 ± 6 vs. 176 ± 10% in LSD, P < 0.01), p-AQP2 (177 ± 13 vs. 214 ± 12% in LSD, P < 0.05), and AQP3 (134 ± 14 vs. 177 ± 11% in LSD, P < 0.05) in LSDL compared with LSD. The expressions of AQP1, the α1- and γ-subunits of Na-K-ATPase, and the Na-K-2Cl cotransporter were not different among groups. In vitro studies showed that ANG II or dDAVP treatment was associated with increased AQP2 expression and cAMP levels, which were potentiated by cotreatment with ANG II and dDAVP and were inhibited by AT1 blockade. In conclusion, ANG II AT1 receptor blockade in dDAVP-treated rats on a low-salt diet was associated with decreased urine concentration and decreased inner medullary AQP2, p-AQP2, and AQP3 expression, suggesting that AT1 receptor activation plays a significant role in regulating aquaporin expression and modulating urine concentration in vivo. Studies in collecting duct cells were confirmatory.
Keywords: aquaporin, urine concentration, cAMP
there is substantial evidence that arterial underfilling, either due to decreased cardiac output, e.g., heart failure, or systemic arterial vasodilation, e.g., cirrhosis, is associated with activation of the neurohumoral axis, including the sympathetic nervous system, the renin-angiotensin system, and arginine vasopressin (AVP) (22, 23). This neurohumoral response involves compensatory systemic vasoconstriction and renal sodium and water retention to attenuate the arterial underfilling.
Much is known about the systemic effects of these components of neurohormonal activation by the use of angiotensin-converting enzyme inhibitors, angiotensin receptor blockers, mineralocorticoid antagonists, and most recently vasopressin receptor antagonists (22, 24, 25). However, little is known about any potential interaction or cross talk between AVP and angiotensin II (ANG II) at the cellular and molecular level in the kidney.
In the collecting duct, AVP binds to the vasopressin V2 receptor on the basolateral membrane of the principal cells, increasing the intracellular levels of cAMP via adenylyl cyclase and thereby activating protein kinase A, which phosphorylates aquaporin-2 (AQP2) with translocation of the water channel from intracellular vesicles to the apical plasma membrane (3, 7, 8, 19, 20). This results in increased osmotic water permeability and urinary concentration. Vasopressin-induced increased intracellular cAMP is also capable of stimulating AQP2 gene transcription (12, 18), which results in increased AQP2 protein abundance in long-term regulation.
On this background, there is preliminary evidence suggesting a potential relationship between ANG II and AVP in the kidney. ANG II has been shown to stimulate the vasopressin V2 receptor messenger RNA in the inner medullary collecting duct (30) and potentiates AVP-dependent cAMP in Chinese hamster ovary cells transfected with AT1a and V2 receptors (13). The ANG II receptor (AT1) blocker losartan has been shown to decrease AVP-mediated cAMP accumulation in the thick ascending limbs and normalize increased Na-K-2Cl cotransporter (NKCC2) in rats with chronic congestive heart failure (27). Rat inner medullary collecting duct cells treated with ANG II and dDAVP demonstrated increased cAMP concentrations and increased AQP2 labeling in the plasma membrane (i.e., trafficking) (17) compared with dDAVP treatment alone, but this study could not provide information about the effect of ANG II, in the presence or absence of dDAVP, on AQP2 protein expression, including the role of cAMP. In vivo and in vitro studies have not been performed to examine the interrelationship of AVP and ANG II with in AQP2 trafficking and long-term protein expression.
Studies were therefore undertaken to examine the interrelationships between AVP and ANG II in AQP2 trafficking and protein expression in the collecting duct. In the present study, a rat model of moderate sodium restriction allowed for the in vivo examination of the relationship between AVP and ANG II in aquaporin and urinary concentration in the absence of evidence for acute renal dysfunction. In vitro studies were also performed on collecting duct cells to further examine this potential interaction.
MATERIALS AND METHODS
Experimental animals.
The study protocol was approved by the University of Colorado Institutional Animal Care and Use Committee. Male Wistar rats (180–220 g body wt) were allowed to acclimate to Denver, CO, altitude (1,500 m) for 4 days before the experimental protocols. All animals were acclimatized to metabolic cages for a continuous 2-day period before initiation of the study. The animals were housed individually in metabolic cages for the entire experimental period and exposed to a 12:12-h light-dark cycle and a constant ambient temperature. Body weight, daily water intake, urinary volume, and food intake were monitored.
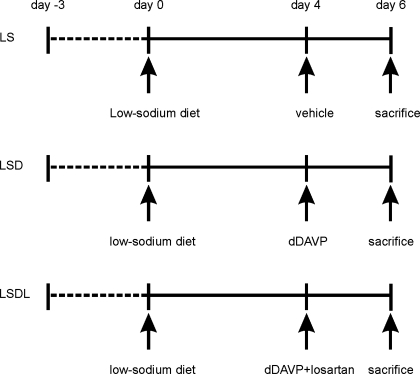
Rats were divided randomly into three low-sodium study groups: low-sodium diet only (to induce high plasma endogenous ANG II levels; LS, n = 12); dDAVP treatment (LSD; n = 9); and combination treatment with dDAVP and AT1 receptor antagonist losartan (LSDL; n = 12). Rats from the three groups received an agar gel diet to provide 25 ml water and 15 g of nominally NaCl-free purified rodent chow (product 53140000, Zeigler Bros., Gardner, PA) with the addition of 0.5 meq NaCl/day for a 4-day equilibration. The choice of the daily dietary sodium intake was chosen because lower intake of NaCl compromised renal function when combined with angiotensin receptor blocker treatment (28). For the LSD group, under anesthesia osmotic minipumps (model 1003D; Alzet, Palo Alto, CA) were implanted subcutaneously in rats to deliver 20 ng/h of dDAVP for another 2 days. For LSDL rats, both dDAVP (20 ng/h) and losartan (20 mg·kg−1·day−1) were given subcutaneously by implanting osmotic minipumps (model 1003D; Alzet) for another 2 days (the losartan dose has been shown to be sufficient to block the rise in blood pressure resulting from long-term infusion of ANG II) (28). Rats in the LS group were given vehicle infusion alone (Fig. 1).
Fig. 1.
Diagram of the study design. Rats were divided randomly into 3 low-sodium study groups: low-sodium diet only (LS), dDAVP treatment (LSD), combination treatment with dDAVP and AT1a receptor antagonist losartan (LSDL). Rats from the 3 groups received an agar gel diet to provide 25 ml water and 15 g of nominally NaCl-free purified rodent chow with addition of 0.5 meq NaCl/day for a 4-day equilibration. For the LSD group, rats were infused with dDAVP (20 ng/h) of dDAVP for another 2 days. For LSDL rats, both dDAVP (20 ng/h) and losartan (20 mg·kg−1·day−1) were infused for another 2 days. Rats in the LS group were given vehicle infusion alone.
At the end of the experiment, all rats were anesthetized with pentobarbital sodium and blood samples were collected from the aorta for measurement of serum electrolytes, osmolality, creatinine, and blood urea nitrogen concentrations. For each animal, one kidney was rapidly removed and dissected into cortex/outer medulla and inner medulla and was processed for membrane fractionation and semiquantitative immunoblotting.
Measurement of renal blood flow and mean arterial pressure.
Mean arterial pressure (MAP) was measured via a carotid artery catheter connected to a Transpac IV transducer and monitored continuously using Windaq Waveform recording software (Dataq Instruments, Akron, OH). For renal blood flow (RBF) measurement, the kidney was exposed by a left subcostal incision and was dissected free from perirenal tissue, and renal arteries were isolated for the determination using a blood flowmeter and probe (0.5v; Transonic Systems, Ithaca, NY).
Biochemical measurements.
Serum and urinary osmolality were measured by freezing-point depression (Advanced Instruments, Norwood, MA). Serum and urinary creatinine were measured (Beckman Instruments, Fullerton, CA). Creatinine clearance at 24 h was used as an estimate of glomerular filtration rate. Serum Na+ concentration were measured by flame photometry.
Antibodies.
Antibodies to AQP2 (19), AQP2 phosphorylated at the protein kinase A phosphorylation consensus site [Ser256; phosphorylated AQP2 (p-AQP2), kindly provided by Dr. Søren Nielsen, University of Aarhus, Aarhus, Denmark] (3), AQP3 (4), and NKCC2 (5) have been previously characterized. Anti-Na-K-ATPase α1-subunit antibody was obtained from Upstate Biotechnology (Lake Placid, NY). Anti-Na-K-ATPase γ-subunit antibody was a kind gift from Dr. Tomas Berl (UC Denver, Aurora, CO). Anti-AQP1 antibody was obtained from Chemicon International (Temecula, CA).
Protein isolation.
Kidneys were placed in ice-cold isolation solution containing 250 mM sucrose, 25 mM imidazole, and 1 mM EDTA (pH 7.2) with 0.1 vol% protease inhibitors (0.7 μg/ml pepstatin, 0.5 μg/ml leupeptin, and 1 μg/ml aprotinin) and 200 M phenylmethylsulfonyl fluoride. As noted above, kidneys were dissected on ice into cortex/outer medulla and inner medulla. Tissue samples were immediately homogenized in a glass homogenizer at 4°C. After homogenization, protein concentration was determined for each sample by the Bradford method (Bio-Rad, Richmond, CA). Tissue protein was utilized for immunoblotting for AQP water channels and Na+ transporters.
Western blot analysis.
SDS-PAGE was performed on 4–15% gradient gels (for NKCC2), 10% (for γ-subunit Na-K-ATPase), and 12% acrylamide gels. After transfer by electroelution to polyvinylidene difluoride membranes (Millipore, Bedford, MA), the blots were blocked with 5% nonfat dry milk in phosphate-buffered saline and then probed with the respective antibodies at 4°C overnight. The membranes were washed with buffer containing phosphate-buffered saline with 0.1% Tween 20 (J. T. Baker, Phillipsburg, NJ) and then exposed to secondary antibody for 1 h at room temperature. Subsequent detection of the specific proteins was carried out by enhanced chemiluminescence (Amersham, Arlington Heights, IL) according to the manufacturer's instructions. Densitometric results were reported as integrated values (area density of band) and expressed as a percentage compared with the mean value in controls (100%). Blots are representative of results obtained from all samples. Densitometry reflects mean and SE of all samples.
Immunohistochemistry.
Animal kidneys were fixed with 3% paraformaldehyde in 0.1 M cacodylate buffer (pH 7.4) by retrograde perfusion via the aorta. Kidney blocks were dehydrated, embedded in paraffin, and cut into 2-μm-thick slices and staining was carried out using indirect immunoperoxidase (29). The slides were scanned and semi quantified using ScanScope positive pixel count software (Aperio Digital Pathology Systems, Vista, CA). We performed densitometric analysis of AQP2 labeling intensity in the inner medulla of rats from three groups. Twelve equal areas in the inner medulla were randomly selected in each slide in blinded ways, and the sum of positive pixel intensity was measured and calculated per square micrometer in each group.
Cell cultures.
mpkCCDc14 cells are an immortalized mouse cortical collecting duct cell line, which is derived from microdissected cortical collecting ducts of an SVPK/Tag transgenic mouse. These cells exhibit most of the major functional properties of collecting duct principal cells and natively express AQP2 (1, 11). Cells were maintained at 37°C and 5% CO2 with modified DM medium. All experiments were performed on confluent cells seeded on permeable filters between passages 25 and 35, as described previously (1, 11). After confluence, cells were exposed to serum-free medium with no growth factors for 24 h before use. Cells were treated with ANG II (10−9 M), dDAVP (10−10 M), or cotreatment with both ANG II and dDAVP with or without AT1 receptor antagonist losartan (5 × 10⁻⁶ M) for 16 h. Losartan was added for 30 min before ANG II, dDAVP, or both. Samples were harvested for immunoblot analysis of AQP2 and intracellular cAMP measurement.
Measurement of intracellular cAMP.
cAMP was extracted with 150 μl of 0.1 N HCl at room temperature for 20 min and was measured by an EIA kit (Cayman Chemical, Ann Arbor, MI) according to the manufacturer's instructions. Results were expressed in picomoles per milliliter of cell lysate. Each determination was performed in triplicate.
Statistical methods.
Multiple group comparisons were performed using a one-way ANOVA with posttest according to Newman-Keuls. Values are means ± SE.
RESULTS
Normal renal function and hemodynamics in rats with low-sodium diet and ANG II AT1 receptor blocker losartan.
In the present study, moderate sodium restriction was used to induce endogenous ANG II but to avoid to compromise renal function. Rats treated with both dDAVP and losartan showed comparable serum creatinine and creatinine clearance (1.1 ± 0.1 in LSDL vs. 1.2 ± 0.1 ml·100 g−1·day−1 in LSD, P > 0.05) (Table 1). dDAVP increased MAP in rats of the LSD group compared with LS, and losartan reduced MAP in LSDL to the control level. There were no significant changes in RBF among three groups (Table 1).
Table 1.
Hemodynamics and functional data
| LS (n = 12) | LSD (n = 9) | LSDL (n = 12) | |
|---|---|---|---|
| Body wt, g | 227 ± 8 | 234 ± 10 | 228 ± 7 |
| Mean blood pressure, mmHg | 101 ± 5 (n = 6) | 113 ± 1.1a (n = 6) | 92 ± 4e (n = 6) |
| Renal blood flow, ml/min | 5.1 ± 0.5 (n = 6) | 6.8 ± 0.5 (n = 6) | 6.3 ± 0.5 (n = 6) |
| Urine output, ml·100 g−1·24 h−1 | 5.9 ± 0.4 | 1.8 ± 0.2c | 2.5 ± 0.2c,d |
| U-Osm, mosmol/kgH2O | 922 ± 61 | 3,256 ± 110c | 2,600 ± 83a,f |
| S-Osm, mosmol/kgH2O | 301 ± 1 | 256 ± 5c | 254 ± 2c |
| S-Na, μmol/l | 144 ± 1 | 117 ± 2c | 113 ± 2c |
| S-creatinine, mg/dl | 0.4 ± 0.02 | 0.2 ± 0.02a | 0.3 ± 0.03 |
| C-cr, ml·100 g−1·day−1 | 0.9 ± 0.05 | 1.2 ± 0.1 | 1.1 ± 0.1 |
| UNaV, μmol·kg−1·min−1 | 1.7 ± 0.2 | 3.0 ± 0.4a | 4.6 ± 0.4c,e |
| FENa, % | 0.1 ± 0.01 | 0.2 ± 0.05 | 0.5 ± 0.1b,d |
Values are means ± SE. n, No. of rats; U-Osm and S-Osm, urine and serum osmolality, respectively; S-Na and S-creatinine, serum Na and serum creatinine, respectively; C-cr, creatinine clearance; UNaV, urine Na excretion; FENa, fractional excretion of Na. Low-sodium diet group (LS) was fed a base diet with low Na and added agar (0.6%) and deionized water, 25 ml/15 g of rat chow (200 g/g body wt); 0.5 meq/day of NaCl was added per 15 g of rat chow for 6 days. dDAVP (20 ng/h; LSD) and losartan (20 mg/kg/day; LSDL) were infused from day 4 to day 6. a,b,cP < 0.05, P < 0.01, P < 0.001 compared with LS, respectively. d,e,fP < 0.05, P < 0.01, P < 0.001, compared with LSD, respectively.
AT1 receptor blockade in dDAVP-treated rats was associated with increased urine output and reduced urinary osmolality.
Urine output was significantly increased in rats treated with both dDAVP and losartan compared with rats treated with dDAVP alone (2.5 ± 0.2 in LSDL vs. 1.8 ± 0.2 ml·100 g−1·day−1 in LSD, P < 0.05). Urinary osmolality was significantly reduced in LSDL compared with LSD rats (2,600 ± 83 in LSDL vs. 3,256 ± 110 mosmol/kgH2O in LSD, P < 0.001) (Table 1), indicating that losartan partly blocked urine concentration induced by dDAVP. Rats treated with dDAVP showed significant hyponatremia, whereas sodium excretion in both LSD and LSDL groups was significantly increased compared with LS (Table 1). The comparable hyponatremia in the LSD and LSDL groups despite better urine output and urinary dilution indicated that the LSDL group ingested more water. This would be expected given the lower MAP in the LSDL group (92 ± 4 vs. 113 ± 1 mmHg) which would tend to stimulate thirst.
Losartan cotreatment with dDAVP reduces protein expression and apical labeling of AQP2 in kidney inner medulla, but not in cortex and outer medulla.
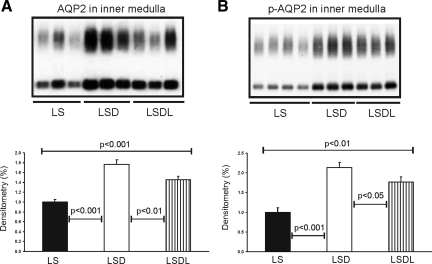
Semiquantitative immunoblotting of proteins prepared from the kidney inner medulla revealed that AQP2 expression was significantly increased in response to dDAVP treatment (176 ± 10 in LSD vs. 100 ± 6% in LS, P < 0.001; Fig. 2A), whereas AQP2 expression was decreased in response to both dDAVP and losartan treatment (146 ± 6 in LSDL vs. 176 ± 10% in LSD, P < 0.01; Fig. 2A) compared with LSD. Moreover, inner medullary p-AQP2 expression was significantly increased in response to dDAVP treatment (214 ± 12 in LSD vs. 100 ± 11% in LS, P < 0.001; Fig. 2B), but was reduced in response to both dDAVP and losartan treatment (177 ± 13 in LSDL vs. 214 ± 12% in LSD, P < 0.05; Fig. 2B) compared with LSD. Thus AT1 receptor blockade in rats treated with dDAVP significantly decreased the dDAVP-induced upregulation of AQP2 and p-AQP2 in the inner medulla.
Fig. 2.
Semiquantitative immunoblotting of proteins prepared from the inner medulla. A: immunoblot is reacted with anti-aquaporin-2 (AQP2) and reveals 29- and 35- to 50-kDa AQP2 bands. Densitometric analysis reveals that the expression of inner medullary AQP2 is significantly increased in response to dDAVP treatment in the LSD group compared with control rats (LS), whereas AQP2 expression is significantly reduced in response to cotreatment of dDAVP and losartan in the LSDL group compared with LSD rats. B: immunoblot is reacted with anti-p-AQP2 (phosphorylated in the PKA-phosphorylation consensus site Ser-256) and reveals 29- and 35- to 50-kDa p-AQP2 bands. Densitometric analysis reveals that expression of inner medullary p-AQP2 is significantly increased in response to dDAVP treatment in the LSD group compared with LS rats, whereas p-AQP2 expression is significantly decreased in response to the cotreatment of dDAVP and losartan in the LSDL group compared with LSD rats.
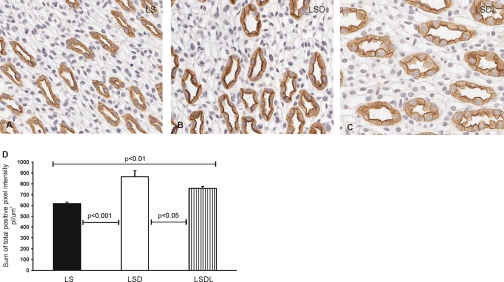
Immunoperoxidase labeling of AQP2 in the kidney inner medulla was associated with the apical and intracellular domains of inner medullary collecting ducts (Fig. 3, A–C). Compared with the LS group (Fig. 3A), strong apical immunoperoxidase labeling of AQP2 was observed in the LSD group (Fig. 3B), whereas losartan cotreatment reduced the apical labeling of AQP2 (Fig. 3C). Semiquantitative analysis of AQP2 immunoperoxidase labeling was performed to quantify the apparent changes in AQP2 labeling intensity at the apical and intracellular domains. The sum of total positive pixel intensity in LSD (866 ± 55 pl/μm2) was significantly higher than that in LS (617 ± 13 pl/μm2, P < 0.001), and losartan treatment decreased the intensity of AQP2 labeling in LSDL (757 ± 17 pl/μm2) compared with LSD (P < 0.05) (Fig. 3D).
Fig. 3.
Immunoperoxidase microscopy of AQP2 in the inner medulla. AQP2 labeling is present at the apical and intracellular domains of the inner medullary collecting duct cells in LS (A), LSD (B), and LSDL rats (C). Strong apical immunoperoxidase labeling of AQP2 is observed in response to dDAVP treatment in the LSD group, whereas losartan cotreatment reduces the labeling of AQP2 in dDAVP-treated rats in the LSD group. Semiquantitative analysis of AQP2 immunoperoxidase labeling showed that the sum of total positive pixel intensity in LSD was significantly higher than that in LS, whereas losartan treatment decreased the intensity of AQP2 labeling in LSDL compared with LSD (D).
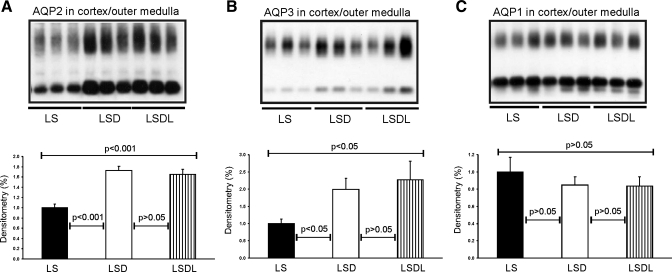
In contrast to the changes in AQP2 and p-AQP2 expression seen in the inner medulla between the LSD and LSDL groups, there were no changes in AQP2 and p-AQP2 expression in proteins prepared from the cortex/outer medulla combined. Semiquantitative immunoblotting of proteins prepared from the cortex and outer medulla (combined) revealed that AQP2 expression was similarly high in both the LSD (173 ± 9 vs. 100 ± 7% in LS, P < 0.001) and LSDL groups (165 ± 10 vs. 100 ± 7% in LS, P < 0.001) compared with the LS group, respectively (see Fig. 5A). Moreover, the expression of p-AQP2 in the cortex and outer medulla was also increased to the same extent in both the LSD (209 ± 12 vs. 100 ± 6% in controls, P < 0.001) and LSDL groups (199 ± 16 vs. 100 ± 6% in controls, P < 0.001) compared with the LS group, respectively.
Fig. 5.
Semiquantitative immunoblotting of proteins prepared from the cortex and outer medulla. Immunoblots are reacted with anti-AQP2 (A), anti-AQP3 (B) and anti-AQP1 (C) antibodies. Densitometric analysis reveals that the expression of cortical and outer medullary AQP2 and AQP3 is significantly increased in response to dDAVP treatment in the LSD and LSDL groups compared with control rats (LS), there is no significant difference in AQP2 and AQP3 expression between the LSD and LSDL groups. Densitometric analysis reveals unchanged expression of cortical and outer medullary AQP1 in response to either dDAVP treatment alone or cotreatment of dDAVP and losartan compared with LS.
Losartan cotreatment decreases expression of AQP3 in kidney inner medulla, but not in the cortex and outer medulla.
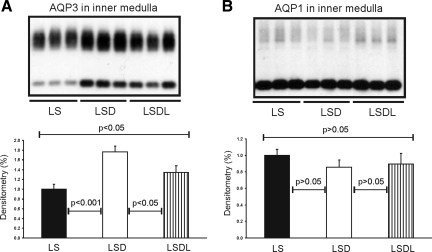
Semiquantitative immunoblotting of proteins prepared from the kidney inner medulla revealed that AQP3 expression was significantly increased in response to dDAVP treatment (177 ± 11 in LSD vs. 100 ± 10% in LS, P < 0.001; Fig. 4A), whereas AQP3 expression was decreased in response to both dDAVP and losartan treatment (134 ± 14 in LSDL vs. 177 ± 11% in LSD, P < 0.05; Fig. 4A) compared with dDAVP treatment alone. In the cortex/outer medulla, AQP3 expression was unchanged in both the LSD and LSDL groups (173 ± 25 in LSD vs. 195 ± 39% in LSDL, P > 0.05), although they were both significantly higher than the LS group (100 ± 10% in LS, P < 0.001, respectively) (Fig. 5A).
Fig. 4.
Semiquantitative immunoblotting of proteins prepared from the inner medulla. A: immunoblot is reacted with anti-AQP3 antibody. Densitometric analysis reveals that the expression of inner medullary AQP3 is significantly increased in response to dDAVP treatment in the LSD group compared with control rats (LS), whereas AQP3 expression is significantly reduced in response to cotreatment of dDAVP and losartan in the LSDL group compared with LSD rats. B: immunoblot is reacted with anti-AQP1 antibody. Densitometric analysis reveals that expression of inner medullary AQP1 is unchanged in response to either dDAVP treatment alone or cotreatment of dDAVP and losartan compared with LS.
Unchanged expression of AQP1 protein in kidney inner medulla and in the cortex and outer medulla.
In contrast to increased expression of AQP2 and AQP3, semiquantitative immunoblotting of proteins prepared from the kidney inner medulla revealed unchanged AQP1 expression in response to either dDAVP treatment alone (86 ± 8 in LSD vs. 100 ± 7% in LS, P > 0.05; Fig. 4B) or cotreatment of dDAVP and losartan (90 ± 13 in LSDL vs. 100 ± 7% in LS, P > 0.05; Fig. 4B) compared with LS. There was no difference in AQP1 expression between LSD and LSDL (P > 0.05). In the cortex/outer medulla, there was no significant difference in AQP1 expression among LS (100 ± 17%), LSD (85 ± 9%) and LSDL (84 ± 11%) groups (P > 0.05, respectively; Fig. 5C).
Losartan blocked increased AQP2 expression induced by dDAVP and ANG II cotreatment in mpkCCDc14 cells.
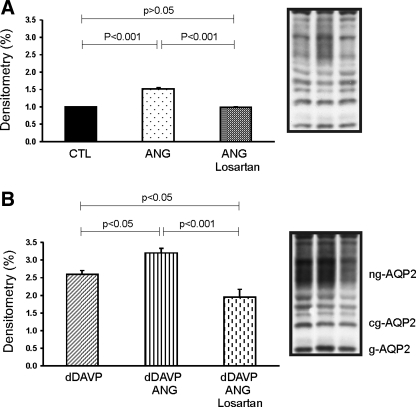
Treatment with 10−9 M ANG II or 10−10 M dDAVP significantly increased AQP2 expression to 152 ± 3 (P < 0.001, Fig. 6A) and 259 ± 11% (P < 0.001, Fig. 6B) of vehicle-treated control levels (100 ± 2%), respectively. Losartan (5 × 10⁻⁶ M) significantly reversed increased AQP2 expression induced by ANG II treatment (99 ± 1%, P < 0.001; Fig. 6A) compared with ANG II treatment alone. Cotreatment with dDAVP and ANG II significantly increased AQP2 expression to 309 ± 12% (Fig. 6B), which was higher than dDAVP (P < 0.05) treatment alone. The increased expression of AQP2 by cotreatment of dDAVP and ANG II was significantly attenuated by losartan from 309 ± 12 to 196 ± 22% (P < 0.001, Fig. 6B), but still significantly higher than control levels (P < 0.001), suggesting an additive effect of dDAVP and ANG II on AQP2 expression.
Fig. 6.
Semiquantitative immunoblotting of AQP2 in mpkCCDc14 cells. Cells grown on Transwell chambers with permeable support were incubated with serum-free medium with no growth factors for 24 h before use. Cells were incubated with ANG II (10−9 M), dDAVP (10−10 M) or cotreatment with both ANG II and dDAVP with (B) or without (A) AT1 receptor antagonist losartan (5 × 10⁻⁶ M) for 16 h. Cells were pretreated with losartan for 30 min. AQP2 protein bands were detected as nonglycosylated (ng-AQP2), core-glycosylated (cg-AQP2), and fully glycosylated (g-AQP2) forms. AQP2 expression in basal medium was assigned as 1-fold. Values means ± SE of 3 independent sets of experiments. ANG II, dAVP, or cotreatment of dDAVP and ANG II significantly increased AQP2 protein abundance compared with controls, and losartan significantly reversed increased AQP2 expression induced by either dDAVP, ANG II alone, or cotreatments.
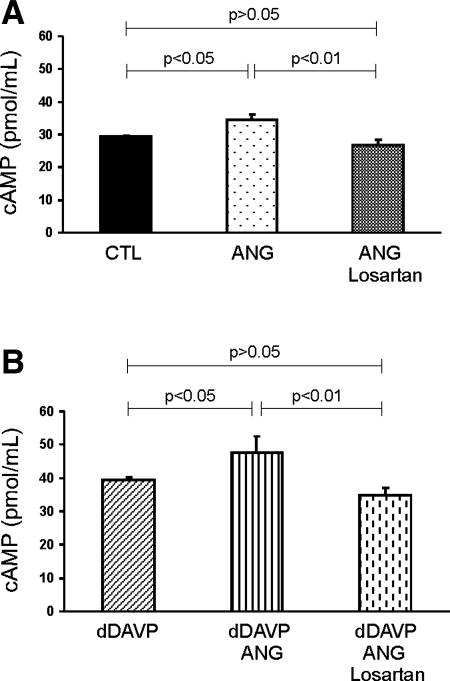
To examine whether the enhanced AQP2 expression in response to dDAVP or ANG II or dDAVP+ANG II was associated with an increase in cAMP production, we measured cAMP levels in mpkCCDc14 cells. cAMP levels were increased in response to ANG II treatment (Fig. 7A, P < 0.05), whereas dDAVP treatment alone significantly increased cAMP levels compared with control levels (P < 0.05, Fig. 7B). Importantly, the cAMP increase after dDAVP was potentiated by dDAVP+ANG II (Fig. 7B), suggesting an additive effect. The additive effect of dDAVP+ANG II on cAMP levels was attenuated by losartan (Fig. 7B). These results support the interaction between vasopressin and ANG II in AQP2 protein expression and the involvement of cAMP signaling.
Fig. 7.
cAMP levels in mpkCCDc14 cells. cAMP level was increased in response to dDAVP and was potentiated by cotreatment of dDAVP and ANG II. Losartan reversed increased cAMP induced by dDAVP and ANG II.
Unchanged expression of Na-K-ATPase and NKCC2 protein in the kidney.
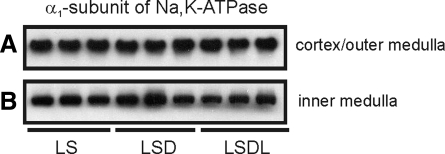
Semiquantitative immunoblotting of proteins prepared from the kidney cortex revealed unchanged expression of the α1-subunit of Na-K-ATPase in response to either dDAVP treatment alone (113 ± 6 in LSD vs. 100 ± 10% in LS, P > 0.05; Fig. 8A) or cotreatment with dDAVP and losartan (114 ± 10 in LSDL vs. 100 ± 10% in LS, P > 0.05; Fig. 8A) compared with LS. There was no difference of α1-subunit of Na-K-ATPase expression between the LSD and LSDL groups (P > 0.05, Fig. 8A). In the inner medulla, there also was no significant difference in α1-subunit Na-K-ATPase expression among the LS (100 ± 4%), LSD (101 ± 10%), and LSDL (88 ± 7%) groups (P > 0.05, respectively) (Fig. 8B). The expression of the γ-subunit of Na-K-ATPase was examined by immunoblotting, and no changes were found among groups in either the cortex (100 ± 9% in LS, 99 ± 12% in LSD, and 110 ± 13% in LSDL, P > 0.05, respectively) or inner medulla (100 ± 6% in LS, 120 ± 20% in LSD, and 113 ± 18% in LSDL, P > 0.05, respectively). There were no differences in protein abundance of NKCC2 in the cortex and outer medulla among groups (100 ± 11% in LS, 117 ± 15% in LSD and 99 ± 14% in LSDL, P > 0.05, respectively).
Fig. 8.
Semiquantitative immunoblotting of proteins prepared from the cortex/outer medulla (A) and the inner medulla (B). Immunoblots are reacted with anti-α1-subunit of Na-K-ATPase. Densitometric analysis reveals that there is no significant difference in α1-subunit of Na-K-ATPase expression in response to either dDAVP treatment alone (LSD) or cotreatment of dDAVP and losartan (LSDL) compared with LS.
DISCUSSION
An in vivo molecular interaction has been proposed between AVP and ANG II in the AQP2 water channels and urinary concentration (16). This is an important observation, because many common clinical circumstances are associated with increases in circulating AVP and ANG II as the nonosmotic AVP and renin-angiotensin-aldosterone systems are activated during arterial underfilling (22, 23). The previous in vivo studies proposing an interaction between AVP and ANG II were performed in severe NaCl-restricted rats with and without AT1 receptor blockade. The results demonstrated a significant increase in urine flow and decrease in urinary osmolality in animals receiving maximal doses of dDAVP (16). This vasopressin-resistant urinary concentrating defect was associated with a decrease in AQP1, AQP2, AQP3, type 3 Na+/H+ exchanger, Na-Cl cotransporter, and Na-K-ATPase (16). With the AT1 receptor blocker, however, there was an acute deterioration in renal function associated with a significant decrease in creatinine clearance from a mean of 1.35 to 0.75 ml/min accompanied by significant rises in serum creatinine (mean ∼0.28 to 0.51 mg/dl) and plasma urea (mean 5.3 to 40 mg/dl) (16).
These effects of acute deterioration of renal function are quite important in delineation of an in vivo molecular interaction between AVP and ANG II, since acute ischemic kidney injury in the rat has been shown to decrease AVP-regulated collecting duct AQP2 and AQP3 protein expression as well as AVP-independent AQP1 in the more proximal nephron (15). Moreover, acute ischemic renal failure (ARF) was associated with a downregulation of Na-K-ATPase in the thick ascending limb (9), a nephron site of action of both AVP (14, 26) and ANG II (2, 21).
To further study the potential of in vivo molecular interaction between AVP and ANG II, a less severe NaCl-restricted rat model was developed in which AT1 receptor blockade was not associated with ARF. Compatible with increased endogenous ANG II, administration of the AT1 receptor antagonist in this NaCl-restricted model increased fractional excretion of sodium. Of importance, there was no significant change in renal blood flow, serum creatinine, or creatinine clearance (see Table 1). Thus this rat model allowed the in vivo examination of the interaction AVP and ANG II in the absence of ARF but in the presence of maximal exogenous AVP. Inhibition of the angiotensin AT1 receptor demonstrated a significant increase in urine flow and decrease in urine osmolality. This AVP-resistant effect thus indicated a role of ANG II in maximal urinary concentration and was associated with a decrease in both AQP2 and AQP3 protein expression and AQP2 trafficking to the apical membrane of the collecting duct principal cells. This effect on AQP2 trafficking is compatible with the observed downregulation of p-AQP2. The effect of AT1 inhibition on AQP2 and AQP3 protein expressions was only demonstrable in the inner medulla not in the cortex or outer medulla. This finding may suggest that the degree of hypertonicity may be involved in the interaction of AVP and ANG II in both AQP2 and AQP3 expression.
There was further evidence for separation of results between AVP-ANG II interaction and ARF in the present study. In contrast to the more severe NaCl-restricted model (16), downregulation of AQP1 and Na-K-ATPase was not observed in the current model, which had no renal impairment. These findings support the importance of ARF in downregulating water channels and ion transporters, as previously reported (6, 9, 10, 15). However, in concert with the earlier conclusion (16), the results of the present in vivo study support the molecular interaction between AVP and ANG II in AQP2, pAQP2, and AQP3 protein expression, as well as AQP2 trafficking in the inner medulla. The combination of this interaction between AVP and ANG II with ARF in the earlier study (16) obviously affords a more severe AVP-resistant urinary concentration defect during AT1 blockade.
To further study the molecular interaction between AVP and ANG II, in vitro studies were examined in the immortalized mouse cortical collecting duct cell line mpkCCDc14. These cells have the major functional properties of collecting duct cells, including expression of AQP2 water channels. These in vitro results clearly demonstrate the effect of ANG II to upregulate AQP2 expression in the absence of AVP. AVP alone upregulated AQP2 to a greater extent than ANG II; however, the combination of AVP and ANG II demonstrated the most profound increase in AQP2. These effects were paralleled by changes in cAMP and were reversible with the specific AT1 receptor antagonists.
Thus the present in vivo and in vitro results support the interaction between AVP and ANG II in inner medullary water channels as determinants of urinary concentration. These findings have important clinical relevance since in all states of arterial underfilling, e.g., cardiac failure, cirrhosis, and pregnancy, circulating AVP and ANG II are increased.
GRANTS
This work was supported by National Institute of Diabetes and Digestive and Kidney Diseases Grant DK-19928.
DISCLOSURES
No conflicts of interest, financial or otherwise, are declared by the authors.
ACKNOWLEDGMENTS
The authors are grateful to Dr. Miguel Lanaspa Garcia, Christopher Altmann, and Carlos Roncal (Renal Division, School of Medicine, University of Colorado Denver) for technical assistance.
REFERENCES
- 1.Bens M, Vallet V, Cluzeaud F, Pascual-Letallec L, Kahn A, Rafestin-Oblin ME, Rossier BC, Vandewalle A. Corticosteroid-dependent sodium transport in a novel immortalized mouse collecting duct principal cell line. J Am Soc Nephrol 10: 923–934, 1999 [DOI] [PubMed] [Google Scholar]
- 2.Bouby N, Hus-Citharel A, Marchetti J, Bankir L, Corvol P, Llorens-Cortes C. Expression of type 1 angiotensin II receptor subtypes and angiotensin II-induced calcium mobilization along the rat nephron. J Am Soc Nephrol 8: 1658–1667, 1997 [DOI] [PubMed] [Google Scholar]
- 3.Christensen BM, Zelenina M, Aperia A, Nielsen S. Localization and regulation of PKA-phosphorylated AQP2 in response to V2-receptor agonist/antagonist treatment. Am J Physiol Renal Physiol 278: F29–F42, 2000 [DOI] [PubMed] [Google Scholar]
- 4.Ecelbarger CA, Terris J, Frindt G, Echevarria M, Marples D, Nielsen S, Knepper MA. Aquaporin-3 water channel localization and regulation in rat kidney. Am J Physiol Renal Fluid Electrolyte Physiol 269: F663–F672, 1995 [DOI] [PubMed] [Google Scholar]
- 5.Ecelbarger CA, Terris J, Hoyer JR, Nielsen S, Wade JB, Knepper MA. Localization and regulation of the rat renal Na+-K+-2Cl− cotransporter, BSC-1. Am J Physiol Renal Fluid Electrolyte Physiol 271: F619–F628, 1996 [DOI] [PubMed] [Google Scholar]
- 6.Fernandez-Llama P, Andrews P, Turner R, Saggi S, Dimari J, Kwon TH, Nielsen S, Safirstein R, Knepper MA. Decreased abundance of collecting duct aquaporins in post-ischemic renal failure in rats. J Am Soc Nephrol 10: 1658–1668, 1999 [DOI] [PubMed] [Google Scholar]
- 7.Frøkiær J, Marples D, Valtin H, Morris JF, Knepper MA, Nielsen S. Low aquaporin-2 levels in polyuric DI +/+ severe mice with constitutively high cAMP-phosphodiesterase activity. Am J Physiol Renal Physiol 276: F179–F190, 1999 [DOI] [PubMed] [Google Scholar]
- 8.Fushimi K, Sasaki S, Marumo F. Phosphorylation of serine 256 is required for cAMP-dependent regulatory exocytosis of the aquaporin-2 water channel. J Biol Chem 272: 14800–14804, 1997 [DOI] [PubMed] [Google Scholar]
- 9.Gong H, Wang W, Kwon TH, Jonassen T, Li C, Ring T, Frokiaer J, Nielsen S. EPO and alpha-MSH prevent ischemia/reperfusion-induced down-regulation of AQPs and sodium transporters in rat kidney. Kidney Int 66: 683–695, 2004 [DOI] [PubMed] [Google Scholar]
- 10.Grinevich V, Knepper MA, Verbalis J, Reyes I, Aguilera G. Acute endotoxemia in rats induces down-regulation of V2 vasopressin receptors and aquaporin-2 content in the kidney medulla. Kidney Int 65: 54–62, 2004 [DOI] [PubMed] [Google Scholar]
- 11.Hasler U, Mordasini D, Bens M, Bianchi M, Cluzeaud F, Rousselot M, Vandewalle A, Feraille E, Martin PY. Long term regulation of aquaporin-2 expression in vasopressin-responsive renal collecting duct principal cells. J Biol Chem 277: 10379–10386, 2002 [DOI] [PubMed] [Google Scholar]
- 12.Homma S, Gapstur SM, Coffey A, Valtin H, Dousa TP. Role of cAMP-phosphodiesterase isozymes in pathogenesis of murine nephrogenic diabetes insipidus. Am J Physiol Renal Fluid Electrolyte Physiol 261: F345–F353, 1991 [DOI] [PubMed] [Google Scholar]
- 13.Klingler C, Ancellin N, Barrault MB, Morel A, Buhler JM, Elalouf JM, Clauser E, Lugnier C, Corman B. Angiotensin II potentiates vasopressin-dependent cAMP accumulation in CHO transfected cells. Mechanisms of cross-talk between AT1A and V2 receptors. Cell Signal 10: 65–74, 1998 [DOI] [PubMed] [Google Scholar]
- 14.Knepper MA, Kim GH, Fernandez-Llama P, Ecelbarger CA. Regulation of thick ascending limb transport by vasopressin. J Am Soc Nephrol 10: 628–634, 1999 [DOI] [PubMed] [Google Scholar]
- 15.Kwon TH, Frøkiær J, Fernandez-Llama P, Knepper MA, Nielsen S. Reduced abundance of aquaporins in rats with bilateral ischemia-induced acute renal failure: prevention by α-MSH. Am J Physiol Renal Physiol 277: F413–F427, 1999 [DOI] [PubMed] [Google Scholar]
- 16.Kwon TH, Nielsen J, Knepper MA, Frøkiær J, Nielsen S. Angiotensin II AT1 receptor blockade decreases vasopressin-induced water reabsorption and AQP2 levels in NaCl-restricted rats. Am J Physiol Renal Physiol 288: F673–F684, 2005 [DOI] [PubMed] [Google Scholar]
- 17.Lee YJ, Song IK, Jang KJ, Nielsen J, Frøkiær J, Nielsen S, Kwon TH. Increased AQP2 targeting in primary cultured IMCD cells in response to angiotensin II through AT1 receptor. Am J Physiol Renal Physiol 292: F340–F350, 2007 [DOI] [PubMed] [Google Scholar]
- 18.Matsumura Y, Uchida S, Rai T, Sasaki S, Marumo F. Transcriptional regulation of aquaporin-2 water channel gene by cAMP. J Am Soc Nephrol 8: 861–867, 1997 [DOI] [PubMed] [Google Scholar]
- 19.Nielsen S, Chou CL, Marples D, Christensen EI, Kishore BK, Knepper MA. Vasopressin increases water permeability of kidney collecting duct by inducing translocation of aquaporin-CD water channels to plasma membrane. Proc Natl Acad Sci USA 92: 1013–1017, 1995 [DOI] [PMC free article] [PubMed] [Google Scholar]
- 20.Nielsen S, Frokiaer J, Marples D, Kwon TH, Agre P, Knepper MA. Aquaporins in the kidney: from molecules to medicine. Physiol Rev 82: 205–244, 2002 [DOI] [PubMed] [Google Scholar]
- 21.Paxton WG, Runge M, Horaist C, Cohen C, Alexander RW, Bernstein KE. Immunohistochemical localization of rat angiotensin II AT1 receptor. Am J Physiol Renal Fluid Electrolyte Physiol 264: F989–F995, 1993 [DOI] [PubMed] [Google Scholar]
- 22.Schrier RW. Body water homeostasis: clinical disorders of urinary dilution and concentration. J Am Soc Nephrol 17: 1820–1832, 2006 [DOI] [PubMed] [Google Scholar]
- 23.Schrier RW. Interactions between angiotensin II and arginine vasopressin in water homeostasis. Kidney Int 76: 137–139, 2009 [DOI] [PMC free article] [PubMed] [Google Scholar]
- 24.Schrier RW, Abraham WT. Hormones and hemodynamics in heart failure. N Engl J Med 341: 577–585, 1999 [DOI] [PubMed] [Google Scholar]
- 25.Schrier RW, Gross P, Gheorghiade M, Berl T, Verbalis JG, Czerwiec FS, Orlandi C. Tolvaptan, a selective oral vasopressin V2-receptor antagonist, for hyponatremia. N Engl J Med 355: 2099–2112, 2006 [DOI] [PubMed] [Google Scholar]
- 26.Torikai S, Imai M. Effects of solute concentration on vasopressin stimulated cyclic AMP generation in the rat medullary thick ascending limbs of Henle's loop. Pflügers Arch 400: 306–308, 1984 [DOI] [PubMed] [Google Scholar]
- 27.Torp M, Brond L, Hadrup N, Nielsen JB, Praetorius J, Nielsen S, Christensen S, Jonassen TE. Losartan decreases vasopressin-mediated cAMP accumulation in the thick ascending limb of the loop of Henle in rats with congestive heart failure. Acta Physiol (Oxf) 190: 339–350, 2007 [DOI] [PubMed] [Google Scholar]
- 28.Turban S, Beutler KT, Morris RG, Masilamani S, Fenton RA, Knepper MA, Packer RK. Long-term regulation of proximal tubule acid-base transporter abundance by angiotensin II. Kidney Int 70: 660–668, 2006 [DOI] [PubMed] [Google Scholar]
- 29.Wang W, Li C, Summer SN, Falk S, Cadnapaphornchai MA, Chen YC, Schrier RW. Molecular analysis of impaired urinary diluting capacity in glucocorticoid deficiency. Am J Physiol Renal Physiol 290: F1135–F1142, 2006 [DOI] [PubMed] [Google Scholar]
- 30.Wong NL, Tsui JK. Angiotensin II upregulates the expression of vasopressin V2 mRNA in the inner medullary collecting duct of the rat. Metabolism 52: 290–295, 2003 [DOI] [PubMed] [Google Scholar]


