Abstract
OVE26 (OVE) diabetic mice on the inbred strain FVB are a valuable model of diabetic nephropathy that excretes the highest amount of urine albumin of all diabetic mouse models. Crossing of OVE mice to C57BL6 or DBA2 mice reduced albuminuria 17-fold in F1 diabetic offspring without reducing diabetes. When comparing renal histology of OVE mice on the FVB background to F1 C57BL6 crosses, we found that the F1 kidneys had significantly smaller glomeruli, much less albumin accumulation in tubules, reduced mesangial matrix expansion, and less interstitial fibrosis. A genome scan of 108 OVE-positive N2 offspring for albuminuria revealed one significant peak on chromosome 11 and nearly significant peaks on chromosomes 9, 13, and 19. Homozygosity for the FVB genotype for peaks on chromosomes 11, 13, or 19 increased albuminuria. Homozygosity for the chromosome 9 peak reduced albuminuria. Combined homozyogosity for the peaks on chromosomes 11, 13, and 19 increased albuminuria over 12-fold and accounted for >70% of the difference between OVE mice on the FVB vs. the F1 background. These loci contain sequences important to susceptibility to diabetic albuminuria.
Keywords: diabetic nephropathy, genetic background, urine albumin excretion
diabetic nephropathy (DN) is the most common cause of end-stage renal disease (11) and is associated with significantly increased mortality. In patients with type 1 diabetes, ∼30% will manifest DN (13). A major characteristic of DN is albuminuria, and this feature is a predictor for progression toward renal failure. Reducing urine albumin is an important therapeutic goal for preventing decline in renal function (21).
Studies of familial aggregation, racial and ethnic comparisons, and linkage analysis have indicated a significant genetic component to DN (3, 8), and currently there are major human genome-wide studies underway to identify genetic loci in diabetic populations that confer susceptibility to DN (14). However, the identification of specific genes underlying DN in humans has proven difficult, expensive, and time consuming. This is due in part to the heterogeneity of the genome of human populations as well as uncontrolled environmental factors. Inbred strains of rodents are not encumbered by the difficulties of genetic heterogeneity or environmental variation. Since quantitative trait loci for many complex traits are concordant among mice, rats, and humans, genome scans in animal models are relevant to human diseases (17, 18) and can provide more rapid results.
The OVE26 (OVE) mouse carries a transgene overexpressing calmodulin in pancreatic β cells, resulting in early onset of type I diabetes (6). At present, it is the diabetic mouse line which manifests by far the most profound albuminuria (20, 25). These mice have been maintained on an inbred FVB background. The purpose of the current study was to determine whether the FVB background was important to susceptibility to severe albuminuria in OVE mice. Our results showed that genetic background plays a surprisingly essential role. When OVE mice were bred with C57BL6 (C57) or DBA2 mice, profound albuminuria almost disappeared, although equivalent elevated blood glucose levels were still observed. Morphological studies indicated that offspring from OVE by C57 crosses had milder renal morphological changes coincident with reduced albuminuria. After crossing and backcrossing OVE and C57 mice, a genomic scan was conducted to identify possible genetic loci associated with diabetic albuminuria; one significant locus and three suggestive loci were found.
MATERIALS AND METHODS
Animals.
Normal C57 and FVB mice were obtained from the National Cancer Institute (Frederick, MD). The type I diabetes mouse model OVE, which overexpresses calmodulin in pancreatic β cells (6), is bred in our laboratory on an FVB background. OVE mice on the background FVB are referred to as OVE. Two mating models were used to breed OVE-N2 (F2) progeny. One involved mating an OVE male with a C57 female to produce a positive male (OVE/C57F1), which was then backcrossed with an FVB female for OVE-N2 (F2) offspring; the other involved a cross between an FVB male and C57 female, with a resulting positive female (OVE/C57F1) backcrossed with a male OVE for OVE-N2 (F2) offspring. Diabetic females were not used for breeding since they have low fertility and they are poor mothers. All mice were maintained in a 12:12-h light-dark cycle with free access to water and food. All animal protocols were approved by the Animal Care and Use Committee at the University of Louisville.
Mouse streptozotocin diabetes models.
Two-month-old male mice were administrated a single intraperitoneal dose of 200 mg/kg streptozotocin (STZ; Sigma-Aldrich) dissolved in 10 mM citric acid (pH = 4.5); 1 wk later, blood glucose was determined using a One Touch Glucose Meter (Johnson&Johnson). Mouse urine was collected at week 5 after STZ administration, and urine albumin was determined by ELISA, as stated below. For multiple low-dose (mld) STZ diabetes, 2-mo-old male mice were administrated intraperitoneal injections of 50 mg/kg STZ in 10 mM citric acid (pH = 4.5) every day for 5 consecutive days.
Urine albumin.
Twenty-four-hour urine samples were collected from OVE/C57F1 and OVE-N2 mice at the age of 4.5 mo or from STZ-treated mice in individual metabolic cages (Nalgene, Braintree Scientific, Braintree, MA). To obtain sufficient urine volume, particularly from nondiabetic mice, a 10% liquid diet (Glucerna; Abbott Laboratories) was added to the feeding water, as previously described (25). Urine samples were centrifuged at 4,000 rpm for 10 min at 4°C and stored at −80°C. Urine albumin was determined using a Mouse Albumin ELISA Quantitation Kit (Bethyl Laboratories, Montgomery, TX) within the linear range of the assay as described by Zheng et al. (25). Some reports provide data as albumin excreted/24 h in diabetic and control animals, and other papers report the albumin/creatinine ratio. Because diabetes increases creatinine excretion in FVB mice, unlike other diabetic models (16), we used 24-h albumin excretion not normalized to creatinine for most assays in the FVB strain OVE mice. For those assays normalized to creatinine, a QuantiChrom Creatinine Assay kit from Bioassay Systems (Hayward, CA) was used.
Immunohistochemistry.
Kidney samples from FVB, OVE/C57F1, and OVE-N2 mice were cut in half sagittaly and fixed for 18 h in 10% neutral buffered formalin solution (Surgipath Industry, Richmond, IL) and then transferred to 70% ethanol before being embedded in paraffin. The tissues were sectioned at 5 μm, and slides were prepared. Following deparaffinization and hydration, the sections were subjected to antigen retrieval using Dako target retrieval solution in a decloaking chamber (Biocare Medical). After blocking with normal serum, the sections were incubated with rabbit anti-mouse albumin antibody (1:500, Bethyl Laboratories) followed by Cy3-conjugated anti-rabbit antibody (1:100, Jackson Laboratories) for albumin detection (12).
Renal histology.
Periodic acid-Schiff (PAS) staining for determination of mesangial matrix expansion was carried out as described by Zheng et al. (25). Images of 15 glomeruli/mouse, three mice/group were obtained from a single ×100 field, chosen if it contained at least 15 glomeruli. Images from this field were taken at ×400 magnification using a Nikon DS-Fi1 camera system connected to a Nikon E600 microscope. These images were then compared with a set of standard images in which no expansion was scored as 1, scores from 2 to 4 were based on standards with progressive expansion of PAS-stained matrix, and a score of 5 indicated the presence of Kimmelsteil-Wilson nodules. The same randomly ordered images were then blindly scored from 1 to 5 for the severity of matrix expansion, based on standard images. Mouse glomerular volume was calculated from at least 50 PAS-stained glomerular profiles from 3 mice/group as performed by Zheng et al. (25). Glomerular volume (VG) was calculated from the cross-sectional area with the formula VG = β/k (AG)3/2, where β = 1.38 is the shape coefficient for a sphere, and k = 1.1 is the size distribution coefficient.
Sirius red staining for kidney fibrosis was carried out as described by Grimm et al. (10). A semiquantitative scoring method was used to compare fibrosis between the groups. Random low-power (×100 final magnification) images of the Sirius red-stained sections were scored against standard images by a blind observer. The standard images covered the range of fibrosis staining observed in the samples and were scored 1, for minimal staining, to 3, for maximal staining.
Serum glucose measurement.
Mouse blood samples were obtained from a tail tip cut using microhematocrit capillary tubes then centrifuged at 5,500 rpm × 10 min. Serum blood glucose was measured with an enzymatic glucose assay kit (Sigma-Aldrich) according to the manufacturer's instructions.
Genotyping.
Genomic DNA samples were obtained from mouse tails and isolated by a DNeasy Tissue Kit (Qiagen, Valencia, CA) with DNA purity confirmed by A260/280 ratio of 1.8–1.9. Mouse whole genome single nucleotide polymorphism (SNP) scans were performed using a high-resolution mouse 768 SNP panel at the Genetics Division and Harvard Partners Center for Genetics and Genomics at Harvard Medical School (Cambridge, MA) (7). This SNP panel was designed to optimize polymorphisms within C57 mice, and a total of 498 SNPs were informative between FVB and C57 inbred strains. The SNP marker density had an average distance of 3 cM between markers.
Quantitative trait locus assay.
A mouse quantitative trait locus (QTL) assay was carried out by J/qtl software developed by Jackson Laboratory (Bar Harbor, ME). Albumin in 24-h urine samples was expressed in log10 of micrograms albumin excreted/24 h. Gender was set as an interactive factor since we have found diabetic female mice were more prone to albuminuria than male mice. A nonparametric test was used since data were not normally distributed as assessed by the Shapiro-Wilk normality test. The effective QTL linked with urine albumin were identified and expressed as the logarithm of the odds ratio (LOD) score. In this computation, the permutation number was set to 1,000, and P = 0.05 was set as the significant threshold for LOD (4).
Statistical analysis.
All data are presented as means ± SE, with P < 0.05 indicating significant difference. Comparisons of urine albumin secretion and histology were analyzed by ANOVA or Student's t-test depending on the number of groups.
RESULTS
Urine albumin excretion in different diabetic mice.
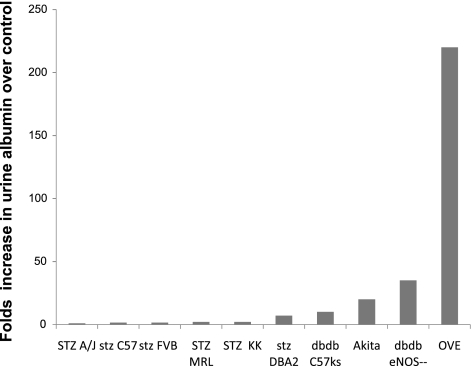
As shown in Fig. 1, there is a large variation in published albuminuria for different diabetic models (15, 16, 19, 23, 25). Most of the diabetic models increased albuminuria <10-fold, and none of them reached over 50-fold except for the OVE model, which increased >200-fold compared with nondiabetic mice when expressed as 24-h urine albumin excretion. To evaluate OVE albuminuria when normalized to creatinine excretion, additional cohorts of OVE, normal FVB and C57 mice were tested (Supplementary Fig. S1). The fold-increase in albuminuria for OVE mice dropped to 98-fold when normalized to creatinine. The reduction was due to the greater creatinine output of OVE mice compared with normal FVB or C57 mice.
Fig. 1.
Albuminuria in different diabetic mouse models. Fold-increase in 24-h urine albumin or albumin-to-creatinine ratio induced by diabetes in different models compared with their nondiabetic counterparts is shown. OVE diabetes produced the greatest increase in albuminuria. eNOS, endothelial nitric oxide synthase.
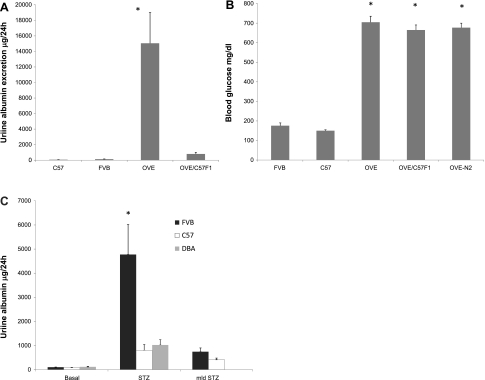
To examine a more commonly used background than FVB, we initiated crossing of OVE diabetic mice to C57 mice. In the F1 generation, designated OVE/C57F1, we found a dramatic drop in albuminuria, from >15,000 μg/24 h in OVE mice to <900 μg/24 h (Fig. 2A, P < 0.001). Similarly, breeding of OVE to the DBA2 strain reduced albuminuria to 471 ± 213 μg/day in the diabetic offspring (n = 6). The reduction in albuminuria does not appear to be a function of lesser diabetes, since there was no significant difference in serum glucose among OVE, OVE/C57F1, and OVE-N2 mice (Fig. 2B). To assess whether FVB mice had higher albuminuria than C57 mice for models of diabetes other than OVE, we produced diabetes with a single dose of 200 mg/kg STZ in male FVB, C57, and DBA2 mice. All tested STZ-treated mice had blood glucose values >600 mg/dl. Urine albumin measured after 5 wk showed that STZ diabetes produced four-fold higher albuminuria in FVB mice than in C57 or DBA2 mice (Fig. 2C, P < 0.05). Albuminuria after diabetes induced by mld treatment with STZ was not significantly higher in FVB mice than in C57 mice; however, there was a trend toward higher albuminuria in mld STZ-treated FVB mice (P = 0.1). In our hands, DBA2 mice did not survive mld STZ treatment. For the purpose of direct comparison, 24-h albuminuria values of OVE mice on the FVB background, STZ-treated and normal FVB mice, and STZ-treated and normal C57 mice are combined on a single graph in Supplementary Fig. S2.
Fig. 2.
Urine albumin on different genetic backgrounds. A: when OVE mice were bred to C57 mice to produce OVE/C57F1 mice, albuminuria dropped 17-fold compared with the FVB inbred OVE parents (OVE mice were greater than all other groups; *P < 0.01; n = 12–35/group, age 4–5 mo). B: however, serum glucose of OVE mice was not affected by crossing to C57 (nonfasting serum samples; n = 10–24, *P < 0.001 vs. nondiabetic FVB and C57 mice). C: albuminuria of FVB, C57, and DBA2 mice following diabetes induced by a single high dose of streptozotocin (STZ) or multiple low doses (mld) of STZ (*P < 0.05 between FVB STZ the 2 other STZ groups; n = 5 for all groups except that no DBA2 mice survived mld STZ treatment).
Albumin staining.
We recently reported that in OVE mice on the FVB background, albumin accumulated in the lumen and epithelial cells of many tubules (12). This was assessed in the current study for normal FVB, OVE/C57F1, and OVE kidneys. In normal FVB and diabetic OVE/C57F1 kidney sections, albumin staining was hardly detected (Fig. 3, A and B). In contrast, OVE kidney sections showed many brightly stained albumin-positive tubules (Fig. 3C), consistent with our previous results (12).
Fig. 3.
Representative albumin staining (red) of kidney sections from FVB (A), OVE/C57F1 (B), and OVE diabetic mice (C). In FVB and OVE/C57F1 groups, there was minimal albumin staining; however, in OVE diabetic mice a large amount of albumin accumulated in many tubules (×20).
Glomerular matrix and glomerular volume expansion.
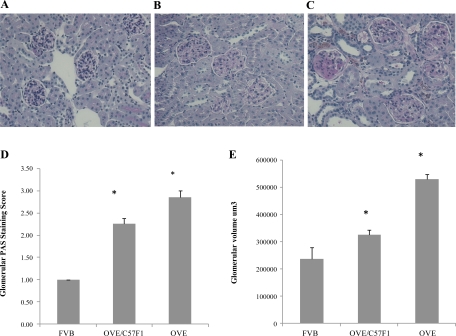
PAS staining (Fig. 4) was used to perform semiquantitative scoring of mesangial matrix, as described in methods. Compared with normal FVB mice, both diabetic groups showed expansion of glomerular matrix (Fig. 4, B and C). In addition, many diabetic glomeruli had acellular PAS-stained areas, and occasional diabetic glomeruli contained Kimmelstiel-Wilson nodules (Fig. 4C). However, as evident in the scoring (Fig. 4D), PAS staining revealed more mesangial matrix in OVE glomeruli than in OVE/C57F1 glomeruli (P < 0.01). Total glomerular volume displayed a similar trend (Fig. 4E). Both diabetic groups had larger glomeruli than normal FVB (P < 0.05), but OVE glomeruli were 63% larger than OVE/C57F1 glomeruli (P < 0.05).
Fig. 4.
Breeding OVE to C57BL6 reduces mesangial matrix expansion and glomerular volume. Representative periodic acid-Schiff (PAS) staining of FVB (A), OVE/C57F1 (B), and OVE (C) kidneys is shown. D: PAS staining scored by a blind observer, as described in materials and methods. There were significant differences among all groups (*P < 0.001). E: average glomerular volumes calculated as described in materials and methods. Scores and volumes were obtained from at least 45 randomly selected glomeruli obtained from 3 mice/group. All groups were significantly different (*P < 0.05).
Fibrosis.
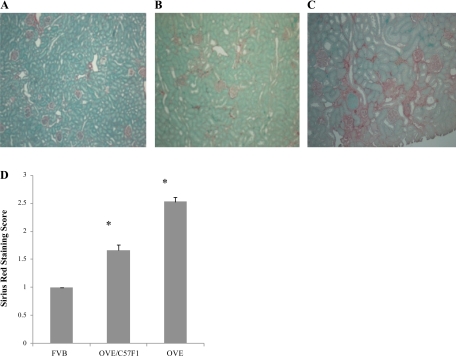
Sirius red staining was used to show renal interstitial fibrosis (Fig. 5). OVE kidney sections contained obvious areas of Sirius red staining around glomeruli and tubules (Fig. 5C). The staining was weaker in OVE/C57F1 mice and was rarely found in normal FVB sections (Fig. 5, A and B). As seen for glomerular pathology, both diabetic groups had more fibrosis than normal FVB sections. Fibrosis scores in OVE sections was significantly worse than scores for OVE/C57F1 sections (P < 0.01).
Fig. 5.
Breeding OVE to C57BL6 reduces renal interstitial fibrosis. Representative Sirius red staining of FVB (A), OVE/C57F1 (B), and OVE (C) kidney sections is shown. Random images were taken and scored blindly against 3 standard images showing different levels of fibrosis. Normal sections with minimal staining were scored as 1, and the strongest staining was scored as 3. Forty-five images were scored/group, obtained from 3 mice/group. All groups were significantly different from one another (45 images/group were scored obtained from 3 mice/group, *P < 0.001).
SNP whole genome scan and assay.
To determine whether there were identifiable genomic loci responsible for the strain effects on albuminuria, DNA from 108 OVE-N2 offspring with accurate urine albumin data at 4.5 mo of age were scanned on a 768 SNP whole genome panel. Among the 108 backcross progeny, 57 were male and 51 were female. Urine albumin results were converted to log10. Male and female data were combined, and sex was set as an interactive factor in J/qtl software. Female data were normally distributed, but total male and total data were not; therefore, the analysis was done in nonparametric mode.
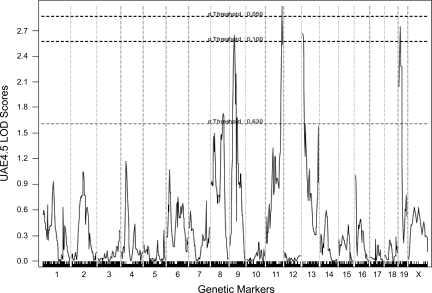
The assay result showed four peaks with LOD scores >2.6 (Fig. 6). The significant locus was centered at 76 cM on chromosome 11 [LOD = 2.98, P = 0.033 and 95% confidence interval (CI) from 63.35 to 83 cM]. Major but not quite significant loci were centered on chromosome 19 at 8.98 cM (LOD = 2.749, P = 0.056, 95% CI from 0 to 36 cM), chromosome 13 at 0.37 cM (LOD = 2.669 P = 0.073, 95% CI 0–8.5 cM), and chromosome 9 centered at 24.28 cM (LOD = 2.64, P = 0.074, 95% CI from 15 to 35 cM).
Fig. 6.
Logarithm of the odds ratio (LOD) scores of whole genome single nucelotide polymorphism (SNP) scans of log10 24-h urine albumin excretion from 108 OVE-N2 offspring at 4.5 mo of age. Data were analyzed by J-qtl software with the nonparametric, maximum likelihood method and sex set as an interactive factor. The dashed lines show significance levels. The peak on chromosome 11 has the highest LOD score (LOD = 2.982, P = 0.044). Peaks on chromosomes 19, 13, and 9 had LOD scores of 2.749, 2.669, and 2.644, respectively, with P < 0.1.
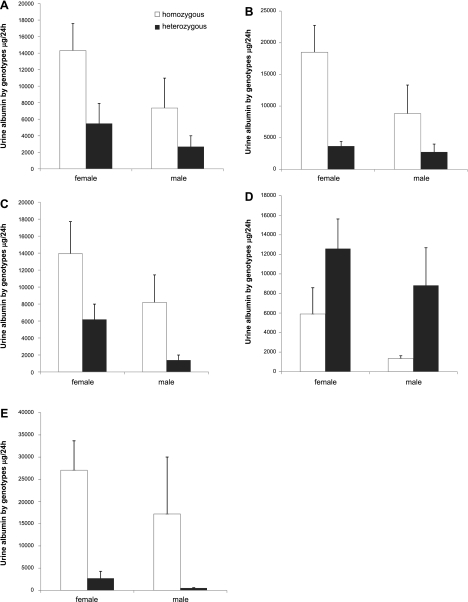
Figure 7 shows the impact on albuminuria of homozygosity vs. heterozygosity for each of these loci. Homozygosity for the three loci on chromosomes 11, 13, and 19 had a positive effect on albumin excretion. This effect was greatest for chromosome 19: albuminuria was increased sevenfold for homozygous females and fourfold for homozygous males. Surprisingly, FVB homozyogosity for the peak on chromosome 9 markedly reduced albuminuria. We also looked at the combined effect of the three positive peaks for albuminuria. As shown in Fig. 7E, combined homozyogosity greatly enhanced the response observed for individual peaks: homozygous females were increased 10-fold and homozygous males were increased 30-fold, vs. heterozygous mice. For all individual loci and the combined loci, the effect of genotype on albuminuria was signficiant (P < 0.02 by 2-way ANOVA).
Fig. 7.
Effect of zygosity on urine albumin excretion for the 4 LOD peaks on chromosomes 11 (A), 19 (B), 13 (C), and 9 (D). Homozygosity on all peaks except the peak on chromosome 9 increased urine albumin. E: combined effect of homozygosity or heterozygosity for the loci on chromosomes 11, 19, and 13. Results are from 108 OVE-N2 mice (A–D) and 33 mice (E). For all panels, albumin was significantly affected by genotype (P ≤ 0.02 by 2-way ANOVA with sex and zygosity as factors).
DISCUSSION
A limitation of experimental DN studies has been the lack of a mouse model with features of advanced human DN, including severe albuminuria. Compared with other models, OVE mice display much more profound albuminuria. We presumed that their extreme albuminuria was due to their severe, chronic hyperglycemia. However, in this study we found that a single cross of OVE mice to two other genetic backgrounds, DBA2 or C57BL6, reduced albuminuria 17-fold without significantly changing blood glucose. This demonstrates that factors other than the severity of hyperglycemia caused OVE albuminuria and that these factors were related to the background strain. Since crosses to two different strains decreased albuminuria it is likely that the severe albuminuria was due to susceptibility of the FVB strain to OVE diabetes, rather than unusual resistance of other strains.
We tested whether the susceptibility of FVB mice vs. C57BL6 mice applied to another model of diabetes, single high-dose STZ-induced diabetes. Here also, FVB diabetic mice had higher albuminuria, by more than fourfold, than C57BL6 or DBA2 mice. Breyer's group (16) obtained similar results by mld STZ induction of diabetes: Their diabetic FVB mice had about five times higher 24-h albumin excretion than diabetic C57BL6 mice, and it was the highest of all strains tested. In the current study, following mld STZ induction of diabetes, FVB mice had higher albuminuria than C57 mice, but the difference did not reach significance. Considering STZ and OVE diabetes, it appears that FVB mice are one of the more sensitive strains for diabetes-induced albuminuria.
Histopathology of FVB OVE mice was worse than OVE/C57F1 mice with respect to interstitial fibrosis, mesangial matrix expansion, and glomerular size. While all of these differences were statistically significant, the magnitude of the strain effect on histology was small compared with its effect on albuminuria. Again, the difference cannot be due the level of hyperglycemia. We suspect that the more severe pathology was secondary to the much greater albuminuria of FVB OVE mice. The effect of background strain on renal histopathology has previously been studied (16). Qi et al. (16) reported that mld STZ induced mesangial matrix expansion in FVB mice that was less than that of similarly treated DBA2 or C57BL6 mice. Glomerular basement membrane thickening in STZ-treated FVB mice was intermediate between DBA2 and C57BL6. Many prior studies (1), including our own on OVE mice (24), have indicated that increasing albuminuria aggravates histological pathology. We previously reported heterogeneous accumulation of albumin in FVB OVE proximal tubule cells (12), which we found in the current study did not to occur in OVE/C57F1 tubules. The absence of albumin accumulation in low-albuminuria OVE/C57F1 mice supports our prior conclusion that albumin builds up in tubules only if albuminuria is very severe.
A genome scan of DNA from 108 OVE-N2 offspring revealed 4 loci with LOD scores that were significant or nearly so. Our n value of 108 is relatively small, which may account for the failure of 3 large peaks to obtain significance at the 0.05 level. The peak with the greatest LOD score was at the 76 cM position of chromosome 11. We could find no reports of mouse loci near this position that contribute to renal pathology, nor could we find concordant loci for human or rat pathology. Thus this appears to be a newly identified locus for renal damage. A portion of the peak on chromosome 13 is orthologous to human region 7p13–15, which contains a locus previously associated with albuminuria (14). The chromosome 19 peak has a 95% CI from 0 to 36 cM, which overlaps the chromosome 19 QTL peak at 24 cM, previously linked with mouse albuminuria (5). The 95% CI of our mouse chromosome 19 peak corresponds to human genomic regions 9q21–q24, 10q11–q26, and 11q12–q13. There are several reports of loci associated with nephropathy in these regions. Human region 9q21 includes a locus associated with nephropathy in type 1 diabetics (14). Also, at 9q21 Arar et al. (2) found a significant locus associated with chronic kidney disease in Mexican Americans. A locus linked to albuminuria was found by Freedman et al. (9) at human chromosome 10q21.1 in type 2 diabetics. The peak we found on chromosome 9 is orthologous to human chromosome region 11q22–24, which contains a locus linked with FSGS (22). Surprisingly this locus on chromosome 9 reduced albuminuria when homozygous for the FVB genotype. In view of the strong opposite effect of the overall FVB genotype, this was unexpected and points to the complexity of genomic influence on albuminuria.
Each of the four individual genomic peaks had a statistically significant effect on albuminuria. For the three peaks that increased albuminuria on chromosomes 11, 13, and 19, the magnitude of the individual gene effect ranged from 2.5- to 5-fold. Of our 108 N2 mice, 16 were homozygous and 17 were heterozygous for all 3 of these loci. In this population of 33 mice, homozyogosity resulted in a 12.5-fold increase in albuminuria. This is almost 75% of the difference in albuminuria we found between OVE and OVE/C57 mice. Therefore, we suggest that these three loci contain the major QTLs that confer susceptibility to diabetic albuminuria on the FVB strain of mice.
In conclusion, these results demonstrate that the very severe albuminuria of OVE mice is almost completely dependent on the inbred genetic background FVB. A single cross to DBA2 or C57BL6 reduces albuminuria ∼17-fold. Coinciding with the drop in albuminuria, renal histopathology is significantly reduced. Evidence was obtained for four FVB loci that significantly affect OVE albuminuria and may prove useful in identifying genes that impact human DN.
GRANTS
This work was supported by National Institute of Diabetes and Digestive and Kidney Diseases Grant DK072032 and Juvenile Diabetes Research Foundation Grant 1-2005-88.
DISCLOSURES
No conflicts of interest, financial or otherwise, are declared by the authors.
REFERENCES
- 1.Abbate M, Zoja C, Remuzzi G. How does proteinuria cause progressive renal damage? J Am Soc Nephrol 17: 2974–2984, 2006 [DOI] [PubMed] [Google Scholar]
- 2.Arar NH, Voruganti VS, Nath SD, Thameem F, Bauer R, Cole SA, Blangero J, MacCluer JW, Comuzzie AG, Abboud HE. A genome-wide search for linkage to chronic kidney disease in a community-based sample: the SAFHS. Nephrol Dial Transplant 23: 3184–3191, 2008 [DOI] [PMC free article] [PubMed] [Google Scholar]
- 3.Bowden DW. Genetics of kidney disease. Kidney Int Suppl: S8–S12, 2003 [DOI] [PubMed] [Google Scholar]
- 4.Churchill GA, Doerge RW. Empirical threshold values for quantitative trait mapping. Genetics 138: 963–971, 1994 [DOI] [PMC free article] [PubMed] [Google Scholar]
- 5.Doorenbos C, Tsaih SW, Sheehan S, Ishimori N, Navis G, Churchill G, Dipetrillo K, Korstanje R. Quantitative trait loci for urinary albumin in crosses between C57BL/6J and A/J inbred mice in the presence and absence of Apoe. Genetics 179: 693–699, 2008 [DOI] [PMC free article] [PubMed] [Google Scholar]
- 6.Epstein PN, Overbeek PA, Means AR. Calmodulin-induced early-onset diabetes in transgenic mice. Cell 58: 1067–1073, 1989 [DOI] [PubMed] [Google Scholar]
- 7.Fernandez L, Marchuk DA, Moran JL, Beier DR, Rockman HA. An N-ethyl-N-nitrosourea mutagenesis recessive screen identifies two candidate regions for murine cardiomyopathy that map to chromosomes 1 and 15. Mamm Genome 20: 296–304, 2009 [DOI] [PMC free article] [PubMed] [Google Scholar]
- 8.Freedman BI, Bostrom M, Daeihagh P, Bowden DW. Genetic factors in diabetic nephropathy. Clin J Am Soc Nephrol 2: 1306–1316, 2007 [DOI] [PubMed] [Google Scholar]
- 9.Freedman BI, Bowden DW, Rich SS, Xu J, Wagenknecht LE, Ziegler J, Hicks PJ, Langefeld CD. Genome-wide linkage scans for renal function and albuminuria in type 2 diabetes mellitus: the Diabetes Heart Study. Diabet Med 25: 268–276, 2008 [DOI] [PubMed] [Google Scholar]
- 10.Grimm PC, Nickerson P, Gough J, McKenna R, Stern E, Jeffery J, Rush DN. Computerized image analysis of Sirius Red-stained renal allograft biopsies as a surrogate marker to predict long-term allograft function. J Am Soc Nephrol 14: 1662–1668, 2003 [DOI] [PubMed] [Google Scholar]
- 11.Held PJ, Port FK, Webb RL, Wolfe RA, Garcia JR, Blagg CR, Agodoa LY. The United States Renal Data System's 1991 Annual Data Report: an introduction. Am J Kidney Dis 18: 1–16, 1991 [PubMed] [Google Scholar]
- 12.Kralik PM, Long Y, Song Y, Yang Wei LH, Coventry S, Zheng S, Epstein PN. Diabetic albuminuria is due to a small fraction of nephrons distinguished by albumin stained tubules and glomerular adhesions. Am J Pathol 175: 500–5009, 2009 [DOI] [PMC free article] [PubMed] [Google Scholar]
- 13.Nathan DM. Long-term complications of diabetes mellitus. N Engl J Med 328: 1676–1685, 1993 [DOI] [PubMed] [Google Scholar]
- 14.Pezzolesi MG, Poznik GD, Mychaleckyj JC, Paterson AD, Barati MT, Klein JB, Ng DP, Placha G, Canani LH, Bochenski J, Waggott D, Merchant ML, Krolewski B, Mirea L, Wanic K, Katavetin P, Kure M, Wolkow P, Dunn JS, Smiles A, Walker WH, Boright AP, Bull SB, Doria A, Rogus JJ, Rich SS, Warram JH, Krolewski AS. Genome-wide association scan for diabetic nephropathy susceptibility genes in type 1 diabetes. Diabetes 58: 1403–1410, 2009 [DOI] [PMC free article] [PubMed] [Google Scholar]
- 15.Proctor G, Jiang T, Iwahashi M, Wang Z, Li J, Levi M. Regulation of renal fatty acid and cholesterol metabolism, inflammation, and fibrosis in Akita and OVE26 mice with type 1 diabetes. Diabetes 55: 2502–2509, 2006 [DOI] [PubMed] [Google Scholar]
- 16.Qi Z, Fujita H, Jin J, Davis LS, Wang Y, Fogo AB, Breyer MD. Characterization of susceptibility of inbred mouse strains to diabetic nephropathy. Diabetes 54: 2628–2637, 2005 [DOI] [PubMed] [Google Scholar]
- 17.Stoll M, Kwitek-Black AE, Cowley AW, Jr, Harris EL, Harrap SB, Krieger JE, Printz MP, Provoost AP, Sassard J, Jacob HJ. New target regions for human hypertension via comparative genomics. Genome Res 10: 473–482, 2000 [DOI] [PMC free article] [PubMed] [Google Scholar]
- 18.Sugiyama F, Churchill GA, Higgins DC, Johns C, Makaritsis KP, Gavras H, Paigen B. Concordance of murine quantitative trait loci for salt-induced hypertension with rat and human loci. Genomics 71: 70–77, 2001 [DOI] [PubMed] [Google Scholar]
- 19.Susztak K, Raff AC, Schiffer M, Bottinger EP. Glucose-induced reactive oxygen species cause apoptosis of podocytes and podocyte depletion at the onset of diabetic nephropathy. Diabetes 55: 225–233, 2006 [PubMed] [Google Scholar]
- 20.Teiken JM, Audettey JL, Laturnus DI, Zheng S, Epstein PN, Carlson EC. Podocyte loss in aging OVE26 diabetic mice. Anat Rec (Hoboken) 291: 114–121, 2008 [DOI] [PubMed] [Google Scholar]
- 21.Wilmer WA, Rovin BH, Hebert CJ, Rao SV, Kumor K, Hebert LA. Management of glomerular proteinuria: a commentary. J Am Soc Nephrol 14: 3217–3232, 2003 [DOI] [PubMed] [Google Scholar]
- 22.Winn MP, Conlon PJ, Lynn KL, Howell DN, Slotterbeck BD, Smith AH, Graham FL, Bembe M, Quarles LD, Pericak-Vance MA, Vance JM. Linkage of a gene causing familial focal segmental glomerulosclerosis to chromosome 11 and further evidence of genetic heterogeneity. Genomics 58: 113–120, 1999 [DOI] [PubMed] [Google Scholar]
- 23.Zhao HJ, Wang S, Cheng H, Zhang MZ, Takahashi T, Fogo AB, Breyer MD, Harris RC. Endothelial nitric oxide synthase deficiency produces accelerated nephropathy in diabetic mice. J Am SocNephrol 17: 2664–2669, 2006 [DOI] [PMC free article] [PubMed] [Google Scholar]
- 24.Zheng S, Carlson EC, Yang L, Kralik PM, Huang Y, Epstein PN. Podocyte-specific overexpression of the antioxidant metallothionein reduces diabetic nephropathy. J Am Soc Nephrol 19: 2077–2085, 2008 [DOI] [PMC free article] [PubMed] [Google Scholar]
- 25.Zheng S, Noonan WT, Metreveli NS, Coventry S, Kralik PM, Carlson EC, Epstein PN. Development of late-stage diabetic nephropathy in OVE26 diabetic mice. Diabetes 53: 3248–3257, 2004 [DOI] [PubMed] [Google Scholar]


