Abstract
A device for continuous differential impedance analysis of single cells held by a hydrodynamic cell trapping is presented. Measurements are accomplished by recording the current from two closely-situated electrode pairs, one empty (reference) and one containing a cell. We demonstrate time-dependent measurement of single cell impedance produced in response to dynamic chemical perturbations. First, the system is used to assay the response of HeLa cells to the effects of the surfactant Tween, which reduces the impedance of the trapped cells in a concentration dependent way and is interpreted as gradual lysis of the cell membrane. Second, the effects of the bacterial pore-forming toxin, Streptolysin-O are measured: a transient exponential decay in the impedance is recorded as the cell membrane becomes increasingly permeable. The decay time constant is inversely proportional to toxin concentration (482, 150, and 30 s for 0.1, 1, and 10 kU/ml, respectively).
Electronic supplementary material
The online version of this article (doi:10.1007/s10404-009-0534-2) contains supplementary material, which is available to authorized users.
Keywords: Impedance spectroscopy, Single-cell analysis, Microfluidic, Microfabrication
Introduction
Single-cell analysis and their response to chemical and biologic stimuli can provide unique insights into cellular behavior, including dynamics and localization of cellular processes. However, due to heterogeneous behavior among a population, the varied behavior is often difficult to interpret using quantitative models. Current high-throughput methods often lack the ability to track dynamic processes occurring in space and time (Di Carlo et al. 2006a, b).
Single cells can be used as sensors for detecting chemical and biological toxins or mutagens, and are also widely used for screening pharmacologically active compounds. Cell analysis systems have applications in drug discovery, bio-threat detection, and environmental pollutant identification (Asphahani and Zhang 2007). Most biosensors require analysis of a label attached to a molecule. The amount of label is measured and correlated to the number of bound targets. Labels can be fluorophores, magnetic beads, radioactive tags, enzymes that produce an easily detectable product (optical or electrochemical), or nanoparticles.
Impedance spectroscopy is a noninvasive, label-free analytical method that can provide information on the response of cells to their environment. This technique is used in many areas including the analysis of fluids (Nwankwo and Durning 1999), polymers (Fernandez-Sanchez et al. 2005), ion cells (Liaw et al. 2004), batteries (Xia et al. 1997), corrosion phenomena (Walter 1986), electrochemical kinetics/mechanisms, and biologic systems at the tissue (Kedar et al. 1994) and whole-organism level (Kushner and Schoeller 1986). Impedance spectroscopy has been used to measure the passive electrical properties of biologic cells for many years, both in bulk suspensions (Bordi et al. 2002; Markx et al. 1991; Davey et al. 1996; Schwan 1993; Merla and D’inzeo 2006; Fuhr et al. 1994; Lisin et al. 1996) and on substrates (Luong et al. 2004; Xiao et al. 2002a, b; Ceriotti et al. 2007a, b; Ciambrone 2004; Linderholm et al. 2006; Wegener et al. 1999, 2002). Traditionally, impedance measurements have been performed on suspensions of cells (Asami 1996; Gheorghiu and Asami 1998), but this method is insensitive to rare events and leads to temporal averaging: fast, time-dependent transitions occurring at the single-cell level may spread slowly through the population and could be interpreted as a gradual change (Di Carlo et al. 2006a). Experimental platforms that analyze large number of individual cells overcome this problem, whereby any heterogeneity within a cell population is measured (Lidstrom and Meldrum 2003).
The patch-clamp technique is a powerful method for the measurement of electrophysiologic activity of single cells; however, it is a labor-intensive method that conventionally requires a micromanipulator, micropipettes, and a skilled operator. To this end, high-throughput single-cell patch-clamp analysis systems are being developed within microfluidic lab-on-a-chip devices (Ionescu-Zanetti et al. 2005; Seo et al. 2004), with great promise of higher-throughput systems (Chen and Folch 2006). However, forming effective (i.e., giga-ohm) seals on arrays of cells is still problematic, the technique is invasive as the cellular membrane is intentionally disrupted, and chip fabrication is often complicated or requires exceptionally expensive equipment or materials. In this article, we describe a device for performing continuous differential impedance analysis of single cells that are hydrodynamically captured and held in traps within a microfluidic channel without the use of labels.
A number of published methods (Cho and Thielecke 2007; Han and Frazier 2006; James et al. 2008; Han et al. 2007; Jang and Wang 2007) describe single cell capture coupled with impedance analysis. So far, no device features a differential electrode arrangement that measures multiple signals from multiple trapping sites. We have developed such a system, and the design and operation are shown in Fig. 1. The device sits on a microscope stage and is connected to an impedance analyzer. Syringe pumps are used to inject cells and perfuse medium and/or drugs into the chip. Individually addressable electrodes and micrometer-sized traps are integrated in a microfluidic platform. Single cells are hydrodynamically trapped; measurements are performed by normalizing the spectrum of a trap containing a single cell to a counterpart empty trap. Long-term studies are, therefore, not influenced by local changes in temperature, pH, or conductivity. The recorded spectrum is analyzed to quantify changes in the electrical parameters of an individual cell’s membrane.
Fig. 1.
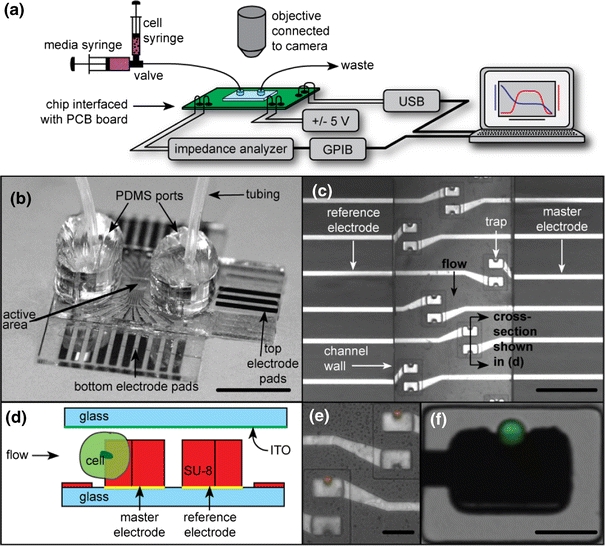
a Overview of the experimental setup. The microfluidic device is mounted on a PCB board, which makes electrical connections to the chip and interfaces to a computer and the impedance analyzer. A microscope is used to image the device, and a syringe pump to flow cells and media. b Image of a device with tubing attached via PDMS ports, scale bar = 1 cm. c Photograph of the channel containing multiple trapping sites, each of which has a pair of electrodes/traps, scale bar = 250 μm. d Schematic cross section of the trapping region showing the two electrodes used for differential measurements. e Image of traps with 15 μm beads captured in traps above master electrodes. Note that the reference traps are empty, because they face downstream. f Image of a trapped single HeLa cell, labeled with Celltracker™, scale bar = 30 μm
The design of the trapping structures ensures that the reference trap remains empty because it faces downstream, as shown in a top view micrograph in Fig. 1c and in a cross-sectional diagram in Fig. 1d. Figure 1c shows the microfluidic channel with six sets of traps, and the electrode pairs, one sample and one reference. Also shown in Fig. 1e and f are examples of a trapped fluorescent cell-sized beads and HeLa cell labeled with Celltracker dye, respectively.
As “proof of concept,” individual HeLa cells were trapped and continuously monitored over an extended time period during exposure to Tween and Streptolysin-O (SLO). Tween is a surfactant that is often used to lyse mammalian cells by compromising the cellular membrane. SLO is a pore-forming bacterial toxin classified as a member of the cholesterol-dependent cytolysin family, a large group of proteins that attack cholesterol containing membranes to form ring-shaped pores that mediate cell death (Tilley et al. 2005; Tilley and Saibil 2006).
The device here enables measurement of toxin activity at the single cell level in a noninvasive and label-free manner. The impedance of captured single cells perfused with solutions of SLO was measured, and the effect on the electrical conductivity of the cell membrane extrapolated to determine the effect of pore formation.
Methods
Fabrication
A large area optically transparent electrode is used for the lid of the device. Each cell trap is bounded by an SU8 structure that almost completely encloses the driven small electrode. The device was made by bonding two microfabricated substrates, aligning the cell traps to the measurement electrodes. The general scheme for fabrication is shown in Fig. 2. A lift-off process was used to pattern metal electrodes (70 nm Pt with a 25 nm Ti adhesion layer) onto 4″ Pyrex wafers, for the bottom substrate and onto an Indium Tin Oxide- (ITO) coated Pyrex wafer for the top substrate. The metal on the bottom substrate serves as working electrodes for the impedance measurements. The metal on the top substrate serves to make low-resistance connections between the ITO surface and electronics. The bottom substrate was patterned with a 1 μm thick layer of SU8 (SU8 2001, Microchem) which insulated the connections to the sensing electrodes. A second 25-μm thick SU8 layer (SU8 2025) was patterned on top of this layer to form both the walls of the fluidic channels and the U-shaped cell traps. The top (ITO) substrate was patterned with a 3-μm layer of SU8 (SU8 2005), to create a 3-μm separation between the top of the traps and the top substrate, in addition to insulating the upper electrode outside the sensing areas (see Electronic Supplementary Materials for autoCAD files of the lithography masks). This gap is integral to the hydrodynamic trapping process. Similar traps have been fabricated using PDMS (Sylgard 184, Dow Corning) (Di Carlo et al. 2006b); however, the flexible nature of PDMS makes it prohibitively difficult to reliably align the traps with the metal electrodes on the base without significant and costly engineering. Each pair of wafers had 12 devices. Wafers were diced with an MP500 free shape-cutting machine (MDI Schott, Germany). After drilling access ports, the substrates were aligned and bonded using a UV-curable glue (Norland Optical Adhesive 74).
Fig. 2.
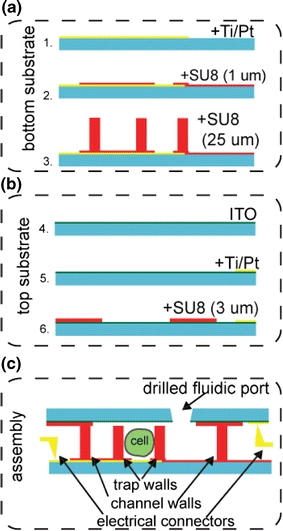
Fabrication steps: The device was formed by assembling two microfabricated substrates. a On the bottom substrate (glass), Ti/Pt was deposited using an electron beam evaporator. A 1-μm layer of SU8 was used to insulate the leads of the working electrodes, such that only the active areas of the metal are exposed to the cell solution. A second SU8 layer (25 μm thick) was patterned on top to form both the walls of the fluidic channels as well as the U-shaped cell traps. b On the top substrate (ITO-coated glass), Ti/Pt metal pads were evaporated and a 3-μm layer of SU8 was patterned to create a gap separating the top of the traps on the bottom substrate from the top ITO substrate. c The device was assembled by aligning the two substrates with the aid of a stereoscope, clamping them and bonding them with UV-curable glue
Experimental
The chip was held on a PCB with spring-loaded connectors (SAMTEC SEI series) to contact the electrode pads and connected to a pump and impedance analyzer as shown in Fig. 1a. Cells were observed with an upright microscope. Impedance signals were acquired using two 8-way integrated multiplexers (ADG608, Analog Devices), controlled by MATLAB (The Mathworks, Natick, MA) via a USB interface. The impedance of each trap was measured using an impedance analyzer (Novocontrol Alpha-N) controlled by MATLAB via an IEEE-488 interface. Microfluidic ports were made by punching small casts of PDMS and plasma bonding the ports to the upper glass surface. HeLa cells were cultured in Dulbecco’s Modified Eagle’s Medium (Sigma) with 5% fetal calf serum (Gibco) and 100 μg/ml Penicillin/Streptomycin (Gibco). Cells were harvested and resuspended in Phosphate Buffer Saline (PBS).
Tween solutions were prepared by diluting Polyoxyethylenesorbitanmonolaurate (Sigma) in PBS at concentrations ranging from 0.01 to 1% w/w. SLO toxin (Sigma) was prepared at concentrations of 100, 10, and 100 U/ml in PBS and mixed with 100 mM dithiothreitol (DTT). DTT activates the toxin by creating a reducing environment for cysteine residues.
FEM simulations
Finite element analysis simulations were performed in COMSOL Multiphysics v3.4 and MATLAB v7.5. A summary of the geometry and boundary conditions is given in Fig. 3I. The cell sits in PBS (permittivity ε = 78, conductivity σ = 1.6 S/m); the electrical properties of the SU8 trap are ε = 5, σ = 0 S/m, and the cell in the trap was modeled using a combination of the Maxwell’s mixture formula and a single-shelled model for cells. Briefly, according to the MMF:
 |
1 |
where
 |
2 |
Φ is the volume fraction (ratio of the cell volume to the detection volume), and in turn, the cell complex permittivity is defined as
 |
3 |
where
 |
4 |
The notation ε* is used to indicate complex permittivity, which can be expressed in terms of permittivity and conductivity:
 |
5 |
Fig. 3.
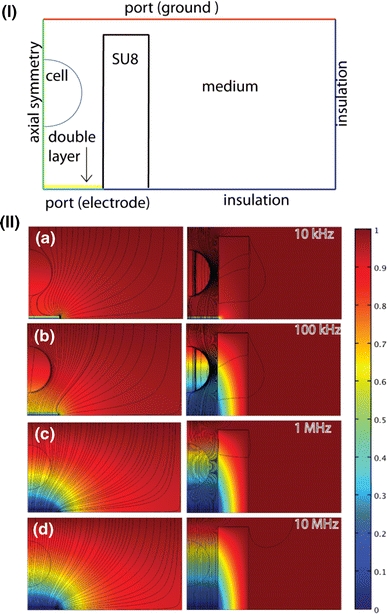
I Outline of the Finite Element Model (FEM) of a single cell in a trap site: A two-dimensional model, which exploits the axial symmetry of the system, is meshed with 60,000 elements. The boundary conditions are indicated in the diagram. The medium surrounding the cell is ε = 78, σ = 1.6 S/m, the SU8 trap is ε = 5, σ = 0 S/m). The cytoplasm has permittivity ε = 70, and conductivity σ = 1.6 S/m, with membrane ε = 9, σ = 1 × 10⁻⁸ S/m and thickness = 5 nm. II Containment of current flux within su8 structures. Electrical potential and current density (streamlines) as for two-dimensional axi-symmetrical models of a cell immobilized between an electrode on the bottom and a large electrode on the top, with and without the SU8 structure. With the SU8 the current flux is well confined to the cell, therefore improving the sensitivity. (a) At frequencies below 10 kHz the electric potential drops across the ionic double layer. (b) Up to 100 kHz, the cell membrane effectively shields the cell from the electric field, so that the behavior is dominated by cell size and membrane properties. (c–d) Above 1 MHz the cell membrane is shunted and the impedance is dominated by the cell cytoplasm
For the cell we used the following values: εint = 70, σ int = 1.6 S/m, εmem = 9, σ mem = 1 × 10⁻⁸ S/m, with a membrane thickness d mem of 5 nm (Morgan and Green 2003). The double layer on the electrodes is extremely thin (1 nm) and cannot be easily inserted into the numerical model. Therefore, we used measured values of differential capacitances (F/m2) using larger electrodes made from the same materials as the microelectrodes on the chip itself. Using the well-known expression
 |
6 |
and forcing d to 1 μm, a value easy to mesh, we extrapolated the adjusted value of ε.
Simulations were performed using both three-dimensional and two-dimensional axi-symmetric models, as shown in Fig. 3II). The system is not strictly axi-symmetric; however, the two-dimensional model provides good approximations (not shown) to the significantly more computationally intensive three-dimensional simulations. Changes in impedance spectra due to variations in cell membrane conductance, cell size, and position in the trap were simulated.
Figure 3 shows the electric field and potential for traps with and without the SU8 boundary as a function of frequency. The field simulations demonstrate that this design of SU8 structure confines the electric field to the region where the cell sits, increasing the effective volume fraction and maximizing the sensitivity of the measurement. This design is relatively insensitive to the position of the trapped cell: variations in the position of the cell within the channel by up to ± 12 μm (for a channel height of 25 μm) result in a maximum change in the magnitude of the impedance of 3% at 100 kHz.
In order to estimate the sensitivity of the system to changes in cell parameters, simulations were performed for different values of cell membrane conductivity and cell dimensions. At frequencies lower than 50 kHz, any changes are masked by the double layer. Although changes in cell size cannot be differentiated from changes in cell membrane conductivity, the simulations showed that a change of 0.1 mS/m in membrane conductivity results in a 5% change in the magnitude of the impedance, at 100 kHz.
The conductivity of SLO pores has not been reported (e.g., from patch clamp). However, measurements of Perfringolysin-O (PFO), also a member of the cholesterol-dependent cytolysin family of toxins, demonstrate a single pore conductance of 4.5 nS (Shepard et al. 2000). This is equal to a single pore conductivity of 31.8 nS/m for the SLO pores, which have diameters as large as 30 nm and span membranes 5 nm thick (Bhakdi et al. 1985; Alouf and Geoffroy 1988; Bhakdi et al. 1984). Multiple pores increase the membrane conductivity linearly. However, the effect on the impedance of the cell is not simple. FEM simulations were used with analytical calculations to estimate the number of open pores from the measured impedance response. The simulation results (shown in Supplementary Fig. 3) illustrate that the impedance response is quite insensitive to the insertion of a small number of pores, but can be used to quantify the effect of many thousands of pores, with some confidence, assuming that other cellular parameters (such as cell shape and size) do not change. Simulations suggest that measurable changes (1%) in the impedance magnitude occur for approximately 1,000 pores, when the decrease is in the range of 2–9%.
Results and discussions
In a typical experiment, the impedance spectrum was continuously recorded over a frequency range from 100 Hz to 2 MHz. The signal was multiplexed from eight active trapping site and the eight reference electrodes.
The “cell” signal is obtained by normalizing the two spectra:
 |
7 |
 |
8 |
|Z| and ϕ are the magnitude and phase of the electrical impedance, respectively. The “master” subscript refers to measurements for the electrode with the cell and “reference” to the electrode on the opposite side of the trap—see Fig. 1c.
HeLa cells (suspended in PBS) flowing through the device were hydrodynamically captured, and the impedance change was measured. Figure 4 shows the average response for seven different single cells at a frequency of 300 kHz. Typical increases in |Z diff| ranged from 20 to 30%, consistent with simulation results (simulation data shown in Supplementary material). Error bars show one standard deviation, which is mostly attributed to cell-to-cell variability in addition to variations in the position of the cell within the trap.
Fig. 4.
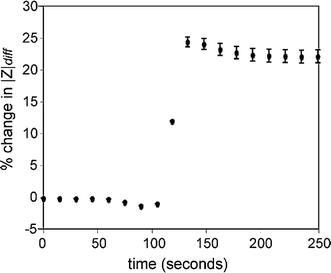
Percent change in the magnitude of the impedance (f = 300 kHz) when cells are captured. Error bars represent one standard deviation for seven cells
In order to demonstrate cell lysis, HeLa cells were captured in the traps and perfused with PBS containing different concentrations of Tween. The effect of different concentrations of Tween on the magnitude of the impedance (measured at 300 kHz) is shown in Fig. 5. A solution of 1% w/w causes complete cell lysis resulting in a large sudden decrease in impedance magnitude (25% over 10 s), Fig. 5a. Prior to lysis, there is a short increase in the impedance, which is attributed to swelling of the cell (this was confirmed optically). Presumably, water enters the cell through the disrupted membrane, and then the cell bursts. A lower concentration of Tween (0.01% w/w) causes a gradual decrease in the impedance (4% over 100 s), as shown in Fig. 5b.
Fig. 5.
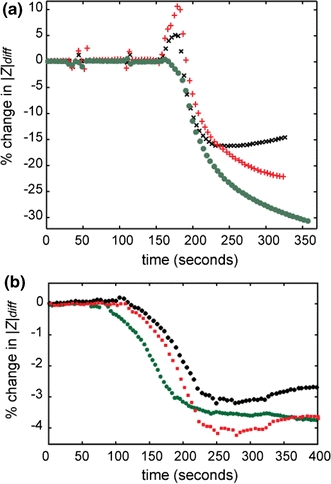
Traces of three individual cells showing the typical change in impedance when a single HeLa Cells is perfused with Tween 20 at two different concentrations. a 1% Tween 20 causes a differential |Z| change (at 300 kHz) of 20–30% in 20–50 s. A transient increase in |Z| of the order of 5–10% occurs before permeabilization probably due to transient osmotic swelling. b 0.01% Tween 20 causes a differential |Z| change (at 300 kHz) of 3–5% in 150 s
When cells were perfused with DTT-activated SLO (in PBS) a similar change in impedance magnitude was recorded (Fig. 6). A solution of 100 U/ml caused an initial increase in impedance (cell swelling) followed by a gradual decrease; 1 kU/ml had a similar but more pronounced effect. The decreases were fitted by a single exponential decay with characteristic times shown in Table 1. Higher concentrations of toxin caused faster decays, but the final value of impedance is the same for each case as the cell is porated and becomes electrically transparent. This data indicate that the final value of the impedance magnitude is independent of toxin concentration in the solution. Unlike the data for Tween, where the cells appear to be completely lysed, the change in impedance is not as great. The rate of change of impedance and, therefore, the rate of pore insertion were significantly faster for the higher concentration solution (10 kU/ml in 20 s). From simulation, the magnitude of the change in impedance can be correlated with a change in membrane conductance (assuming no other parameters change). Based on our model, the recorded value of a 10% change in impedance magnitude at 300 kHz is equivalent to the insertion of ~10,000 pores.
Fig. 6.
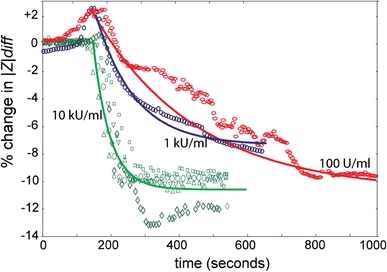
Data showing the effect of SLO on the impedance spectrum from single cells. Three different concentrations were assayed and differential impedance spectra were acquired over time. The data represented here was sampled at the frequency of 300 kHz. The exponential curves (solid lines) are the average responses for 10, 1, 100 U/ml. We postulate that the effect of the osmotic swelling evident for the 100 U/ml and 1 kU/ml is swamped by the effect of the membrane poration that occurs at a much faster rate with 10 kU/ml. However, it is difficult to confirm this conclusion unequivocally by means of impedance spectroscopy because the swelling causes an increase in impedance, whereas poration of the membrane causes a decrease, two contrasting effects that mask each other
Table 1.
Exponential decay time constants are fitted to the data for the impedance response of single cells to SLO toxin
| SLO concentration | Time constant (s) | χ2 | R 2 |
|---|---|---|---|
| 100 U/ml | 482 | 1.30E-04 | 0.59 |
| 1 kU/ml | 151 | 2.92E-05 | 0.98 |
| 10 kU/ml | 30 | 1.81E-04 | 0.87 |
The decay time constants span from 30 to 480 s
Interestingly, it appears that although the insert rate was significantly faster for higher concentrations (10 kU/ml in 20 s) than for the lower concentration (100 U/ml in 500 s), the final number of pores inserted into the membrane is of the range 10,000–15,000 regardless of the toxin concentration in the bathing solution.
Conclusions
A single-cell recording device has been designed, fabricated, and used to noninvasively quantify the effect of a surfactant and a pore-forming toxin on captured cells. The platform allows multiplexed recording of continuous differential impedance spectra from individual cells held in an array of hydrodynamic traps. The system was used to assay the transient response of HeLa cells to the lysing effects of the surfactant Tween and the kinetic pore-forming effect of SLO. Tween was found to change the impedance of trapped cells, with the change correlating with concentration. Perfusion with SLO toxin caused an exponential decay in the impedance with time constants inversely proportional to toxin concentration. The combination of single hydrodynamic cell trapping with single cell impedance analysis provides a scalable label-free cell analysis system. The detection limit of the platform was determined to be between approximately 1,000 pores. Although this is a much lower sensitivity of that afforded by patch-clamp techniques, the method is quick and noninvasive. Therefore, there is the potential to create vast two-dimensional arrays of single-cell traps, each individually addressable to create an automated platform for cell screening. Further developments include the capability to electroporate or electrically lyse single cells using DC potentials, either through the direct action of a high local electric field or by generating a localized hydroxide-rich environment, which disrupts the cellular membrane (Nevill et al. 2007).
Electronic supplementary material
Below is the link to the electronic supplementary material.
Acknowledgments
The authors would like to acknowledge the support from a UK IRC in Bio-nanotechnology (DM), National Science Foundation (Career Award: Biomolecular Nanoelectronic Junctions), National Institutes of Health (NIH) Nanomedicine Development Centers Funding (JTN), NDSEG Fellowship (JTN), and GlaxoSmithKline for financial contributions, Dino Di Carlo for help, and the UC Berkeley Microlab and the University of Southampton ORC for clean room facilities.
Open Access
This article is distributed under the terms of the Creative Commons Attribution Noncommercial License which permits any noncommercial use, distribution, and reproduction in any medium, provided the original author(s) and source are credited.
References
- Alouf JE, Geoffroy C (1988) Production, purification and assay of Streptolysin O. Method Enzymol 165:52–59 [DOI] [PubMed]
- Asami K (1996) Dielectric spectroscopy of biological cells. Bioelectrochem Bioenerg 40:141–145
- Asphahani F, Zhang M (2007) Cellular impedance biosensors for drug screening and toxin detection. Analyst 132(9):835–841 [DOI] [PMC free article] [PubMed]
- Bhakdi S, Roth M, Sziegoleit A, Tranum-Jensen J (1984) Isolation and identification of two hemolytic forms of streptolysin-O. Infect Immun 46(2):394–400 [DOI] [PMC free article] [PubMed]
- Bhakdi S, Tranum-Jensen J, Sziegoleit A (1985) Mechanism of membrane damage by Streptolysin-O. Infect Immun 47(1):52–60 [DOI] [PMC free article] [PubMed]
- Bordi F, Cametti C, Gili T (2002) Dielectric spectroscopy of erythrocyte cell suspensions. A comparison between Looyenga and Maxwell. J Non-Cryst Solids 305:278–284
- Ceriotti L, Ponti J, Broggi F, Kob A, Drechsler S, Thedinga E, Colpo P, Sabbioni E, Ehret R, Rossi F (2007a) Real-time assessment of cytotoxicity by impedance measurement on a 96-well plate. Sens Actuators B 123:769–778
- Ceriotti L, Ponti J, Colpo P, Sabbioni E, Rossi F. Assessment of cytotoxicity by impedance spectroscopy. Biosens Bioelectron. 2007;22:3057–3063. doi: 10.1016/j.bios.2007.01.004. [DOI] [PubMed] [Google Scholar]
- Chen CC, Folch A. A high-performance elastomeric patch clamp chip. Lab Chip. 2006;6:1338–1345. doi: 10.1039/b607913j. [DOI] [PubMed] [Google Scholar]
- Cho S, Thielecke H (2007) Micro hole-based cell chip with impedance spectroscopy. Biosens Bioelectron 22(8):1764–1768 [DOI] [PubMed]
- Ciambrone G. Cellular dielectric spectroscopy: a powerful new approach to label-free cellular analysis. J Biomol Screen. 2004;9:467–480. doi: 10.1177/1087057104267788. [DOI] [PubMed] [Google Scholar]
- Davey HM, Davey CL, Woodward AM, Edmonds AN, Lee AW, Kell DB (1996) Oscillatory, stochastic and chaotic growth rate fluctuations in permittistatically controlled yeast cultures. Biosystems 39(1):43–61 [DOI] [PubMed]
- Di Carlo D, Aghdam N, Lee LP (2006a) Single-cell enzyme concentrations, kinetics, and inhibition analysis using high-density hydrodynamic cell isolation arrays. Anal Chem 78(14):4925–4930 [DOI] [PubMed]
- Di Carlo D, Wu LY, Lee LP (2006b) Dynamic single cell culture array. Lab Chip 6(11):1445–1449 [DOI] [PubMed]
- Fernandez-Sanchez C, Mcneil CJ, Rawson K (2005) Electrochemical impedance spectroscopy studies of polymer degradation: application to biosensor development. TRAC-Trend Anal Chem 24(1):37–48
- Fuhr G, Glasser H, Muller T, Schnelle T (1994) Cell manipulation and cultivation under AC electric-field influence in highly conductive culture media. Biochimica et Biophysica Acta 1201(3):353–360 [DOI] [PubMed]
- Gheorghiu E, Asami K (1998) Monitoring cell cycle by impedance spectroscopy: experimental and theoretical aspects. Bioelectrochem Bioenerg 45:139–143
- Han A, Frazier AB. Ion channel characterization using single cell impedance spectroscopy. Lab Chip. 2006;6:1412–1414. doi: 10.1039/b608930e. [DOI] [PubMed] [Google Scholar]
- Han A, Yang L, Frazier A. Quantification of the heterogeneity in breast cancer cell lines using whole-cell impedance spectroscopy. Clin Cancer Res. 2007;13:139–143. doi: 10.1158/1078-0432.CCR-06-1346. [DOI] [PubMed] [Google Scholar]
- Ionescu-Zanetti C, Shaw RM, Seo JG, Jan YN, Jan LY, Lee LP. Mammalian electrophysiology on a microfluidic platform. Proc Natl Acad Sci USA. 2005;102:9112–9117. doi: 10.1073/pnas.0503418102. [DOI] [PMC free article] [PubMed] [Google Scholar]
- James C, Reuel N, Lee E, Davalos R, Mani S, Carrollportillo A, Rebeil R, Martino A, Apblett C. Impedimetric and optical interrogation of single cells in a microfluidic device for real-time viability and chemical response assessment. Biosens Bioelectron. 2008;23:845–851. doi: 10.1016/j.bios.2007.08.022. [DOI] [PubMed] [Google Scholar]
- Jang LS, Wang MH (2007) Microfluidic device for cell capture and impedance measurement. Biomed Microdevices 9(5):737–743 [DOI] [PubMed]
- Kedar RP, Bourne TH, Powles TJ, Collins WP, Ashley SE, Cosgrove DO, Campbell S (1994) Effects of tamoxifen on uterus and ovaries of postmenopausal women in a randomized breast-cancer prevention trial. Lancet 343(8909):1318–1321 [DOI] [PubMed]
- Kushner RF, Schoeller DA (1986) Estimation of total-body water by bioelectrical impedance analysis. Am J Clin Nutr 44:417–424 [DOI] [PubMed]
- Liaw BY, Nagasubramanian G, Jungst RG, Doughty DH (2004) Modeling of lithium ion cells—a simple equivalent-circuit model approach. Solid State Ionics 175:835–839
- Lidstrom ME, Meldrum DR. Life-on-a-chip. Nat Rev Microbiol. 2003;1:158–164. doi: 10.1038/nrmicro755. [DOI] [PubMed] [Google Scholar]
- Linderholm P, Braschler T, Vannod J, Barrandon Y, Brouard M, Renaud P. Two-dimensional impedance imaging of cell migration and epithelial stratification. Lab Chip. 2006;6:1155. doi: 10.1039/b603856e. [DOI] [PubMed] [Google Scholar]
- Lisin R, Ginzburg BZ, Schlesinger M, Feldman Y (1996) Time domain dielectric spectroscopy study of human cells. 1. Erythrocytes and ghosts. Biochim Biophys Acta 1280(1):34–40 [DOI] [PubMed]
- Luong JHT, Xiao C, Lachance B, Leabu SM, Li X, Al E (2004) Extended applications of electric cell-substrate impedance sensing for assessment of the structure. Anal Chim Acta 501:61–69
- Markx GH, Tenhopen HJG, Meijer JJ, Vinke KL (1991) Dielectric-spectroscopy as a novel and convenient tool for the study of the shear sensitivity of plant-cells in suspension-Culture. J Biotechnol 19:145–158 [DOI] [PubMed]
- Merla C, D’inzeo G (2006) Dielectric spectroscopy of blood cells suspensions: study on geometrical structure of biological cells. Proceedings of the 28th IEEE EMBS annual international conference [DOI] [PubMed]
- Morgan H, Green NG (2003) AC electrokinetics: colloids and nanoparticles. Research Studies Press, Baldock
- Nevill JT, Cooper R, Dueck M, Breslauer DN, Lee LP (2007) Integrated microfluidic cell culture and lysis on a chip. Lab Chip 7(12):1689–1695 [DOI] [PubMed]
- Nwankwo E, Durning CJ (1999) Fluid property investigation by impedance characterization of quartz crystal resonators—Part I: methodology, crystal screening, and Newtonian fluids. Sens Actuators A 72:99–109
- Schwan HP (1993) Mechanisms responsible for electrical-properties of tissues and cell-suspensions. Med Prog Technol 19(4):163–165 [PubMed]
- Seo J, Ionescu-Zanetti C, Diamond J, Lal R, Lee LP. Integrated multiple patch-clamp array chip via lateral cell trapping junctions. Appl Phys Lett. 2004;84:1973–1975. doi: 10.1063/1.1650035. [DOI] [Google Scholar]
- Shepard LA, Shatursky O, Johnson AE, Tweten RK. The mechanism of pore assembly for a cholesterol-dependent cytolysin: formation of a large prepore complex precedes the insertion of the transmembrane beta-hairpins. Biochemistry. 2000;39:10284–10293. doi: 10.1021/bi000436r. [DOI] [PubMed] [Google Scholar]
- Tilley S, Saibil H. The mechanism of pore formation by bacterial toxins. Curr Opin Struct Biol. 2006;16:230–236. doi: 10.1016/j.sbi.2006.03.008. [DOI] [PubMed] [Google Scholar]
- Tilley S, Orlova E, Gilbert RJC, Andrew P, Saibil H. Structural basis of pore formation by the bacterial toxin pneumolysin. Cell. 2005;121:247–256. doi: 10.1016/j.cell.2005.02.033. [DOI] [PubMed] [Google Scholar]
- Walter GW (1986) A review of impedance plot methods used for corrosion performance analysis of painted metals. Corros Sci 26(9):681–703
- Wegener J, Zink S, Rösen P, Galla H. Use of electrochemical impedance measurements to monitor beta-adrenergic stimulation of bovine aortic endothelial cells. Pflugers Arch. 1999;437:925–934. doi: 10.1007/s004240050864. [DOI] [PubMed] [Google Scholar]
- Wegener J, Keese CR, Giaever I (2002) Recovery of adherent cells after in situ electroporation monitored electrically. Biotechniques 33(2):348, 350, 352 passim [DOI] [PubMed]
- Xia YY, Zhou YH, Yoshio M (1997) Capacity fading on cycling of 4V Li/LiMn2O4 cells. J Electrochem Soc 144(8):2593–2560
- Xiao C, Lachance B, Sunahara G, Luong JH. An in-depth analysis of electric cell-substrate impedance sensing to study the attachment and spreading of mammalian cells. Anal Chem. 2002;74:1333–1339. doi: 10.1021/ac011104a. [DOI] [PubMed] [Google Scholar]
- Xiao C, Lachance B, Sunahara G, Luong JH. Assessment of cytotoxicity using electric cell-substrate impedance sensing: concentration and time response function approach. Anal Chem. 2002;74:5748–5753. doi: 10.1021/ac025848f. [DOI] [PubMed] [Google Scholar]
Associated Data
This section collects any data citations, data availability statements, or supplementary materials included in this article.


