Abstract

MitoNEET is a newly discovered mitochondrial protein and a target of the TZD class of antidiabetes drugs. MitoNEET is homodimeric with each protomer binding a [2Fe-2S] center through a rare 3-Cys and 1-His coordination geometry. Both the fold and the coordination of the [2Fe-2S] centers suggest that it could have novel properties compared to other known [2Fe-2S] proteins. We tested the robustness of mitoNEET to mutation and the range over which the redox potential (EM) could be tuned. We found that the protein could tolerate an array of mutations that modified the EM of the [2Fe-2S] center over a range of ∼700 mV, which is the largest EM range engineered in an FeS protein and, importantly, spans the cellular redox range (+200 to −300 mV). These properties make mitoNEET potentially useful for both physiological studies and industrial applications as a stable, water-soluble, redox agent.
Iron sulfur (FeS) proteins are integral players in a vast array of biological activities from redox chemistry in respiration and photosynthesis to the regulation of transcription and gene expression.(1) They perform these many diverse functions using only a small set of different FeS moieties, and their functions are largely derived from the protein environment around the FeS centers.(1) In particular, tuning the redox potential (EM) of the FeS center is critical for controlling the conditions under which the protein responds to its environment and its interacting partners. As a class, FeS proteins span a wide redox range(1) under normal cellular conditions, indicating that FeS centers are fundamentally tunable. This broad redox range is achieved using several different protein scaffolds. Progress has recently been made in tuning the EM over a large range within the same protein scaffold of two non-FeS proteins, a cupredoxin(2) and a superoxide dismutase.(3) The upper EM limit of both of these systems is close to +1 V, which indicates that these proteins could be useful catalysts in key chemical redox processes such as water oxidation.1,2 However, neither system could access the solution potentials in cellular environments (−300 mV to +200 mV).(4) Because different FeS proteins naturally span this range,(1) we rationalized that the EM of a single FeS protein could be engineered to span both above and below the cellular solution range. Such a class of proteins could serve as reporters of cellular redox or be used to perturb the normal redox potential of the cellular solution. Here, we report our success in tuning the EM of the [2Fe-2S] center of the outer mitochondrial membrane protein mitoNEET over a range of 700 mV, which is the largest EM range engineered in an FeS protein and, importantly, spans the cellular redox range.
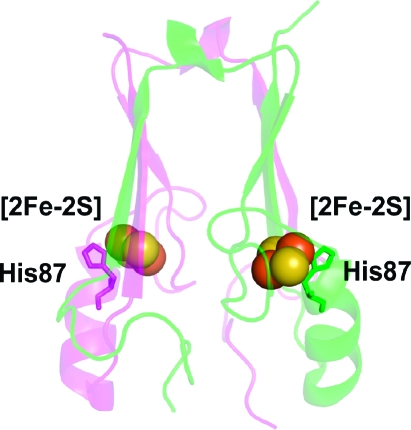
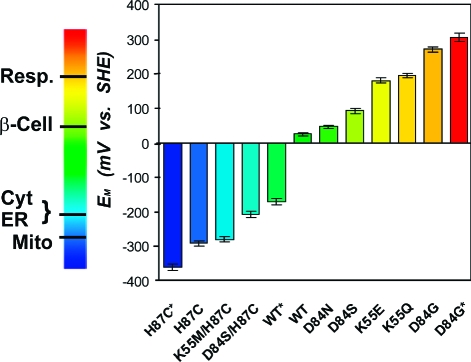
MitoNEET is a newly discovered mitochondrial target of the TZD class of antidiabetes drugs, such as pioglitazone (Actos) and rosiglitazone (Avandia).(5) Human mitoNEET defines a unique class of [2Fe-2S] proteins. The crystal structure shows that mitoNEET is a homodimer, with each protomer binding a [2Fe-2S] center through a rare 3-Cys and 1-His coordination geometry (Figure 1).(6) Both the fold and the coordination of the [2Fe-2S] centers suggest that mitoNEET could have novel properties compared to other known [2Fe-2S] proteins. For example, the unusual coordination of the [2Fe-2S] center contributes to the atypical proton-coupled EM,7 of +25 mV at pH 7.0.(7) We used potentiometric redox titrations(8) and protein-film voltammetry(9) to assess changes in the EM,7 resulting from mutagenesis of first and second shell residues near the [2Fe-2S] center. Single and double mutations were designed to test both the robustness of the [2Fe-2S] center and the EM range that could be achieved. We found that the EM could be tuned over a wide range (Figure 2, Table S1).
Figure 1.
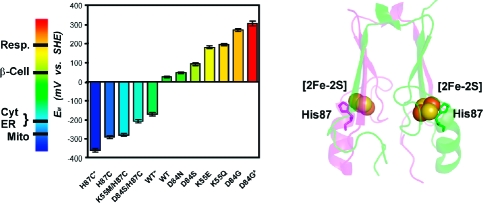
Protein backbone of the cytoplasmic exposed domain of the outer-mitochondrial membrane protein mitoNEET (PDB code 2QH7) showing the redox active [2Fe-2S] centers.(6a) MitoNEET is a homodimer, with one protomer shown in magenta and the other in green. Each protomer contains a [2Fe-2S] center (shown as spheres) coordinated by 3-Cys and 1-His, with the hallmark single-coordinating His87 indicated. The distance between the [2Fe-2S] centers is ∼16 Å from center-to-center. His87 coordinates to the outer, more solvent exposed, Fe of the [2Fe-2S] center, where the electron is predominantly localized upon reduction.
Figure 2.
EM values of WT and mutant mitoNEET have been engineered over a range of ∼700 mV and can be tuned to obtain nearly any value within the EM range shown. Measurements adjusted to SHE values, with errors (±10 mV) indicated by cross bars. *EM extremes (see Figure 3B). The EM values of several cellular environments are shown on the left bar. Abbreviations: Resp. (Respiratory tract fluid, +200 mV), β-Cell (Cytoplasm of beta cells, producers of insulin in the pancreas, +55 mV), Cyt (Cytoplasm, −205 mV), ER (Endoplasmic Reticulum, −217 mV), Mito (Mitochondria, −260 mV).(4)
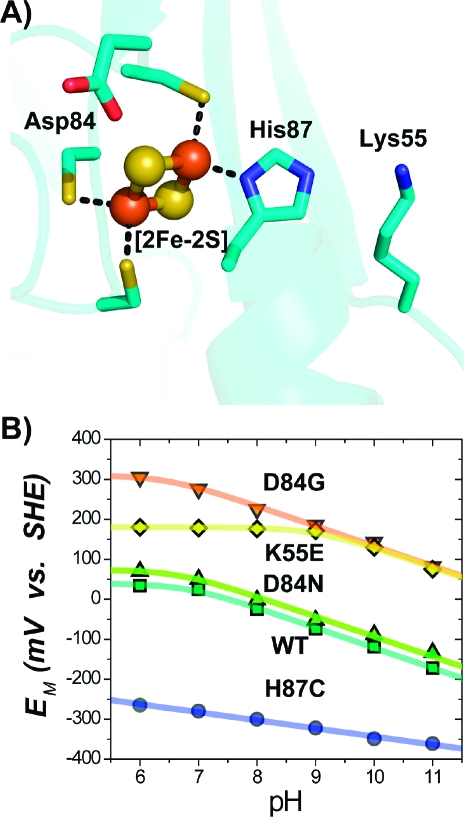
As a first step, we needed to improve our characterization of the WT. We had previously shown that the EM of WT mitoNEET is pH-dependent above neutral pH, indicating that reduction is coupled to proton uptake.7,10 Potentiometric redox titrations indicated that the [2Fe-2S] cluster of mitoNEET undergoes a one-electron reduction step: [2Fe-2S]2+/[2Fe-2S]+:H (Figure S1). At a pH just above its pKa in the oxidized state (pKox), uptake of a proton occurs upon reduction, resulting in a pH-dependence for the EM.(11) This occurs up to the point where the pH matches the pKa of the proton in the reduced state (pKred). The most likely candidate for a site of protonation in the WT mitoNEET is His87 (Figure 3A), which shows pH-dependent vibrational interactions with the [2Fe-2S] center.(12) His87 is ligated to the outermost Fe of the [2Fe-2S] center, where, upon reduction, the additional electron is predominantly localized.(13) In addition, pulsed EPR studies indicated that His87 is protonated in the reduced state.(13) At the appropriate pH, protonation of His upon reduction is observed in redox studies on Rieske type [2Fe-2S] centers that involve His coordination.14,15
Figure 3.
(A) Structure near the [2Fe-2S] center (Fe atoms as red spheres, sulfur as yellow) of mitoNEET showing both the ligating and nearby (<5 Å) titratable residues. (B) Representative pH dependences of the EM for select mutants. WT, D84G, and D84N exhibit similar dependences (−51 mV/pH) at pH ≥ 7, implying that, in these cases, reduction remains proton-coupled. H87C shows a more shallow slope (−15 mV/pH) for the pH-dependence,(10) indicating that His87 is principally responsible for the observed proton coupling in WT. Replacement of Lys55 with Glu (K55E) shifts the pKox of His87 from 6.7 ± 0.2 to 9.2 ± 0.2.
His87 will contribute to the observed proton-coupled reduction in the pH range above its pKox and below its pKred. In a previous study, detailed PFV data were fit to two models.(10) Both models included His87 as an integral player in proton coupling to electron reduction but differed in the pH range over which protonation of His87 contributed to the pH dependence. Here, we use direct UV−vis titration(16) as an independent method to determine the pH range over which His87 contributes to the proton coupling. This allows us to distinguish between the two models. We measured the UV−vis region as a function of pH, as differences in the absorption peaks are expected to reflect the state of protonation of the titrating ligand.(16) Indeed, changes in the absorbance peak position of the WT protein in the oxidized state were sensitive to pH and indicated a titration with an apparent pKa = 6.8 ± 0.2 (Figure S2A). In addition, peak changes in the reduced state indicated that the pKred was 12.4 ± 0.2 (Figure S2B). This value is consistent with values for pKred of ∼12.5 reported for the His ligands in Rieske centers.(15) The lack of spectral changes in the H87C mutant confirms the assignment of these changes to the protonation of His87. Thus, protonation of His87 is predominantly responsible for the pH-dependence of the EM over the entire range of pH measured in this study. These new data required a refinement of the previous model used to describe the pH-dependence data.(10)
In the refined model, we explicitly include His87 as a major contributor to the observed titration across the entire measured range and implicitly include other groups and pH-dependent effects in a factor α (eq S5). Fitting of the data to the model (Figure 3B) yields values of pKox = 6.7 ± 0.2 and pKred > 11.5 for His87, which is in agreement with the values determined from UV−vis pH titration, giving us confidence that the refined model provides an adequate explanation of the measured data.
We continued our mutant survey by replacing the single coordinating His ligand (His87) with Cys (Figure 3A). Initial studies showed that replacement of His87 with Cys (H87C) results in a significantly more stable protein with an EM,7 shifted from +25 mV to −290 mV, decreasing to −360 mV at pH 11.0 (Figure 3B). The recently determined crystal structure(17) (PDB ID code 3LPQ) showed that the Sγ of Cys87 in the H87C mutant replaced the Nδ of His87 in the WT as a ligand of the outer Fe of the [2Fe-2S] center, with no observed long-range structural changes. The shift to a more negative EM,7 can thus be attributed to the substitution of the neutral His with an anionic Cys ligand(17) at the 87 site. This finding was consistent with previous reports(10) and demonstrates that His87 is a critical ligand in tuning the EM.
Having established that His87 is a critical ligand in tuning the EM, we next targeted Lys55, which is located ∼4 Å from His87 (Figure 3A). Based on its close proximity to His87, along with the observed changes in the side chain conformation of Lys55 in the H87C mutant,(17) we anticipated that replacing the cationic Lys55 with neutral or negative side chains would increase the pKa of His87 and thereby the EM,7 of the mutant protein.(18) Replacement of Lys55 with the neutral Gln (K55Q) or anionic Glu (K55E) both resulted in EM,7 values of ∼ +200 mV (Figure 2). The similar EM,7 values for the K55E and K55Q mutants indicate that their predominant effect on EM,7 is caused by removal of the cationic Lys. A fit of the data to the model (eq S5) yielded a pKox of His87 in the K55E that was shifted by ∼3 pKa units to 9.2 ± 0.2 (Figure 3B). This was confirmed by optical pH titrations, which gave a value of 9.6 ± 0.2 (Figure S2). In the WT, Lys55 makes an interprotomer interaction with the hydrogen on Nε of His87. Removal of this H-bond should affect the interprotomer contact, which would have additional consequences on the stability of the reduced [2Fe-2S] centers, consistent with the unexpectedly higher EM observed even at lower pH (Figure 3B). We have shown that replacement of a charged group next to a coordinating His can dramatically affect both the pKa of the His and the EM of the [2Fe-2S] center. In the K55M/H87C double mutant, the EM,7 was −270 mV (Figure 2, Table S1), close to that of the H87C, supporting the notion that the predominant effect of Lys55 is through a pKa shift of His87, which is absent in the double mutant.
Another titratable side chain located near the [2Fe-2S] center is Asp84 (Figure 3A). Asp84 is within hydrogen bonding distance to the proximal inorganic sulfur of the [2Fe-2S] center, suggesting that Asp84 may be in the protonated state. This was confirmed by replacement with Asn (D84N), which resulted in EM values similar to the case of the WT over a pH range from 6.0 to 11.0 (Figure 3B). Similar values were obtained upon replacement with Glu (D84E) and Ser (D84S) (Figure 2, Table S1). The D84S/H87C double mutant showed that the effects of the two mutations on the EM,7 were additive (Figure 2, Table S1), which suggests that further unique EM,7 values could be obtained with double mutants utilizing sites 84 and 87.
Surprisingly, replacement of Asp84 with Gly (D84G) resulted in a much more positive EM,7 of +270 mV (Figure 2), increasing to +305 mV at pH 6.0 (Figure 3B). This is not a result of gross structural changes, as the optical spectrum of the D84G mutant is similar to that for the WT (Figure S3). However, the D84G mutation likely alters the solvent accessibility of the cluster, which has been shown to strongly affect EM,7 values in other FeS systems, such as Rieske centers.(19)
We have shown that mitoNEET is amenable to manipulation of residues located near the [2Fe-2S] centers. We were able to tune EM over a range of ∼700 mV. This system’s resultant range of EM,7 values is beyond that of any previously reported FeS protein. Combined with pH modulation, the EM of the [2Fe-2S] center can be tuned to essentially any value within a range from −360 mV to +305 mV, making it potentially useful for both physiological studies and industrial applications as a stable, water-soluble, redox agent.
Acknowledgments
We would like to thank Dr. Akif Tezcan for use of his electrochemistry equipment and expertise. We also thank Charlene Chang and Alex Navarro for their assistance with mutagenesis. This work was supported by the Heme and Blood Proteins Training Grant 5T32DK007233-34 (J.A.Z.); the GAANN training grant (2005−2006) and the CMG Grant 2T32GM007240-29 (A.R.C.); NIH Grants GM41637 (M.L.P.), NIH GM54038 and NIH DK54441 (to P.A.J.); and the Zevi Hermann Shapira Foundation (R.N.).
Supporting Information Available
We include a description of materials and methods. This includes details of pKa values determined by UV−vis spectral changes as a function of pH and fits of the EM vs pH. We also include optical redox titration data for all mutants in the main text as well as others not in the main text (Figure S1). We include direct UV−vis titrations at different pH for WT and K55E (Figure S2A, B) and UV−vis absorbance spectra of WT and the D84G (Figure S3). Cyclic voltammograms for several mutants are shown (Figure S4A−F) and the values tabulated with the potentiometric data (Table S1). A comparison of the pH-dependence profiles of WT by PFV and potentiometric titrations is included (Figure S5). This material is available free of charge via the Internet at http://pubs.acs.org.
Funding Statement
National Institutes of Health, United States
Supplementary Material
References
- a Lippard S. J.; Berg J. M.. Principles of Bioinorganic Chemistry; University Science Books: Mill Valley, CA, 1994. [Google Scholar]; b Beinert H.; Holm R. H.; Munck E. Science 1997, 277, 653–659. [DOI] [PubMed] [Google Scholar]; c Rees D. C. Annu. Rev. Biochem. 2002, 71, 221–246. [DOI] [PubMed] [Google Scholar]; d Meyer J. J. Biol. Inorg. Chem. 2008, 13, 157–170. [DOI] [PubMed] [Google Scholar]; e Fontecave M. Nat. Chem. Biol. 2006, 2, 171–174. [DOI] [PubMed] [Google Scholar]
- Marshall N. M.; Garner D. K.; Wilson T. D.; Gao Y.; Robinson H.; Nilges M. J.; Lu Y. Nature 2009, 462, 113–6. [DOI] [PMC free article] [PubMed] [Google Scholar]
- Miller A. F. Acc. Chem. Res. 2008, 41, 501–510. [DOI] [PubMed] [Google Scholar]
- Martinovich G. G.; Cherenkevich S. N.; Sauer H. Eur. Biophys. J. 2005, 34, 937–942. [DOI] [PubMed] [Google Scholar]
- Colca J. R.; McDonald W. G.; Waldon D. J.; Leone J. W.; Lull J. M.; Bannow C. A.; Lund E. T.; Mathews W. R. Am. J. Physiol. Endocrinol. Metab. 2004, 286, E252−60. [DOI] [PubMed] [Google Scholar]
- a Paddock M. L.; Wiley S. E.; Axelrod H. L.; Cohen A. E.; Roy M.; Abresch E. C.; Capraro D.; Murphy A. N.; Nechushtai R.; Dixon J. E.; Jennings P. A. Proc. Natl. Acad. Sci. U.S.A. 2007, 104, 14342–7. [DOI] [PMC free article] [PubMed] [Google Scholar]; b Hou X.; Liu R.; Ross S.; Smart E. J.; Zhu H.; Gong W. J. Biol. Chem. 2007, 282, 33242–6. [DOI] [PubMed] [Google Scholar]; c Lin J.; Zhou T.; Ye K.; Wang J. Proc. Natl. Acad. Sci. U.S.A. 2007, 104, 14640–5. [DOI] [PMC free article] [PubMed] [Google Scholar]
- Conlan A. R.; Axelrod H. L.; Cohen A. E.; Abresch E. A.; Zuris J. A.; Yee D.; Nechushtai R.; Jennings P. A.; Paddock M. L. J. Mol. Biol. 2009, 392, 143–153. [DOI] [PMC free article] [PubMed] [Google Scholar]
- Dutton P. L. Methods Enzymol. 1978, 54, 411–435. [DOI] [PubMed] [Google Scholar]
- Hirst J. Biochim. Biophys. Acta 2006, 1757, 225–239. [DOI] [PubMed] [Google Scholar]
- Bak D. W.; Zuris J. A.; Paddock M. L.; Jennings P. A.; Elliott S. J. Biochemistry 2009, 48, 10193–10195. [DOI] [PMC free article] [PubMed] [Google Scholar]
- Chen K.; Bonagura C. A.; Tilley G. J.; McEvoy J. P.; Jung Y.; Armstrong F. A.; Stout C. D.; Burgess B. K. Nat. Struct. Biol. 2002, 9, 188–192. [DOI] [PubMed] [Google Scholar]
- Tirrel T. F.; Paddock M. L.; Conlan A. R.; Smoll E. J.; Nechushtai R.; Jennings P. A.; Kim J. E. Biochemistry 2009, 48, 4747–4752. [DOI] [PMC free article] [PubMed] [Google Scholar]
- a Dicus M. M.; Conlan A.; Nechushtai R.; Jennings P. A.; Paddock M. L.; Britt R. D.; Stoll S. J. Am. Chem. Soc. 2010, 132, 2037–2049. [DOI] [PMC free article] [PubMed] [Google Scholar]; b Iwasaki T.; Kounosu A.; Samoilova R. I.; Dikanov S. A. J. Am. Chem. Soc. 2009, 128, 2170–2171. [DOI] [PubMed] [Google Scholar]
- Link T. A. In Handbook of Metalloproteins; Messerschmidt A., Huber R., Poulos T., Wieghardt K., Eds.; Wiley, New York,2001; Vol. 1, pp 518−531. [Google Scholar]
- Zu Y.; Couture M. M.; Kolling D. R.; Crofts A. R.; Eltis L. D.; Fee J. A.; Hirst J. Biochemistry 2003, 42, 12400–8. [DOI] [PubMed] [Google Scholar]
- Kuila D.; Fee J. A. J. Biol. Chem. 1986, 261, 2768–2771. [PubMed] [Google Scholar]
- Conlan A. R.; Axelrod H. L.; Cohen A. E.; Abresch E. C.; Nechushtai R.; Paddock M. L.; Jennings P. A. Biophys. J. 2009, 96, 67a.18849413 [Google Scholar]
- Klingen A. R.; Ullmann G. M. Biochemistry 2004, 43, 12383–12389. [DOI] [PubMed] [Google Scholar]
- Denke E.; Merbitz-Zahradnik T.; Hatzfeld O. M.; Snyder C. H.; Link T. A.; Trumpower B. L. J. Biol. Chem. 1998, 273, 9055–9093. [DOI] [PubMed] [Google Scholar]
Associated Data
This section collects any data citations, data availability statements, or supplementary materials included in this article.


