

Abstract
Cerebral oedema or brain tissue swelling is a significant complication following traumatic brain injury or stroke that can increase the intracranial pressure (ICP) and impair blood flow. Here, we have identified a potential driver of oedema: the negatively charged molecules fixed within cells. This fixed charge density (FCD), once exposed, could increase ICP through the Donnan effect. We have shown that metabolic processes and membrane integrity are required for concealing this FCD as slices of rat cortex swelled immediately (within 30 min) following dissection if treated with 2 deoxyglucose + cyanide (2DG+CN) or Triton X-100. Slices given ample oxygen and glucose, however, did not swell significantly. We also found that dead brain tissue swells and shrinks in response to changes in ionic strength of the bathing medium, which suggests that the Donnan effect is capable of pressurizing and swelling brain tissue. As predicted, a non-ionic osmolyte, 1,2 propanediol, elicited no volume change at 2000×10−3 osmoles l−1 (Osm). Swelling data were well described by triphasic mixture theory with the calculated reference state FCD similar to that measured with a 1,9 dimethylmethylene blue assay. Taken together, these data suggest that intracellular fixed charges may contribute to the driving forces responsible for brain swelling.
Keywords: oedema, brain injury, Donnan effect
1. Introduction
In the UK, approximately 700 000 people each year are admitted to the emergency department following traumatic brain injury (TBI; Goodacre 2008). In the USA, at least 1.4 million people sustain TBI each year resulting in 50 000 deaths and 235 000 hospitalizations (Langlois et al. 2006). The public health and economic costs of treating long-term disability owing to TBI are high, motivating the study of both prevention and treatment. In previous work, we measured local mechanical properties of brain tissue and developed injury tolerance criteria for incorporation into computational models of TBI to aid in the development of safety systems to better mitigate TBI causation (Cater et al. 2006; Elkin & Morrison 2007; Elkin et al. 2007). However, not all TBIs can be prevented; therefore, it is also critical to study the downstream consequences of TBI responsible for delayed mortality and morbidity. Herein, we focus on the phenomenon of oedema, or brain swelling, following TBI (Unterberg et al. 2004).
Oedema is one of the most significant clinical consequences of TBI and contributes to its high rate of mortality and morbidity, particularly for those victims who survive the injury event (Werner & Engelhard 2007). Following TBI and other injuries such as a stroke, the brain may begin to take in water (Fishman 1975). However, because of the rigid nature of the cranial compartment, the tissue cannot swell, resulting in large increases in intracranial pressure (ICP), which then prevents adequate cerebral blood supply (Stocchetti et al. 2007).
The current clinical treatments for oedema include osmotic therapy with either mannitol or hypertonic saline (Berger et al. 1995; Bhardwaj 2007) and, if unresponsive to these therapies, decompressive craniotomy (Hutchinson et al. 2007). Osmotic therapy, while often useful in lowering ICP, is not always successful (Raslan & Bhardwaj 2007). It is based on the assumption that a higher osmolarity in the cerebral circulation (up to 320×10−3 osmoles l−1 (Osm)) will draw water out of the brain, reducing swelling. This mechanism, however, has not yet been proven (Diringer & Zazulia 2004). With decompressive craniotomy, the mechanism of swelling is not addressed, but the brain is allowed to swell outside the cranium, maintaining blood flow to the injured brain. While this treatment has proven to be beneficial in severe, pharmacologically intractable cases (Olivecrona et al. 2007), it is extremely invasive. A more complete understanding of the etiology of oedema may advance the development of more effective treatments.
Brain oedema following TBI has traditionally been subdivided into three major categories: vasogenic (Papadopoulos et al. 2005), cytotoxic (Liang et al. 2007) and interstitial oedema (Kawamata et al. 2007) (for reviews and a historical perspective, see Klatzo 1967; Fishman 1975; Unterberg et al. 2004). Indirect measures based on diffusion-weighted imaging have suggested that following TBI without blood–brain barrier (BBB) disruption or with transient BBB disruption, cytotoxic oedema is the dominant cause of persistent brain oedema (Barzo et al. 1997; Marmarou et al. 2006a). What is lacking, however, is a mechanistic description of the forces driving the flow of water intracellularly. The mechanisms responsible for oedematous swelling of the brain must be strong enough to raise the ICP to pathological levels (more than 15–20 mm Hg). Therefore, a viable mechanistic description of brain oedema must identify a source capable of generating a sustained increase in pressure of at least this magnitude.
Given that brain tissue is composed of a viscoelastic matrix (cells and little extracellular matrix), water and fixed negative charges (i.e. sulphated proteoglycans, DNA, etc.), it is reasonable to hypothesize that, in both the living and dead state, it will behave as a triphasic material (Lai et al. 1991). The triphasic theory models biological tissues as a mixture of a charged deformable porous solid matrix, a solvent and monovalent counter-ions. Brain tissue also has a relatively low permeability and has been modelled as a biphasic material (Cheng & Bilston 2007), representing a mixture of a porous deformable solid matrix and a solvent (Mow et al. 1980). However, to date, brain tissue has not been modelled as a triphasic material, which may yield important insights into its mechanical behaviour and oedematous swelling. If the solid matrix of brain tissue possesses fixed charges, then the associated fixed charge density (FCD) can contribute to increased ICP, a mechanism that can be predicted by triphasic theory.
Water movement can be driven by the Donnan osmotic pressure (Overbeek 1956; Chahine et al. 2005), which affects ion distributions in cells and body fluid compartments (Nguyen & Kurtz 2006). Intra- and extracellular ion concentrations may be predicted by the Donnan effects mediated by intracellular protein charges, intracellular FCD and balanced by the active pumping of sodium and other ions out of the cell (Simard et al. 2007; Kurbel 2008). The accumulation of ions external to the cell and negative charge fixed within the cell represents a relatively large thermodynamic potential that is discharged when the cell loses its membrane integrity (Tomita & Gotoh 1992). A similar effect occurs when ion transporters are no longer capable of maintaining the thermodynamic potential within cells (Tomita et al. 1988; Tomita & Gotoh 1992). Tomita and Gotoh were the first to identify this thermodynamic potential as producing a large enough osmotic pressure to be capable of causing significant cell and tissue swelling after cell-membrane permeabilization owing to damage; however, they failed to identify the mechanism by which this pressurization occurred.
We hypothesize that disruption of this thermodynamic potential results in massive cell swelling owing to the exposure of intracellular FCD, and that this is one of the primary drivers of brain oedema. Despite the presence of ionic leak currents, cells maintain a negative membrane potential through adenosine triphosphate (ATP)-dependent pumps, which counteract the leak of ions into the cell, pumping an equal number of ions out of the cell. When a cell loses its ability to maintain this equilibrium, ions will rush into the cell to balance both chemical and electrical gradients. Membrane voltage will dissipate to zero, however, ion concentration will not equilibrate between the intracellular and extracellular space. At equilibrium, an excess of cations will be located within the cell to neutralize the strong and immobile negative charges present on the FCD. This excess of cations will increase the osmolarity and thus the osmotic pressure within the cell relative to outside the cell according to the Donnan effect (Overbeek 1956; Chahine et al. 2005). This increased osmotic pressure will drive water into the cell, swelling and pressurizing the intracellular matrix in an attempt to balance the Donnan osmotic pressure. Even cells without an intact membrane can still swell owing to expansion of the intracellular matrix. The intracellular space can be modelled as a hydrogel where the cytosol permeates a matrix (cytoskeleton, organelles, etc.; Albro et al. 2007). We postulate that this intracellular matrix also contains fixed negatively charged molecules. It is this matrix that swells when the cellular membrane is compromised. The cellular membrane is not required for retention of water in the cell.
Brain oedema is a multi-scale problem. At the molecular level, under normal resting conditions, ions are transported out of the cell by ATP-dependent ionic pumps, and the flux is sufficient to maintain homeostasis. However, upon exposure of the intracellular FCD, positive counter-ions are attracted to neutralize the charge. At the cellular level when the pumps fail, this increased internal ion concentration brings with it obligated water, which swells the cell in a thermodynamically driven process to restore electro-osmotic equilibrium. The cellular cytoskeleton may hypothetically counteract some of this swelling, but, in reality, its tensile modulus is too low relative to the driving pressures to produce much resistance (Lu et al. 2006). At the macroscopic tissue level, cells swell into the extracellular space until it is filled. As the cells continue to swell, either the tissue as a whole swells, as in the case of a craniotomy, or ICP increases if the swelling is impeded by the rigid cranium, inducing life-threatening ischaemia.
The specific aim of this study is to show that cells in the brain contain an FCD that, once exposed, causes brain tissue to swell and behave as a triphasic material. We present experimental results of the swelling behaviour of rat brain in vitro under conditions that inhibit metabolic function and disrupt the cell membrane to show that both are required for masking the intracellular FCD and maintaining normal tissue volume. Once the tissue had died and swelled to equilibrium, volume change was monitored following exposure to different bath osmolarities. Volume change was then fitted to theoretical predictions based on triphasic mixture theory. The good agreement between the data and theory was consistent with our hypothesis that the FCD within cells, once exposed, can drive increases in ICP. The ability of this model to predict the swelling behaviour of the tissue indicates that triphasic mixture theory may be applied to the description of forces driving swelling in the brain.
2. Methods
(a). Tissue preparation
Brains were removed from adult (282±12 g) Sprague Dawley rats from which a strip of cortex was dissected and placed in a dish of Gey’s salt solution supplemented with 10 mM d-glucose (Sigma). Slices of the cortex (350 μm thick) were generated on a McIlwain tissue chopper (Harvard Apparatus). White matter and meninges were cut from each slice, leaving rectangular pieces of cortex with approximate dimensions of 3×1.5×0.35 mm.
(b). Volume measurement
Slices were imaged on an inverted microscope (Olympus IX71) using fibre-optic side lighting and a custom-built reflector at a 45° angle (figure 1a). The resultant image included two orthogonal views of both the area and thickness of the slice (figure 1b). Volume was calculated as the product of the area and the thickness of the slice measured manually in ImageJ (NIH).
Figure 1.

(a) Schematic of the experimental set-up to image slice area and thickness simultaneously. Shaded area, tissue; large-dashed line, area; small-dashed line, thickness. (b) Representative image of an acute slice. Scale bar, 1 mm.
(c). Live and poisoned tissue swelling
Upon dissection, slices were immediately placed in Gey’s salt solution supplemented with either 10 mM d-glucose (‘control’), 10 mM d-glucose and 0.5 per cent Triton X-100 (‘Triton’) or 10 mM 2-deoxyglucose (2DG) and 5 mM sodium cyanide (CN) (‘2DG+CN’; all reagents from Sigma) and bubbled vigorously with oxygen. Slices were maintained at 37°C. Slice volume was measured immediately following dissection (0 min) and at 30, 60 and 120 min following dissection. After 120 min, oxygen was removed, and the slices were allowed to swell at room temperature for 24 h when volume was measured one final time.
(d). Effect of changes in ionic and non-ionic osmolarity
Tissue that had been exposed to 2DG+CN for at least 3 h and had been allowed to swell to equilibrium for at least 24 h was imaged to calculate a baseline volume in isotonic Gey’s salt solution (no glucose). The bathing solution was changed to either hypotonic (300 mOsm Gey’s salt solution diluted to 200 mOsm with ddH2O), isotonic (300 mOsm Gey’s salt solution) or hypertonic solutions (300 mOsm Gey’s salt solution supplemented with NaCl to 1, 2 or 4 Osm NaCl or 300 mOsm Gey’s salt solution supplemented with KCl to 2 Osm). After 3 h at room temperature in the new solution, slice volume was measured. The same experiment was repeated for a second set of slices for which the bathing solution was changed to hyperosmotic solutions consisting of isotonic Gey’s salt solution supplemented with either 1,2-propanediol to 2 Osm or d-mannitol to 1 Osm (Sigma). Slice volume was again measured after 3 h of incubation at room temperature.
(e). Water content
After the final imaging time point, water content of the brain slices was measured. The wet weight/dry weight method was used to calculate per cent water content using the following equation (Shigemori et al. 2006):
 |
2.1 |
(f). 1,9 dimethylmethylene blue assay
FCD was measured using a standard 1,9 dimethylmethylene blue (DMMB) assay following digestion of dried tissue overnight at 37°C in papain digest buffer (0.1 M sodium acetate buffer, pH 5, containing 5mM EDTA, 5 mM cysteine HCl and 2 U papain ml−1; Farndale et al. 1982). FCD, cF, for different tonicity groups (200, 300 and 2000 mOsm) was calculated from the following equation:
| 2.2 |
where Z is the total charge (in units of equivalents (Eq), where 1 Eq of a substance is the unit molarity times the charge number of the substance) in the sample measured by the DMMB assay and ‘tissue water’ is the volume of water measured for the sample using equation (2.1).
(g). Triphasic mixture theory and fixed charge density calculation
The total mixture stress, σ, was calculated assuming that the solid matrix can be described with isotropic Fung elasticity (Azeloglu et al. 2008; Ateshian & Costa 2009)
| 2.3 |
where p represents the fluid pressure, B is the left Cauchy–Green tensor measured from the reference state that corresponds to a hypertonic (4000 mOsm) salt-bath concentration, λs and μs represents the Lamé coefficients of the solid matrix (calculated from the Young modulus of 350 Pa and Poisson’s ratio ν = 0.35 as given by Cheng & Bilston (2007)),  is the relative volume and
| 2.4 |
where c is a material coefficient with units of stress. Under free-swelling boundary conditions (σ=0), this equation produces a homogeneous isotropic strain field, B=λ2I, where λ is the isotropic stretch; thus the current volume relative to the reference state at 4000 mOsm is given by J=λ3. The corresponding interstitial fluid pressure is given by
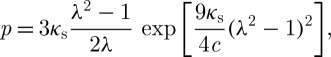 |
2.5 |
where κs=λs+2μs/3 is the bulk modulus of the solid matrix in the limit of small strains. According to Donnan equilibrium theory, this interstitial pressure should also be equal to
| 2.6 |
where  is the osmolarity of the external bath, R is the universal gas constant and T is the absolute temperature. Recognizing that cF varies with tissue swelling according to
 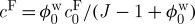 , where
  and
and  represent the FCD and volume fraction of tissue water in the reference state, these equations combine to produce
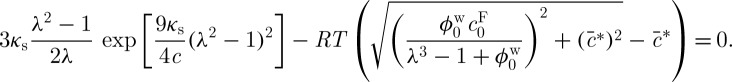 |
2.7 |
The stretch, λ=J1/3, calculated from the ratio of the current volume relative to the reference volume for different bath osmolarities  was fitted to equation (2.7) to estimate
  and the material parameter c using the Matlab function ‘lsqcurvefit’.
(h). Statistical analysis
All statistical analyses were performed using SPSS (SPSS, Inc.). A two-way ANOVA was performed to examine the effect of time and experimental treatment (2DG+CN, Triton and control) on tissue volume measured at 0, 30, 60, 120 and 24 h following dissection. Bonferroni post-hoc tests were performed on each experimental group within each time point and on each time point within each experimental group. The effect of ionic as well as non-ionic osmolarity on volume change for dead brain tissue was determined with a one-way ANOVA followed by Bonferroni post-hoc tests. The effect of ionic osmolarity on tissue water content and FCD content was also determined with a one-way ANOVA followed by Bonferroni post-hoc tests. For all tests, a p-value of less than 0.05 was considered statistically significant.
3. Results
Figure 1a is a schematic of the experimental setup for imaging slices to perform volume measurements. All illumination was from the side and was reflected down towards the objective by a reflective surface fixed at a 45° angle. Both slice area and slice thickness were imaged simultaneously and in the same plane, since their focal distances were approximately equal. The slice volume was calculated from the resultant image (figure 1b), as described above.
We first determined the degree to which metabolic activity was required for volume regulation. The temporal progression of relative volume change of slices exposed either to (i) electron transport chain decouplers with glucose deprivation (2DG+CN), (ii) cell membrane damaging detergent (Triton), or (iii) ample oxygenation and glucose supplementation (control) was determined (figure 2). The 2DG+CN and Triton treated groups swelled more rapidly than the control group. The control group swelled slightly over the 120 min time course, but this swelling was not significant (p>0.05 for all time points, except for after 24 h). The volumes of poisoned slices were significantly greater than control slices at 30, 60 and 120 min after dissection (p<0.01). After 24 h without oxygen, all groups had swelled to the same degree (p=0.80) with an average relative volume increase of 77±5 per cent.
Figure 2.

(a) Change in volume following dissection during incubation at 37°C with oxygenation for the first 120 min and (b) followed by incubation at room temperature in glucose-free salt solution until the 24 h time point (no significant difference between treatments after 24 h, p= 0.80). All data presented as mean ± s.e.m. (a) Solid line with filled triangle, 2DG + CN; dashed line with filled circle, Triton; thin bars with filled square, control.
We next determined whether the volume of dead tissue was dependent on the ionic strength of the extracellular bath without the confounding factor of active metabolic processes. Figure 3a reports changes in slice volume of dead tissue after 3 h incubation in bathing solutions of different ionic osmolarity. Before the start of the experiments, these slices were poisoned with 2DG+CN and allowed to swell to equilibrium for 24 h in isotonic salt solution. Slice volume did not change over the 3 h experiment for the isotonic control group (figure 3a). The volumes of the groups challenged with hypertonic ionic solutions all decreased significantly compared with the slices in isotonic solution (figure 3a). There were no significant differences between the hypertonic groups. In contrast, tissue volume increased significantly for both groups exposed to hypotonic ionic solutions as compared with the isotonic control (p<0.05). The group exposed to 6 mOsm swelled to a significantly greater extent than that exposed to the 200 mOsm solution (p<0.01). The change in tissue volume was not dependent on the identity of the monovalent cation used to increase the bath osmolarity, as 2000 mOsm of either NaCl or KCl affected the tissue volume to the same degree (p=0.94, figure 3b). Changes in water content correlated with changes in volume, with tissue exposed to 2000 mOsm salt solution exhibiting the lowest water content and tissue exposed to 200 mOsm salt solution exhibiting the highest water content (R2=0.97; figure 3c).
Figure 3.

(a–b) Change in volume and (c) water content of dead slices of tissue after 3 h exposure to bathing solutions of different ionic osmolarity. Hypertonic groups all shrank significantly (p<0.05) and hypotonic groups all swelled significantly (p<0.05; (a)). The shrinking effects of adding NaCl or KCl were not significantly different (p=0.94; (b)). All changes in water content were significantly different (p< 0.01) and correlated to changes in volume (R2=0.97; (c)). All data presented as mean ± s.e.m.
To test whether tissue volume change was dependent on the polarity of the osmolyte, slices were incubated in solutions of non-ionic osmolytes in isotonic Gey’s salt solutions (figure 4a). Slices in hypertonic 1,2 propanediol solution (2000 mOsm) did not change volume compared with isosmotic controls (p=1). Hypertonic d-mannitol (1000 mOsm) caused the tissue to shrink significantly by 14 per cent (p<0.01).
Figure 4.

Change in volume of dead slices of brain tissue after 3 h exposure to hyperosmotic bathing solutions of different non-ionic molecular species (2000 mOsm 1,2 propanediol; 1000 mOsm d-mannitol) (asterisk denotes p<0.05, compared with control). All data presented as mean ± s.e.m.
The FCD, as measured with the DMMB assay, is shown in figure 5a for tissue poisoned for 24 h and then assayed after 3 h exposure to different ionic osmolarity solutions supplemented with NaCl (200, 300 and 2000 mOsm). The FCD decreased with decreasing osmolarity, reflecting the increases in volume and water content of the tissue. The free swelling strain induced in the tissue by incubation in baths of different ionic osmolarity is plotted as a function of the bath osmolarity (figure 5b). The line is the best fit of equation (2.7) obtained by varying two parameters:  , the tissue reference state FCD and c, a nonlinear material parameter. The fit resulted in a reference state FCD of 5.88±1.25 mEq l−1 and a nonlinear material parameter of 26.5±3.6 Pa.
Figure 5.

(a) cF of dead brain tissue exposed to hypertonic (2000 mOsm), isotonic (300 mOsm) and hypotonic (200 mOsm) ionic solutions for 3 h measured with a DMMB assay (asterisk denotes p<0.05). (b) Curve fit of swelling results to estimate  from zero stress state for equation (2.7).
  mEq l−1. All data presented as mean ± s.e.m.
4. Discussion
Our study was motivated by a need to identify the thermodynamic driving forces that may be responsible for increased ICP following central nervous system trauma. Many studies have identified and characterized ion channels (Liang et al. 2007), water channels (Marmarou 2007) and the pathological responses to injury (Mongin 2007) that may contribute to cell swelling. Those studies, however, identify facilitators of oedema formation that control the rate of swelling. Their inhibition can diminish the extent of injury by slowing the rate of water flux, allowing endogenous compensatory mechanisms to recover and rescue injured tissue (Jayakumar et al. 2008). Herein, we are building on these concepts by describing the drivers of cell swelling. A more complete understanding of the multi-scale biothermomechanical swelling behaviour of brain tissue that better identifies the drivers responsible for the swelling, and hence potential therapeutic targets, could lead to the development of improved treatments for oedematous brain.
Following severe TBI, regions containing necrotic tissue swell and compress the cerebral vasculature such that blood cannot flow to many parts of the brain (Katayama & Kawamata 2003; Kawamata & Katayama 2006). Diffuse damage or a stroke may also result in diffuse swelling of the brain, but in all cases, swollen regions are associated with dead, dying or damaged cells (Kawamata et al. 2007). Imaging studies have identified cytotoxic swelling as the most probable cause of this oedema (Vorisek et al. 2002; Maeda et al. 2003; van Pul et al. 2005; Marmarou et al. 2006b; Kuroiwa et al. 2007).
A proposed mechanism of oedema should be capable of generating increases in ICP that are comparable to those measured clinically. One mechanism often cited is the collapse of the transmembrane electrochemical potential owing to depletion of cellular energy stores and failure of ion pumps (Liang et al. 2007). However, collapse of the gradient alone would result in equilibration of ion concentrations within the intracellular and extracellular compartments, but would not result in the net uptake of water into the tissue. Hence, there must be some other driver for the uptake of water.
We hypothesized that an FCD, which is the main tenet of triphasic mixture theory, resides within the intracellular space. In contrast to negatively charged organic ions, which diffuse within the intracellular space, we postulated that a significant portion of the intracellular charge is actually fixed within the cell. The implication is that, even when the plasma membrane is compromised, these osmolytes may not be able to diffuse freely into the extracellular space. Normally, under resting physiologic conditions, this fixed charge is masked by the cell membrane and ion pumps, which counter the leak current of positive ions (mostly the ATP-dependent Na+/K+ pump; Kurbel 2008). Osmotic balance and electroneutrality are satisfied by the concentrations of ions, uncharged osmolytes and the negatively charged molecules, which are either fixed within the cell or not capable of penetrating the cell membrane (Hoffmann et al. 2009). When the cell membrane is compromised or when energy resources are depleted, as in TBI, this balance is disrupted and the fixed negative charge drives an influx of positive ions into the damaged cells/tissue (Tomita & Gotoh 1992). As secondary injury cascades progress and more cells begin to die, more FCD will be exposed and ICP will continue to increase. This increase in pressure will continue for as long as intracellular contents are being exposed to the extracellular space, a process that may continue for hours and even days following injury (Stocchetti et al. 2007).
At the molecular level, the exposed FCD generates a Donnan osmotic pressure (Overbeek 1956; Chahine et al. 2005) within the cell that draws in positive ions to neutralize its charge. The induced osmotic potential between the matrix and the bath draws water into the matrix to equilibrate the potential, resulting in significant swelling of the cell and tissue. The net effect is cytotoxic swelling followed by tissue pressurization after the compaction of the extracellular space. The brain may be especially susceptible to this type of swelling owing to exposure of intracellular FCD because of its high cellular content and low elastic modulus (Elkin et al. 2007) that does little to counteract the swelling pressure. This type of swelling does not require a systemic circulation nor a proteinaceous plasma as others have shown that brain, when removed from the skull and left in isotonic (approx. 300 mOsm) salt solutions (artificial cerebrospinal fluid, physiologic saline, etc.) swells (Fishman et al. 1977; Tomita et al. 1979; Osada et al. 2006). Rather, the only requirement is an FCD and an isotonic buffer containing salts.
We also found that slices of the rat cortex swell over time in isotonic medium (figure 2a). Slices supplied with oxygen and glucose (control) did not swell appreciably following dissection. The use of thin brain slices (350 μm) is crucial to maintaining sufficient oxygen diffusion into the centre of the slice, as thicker slices have been used as models of ischaemia owing to insufficient oxygen transport to their centre (Hrabetova et al. 2002). At 2 h, control slices had swollen only to 10 per cent, most probably owing to swelling of the cells on the surfaces damaged during dissection. With sufficient oxygenation and energy supply, the interior cells were capable of maintaining their volume by pumping ions, especially Na+, out of the cell. In our experiments, when ATP production was inhibited by CN, an electron transport chain decoupler (Pombo et al. 1997), and 2DG, an inhibitor of anaerobic respiration, the tissue swelled because pumping slowed or ceased. When membrane integrity was disrupted with Triton X-100, the tissue swelled because ionic pumps were not capable of counteracting the rapid influx of ions. The slices in the 2DG+CN and Triton groups immediately began to swell, exhibiting a significant increase in volume of 27 per cent within the first 30 min (figure 2a). Both ‘poisoned’ groups continued to swell over the following 90 min, the 2DG+CN and Triton groups increasing in volume by 59 per cent and 41 per cent, respectively (figure 2a).
After 24 h in isotonic Gey’s solution without oxygen or glucose, all groups swelled by the same degree, regardless of prior treatment, to approximately 1.8 fold (figure 2b). This swelling represented the equilibrium state, as no additional swelling was observed at later time points (48 h, data not shown). Therefore, the amount of swelling was independent of the cause of cell death. Nor did swelling require activation of signalling cascades, expression of new proteins or infiltration of inflammatory cells. This amount of total swelling was consistent with that reported previously (Fishman et al. 1977). The swelling magnitude suggests that the same forces driving the swelling may be capable of pressurizing the tissue and raising ICP when confined within the rigid skull.
To test whether swelling was caused by an exposure of an FCD that becomes exposed when cells die, the behaviour of the dead tissue was characterized in response to specific environmental manipulations. A triphasic mixture material is predicted to swell and shrink passively in response to changes in ion concentration in the bathing solution, as shown in figure 3a (Lai et al. 1991). Exposure to hypertonic solution induced tissue shrinkage; exposure to hypotonic solution induced tissue swelling; a change of isotonic solution induced no change. The type of salt used, either NaCl or KCl, did not alter tissue response (figure 3b). This is an important finding that illustrates the lack of molecular species specificity and only a requirement that the osmolyte be a small cation. Also, it reinforces that the cells are dead and that the swelling is not driven by an active cell process. Living brain cells would have responded very differently to hypertonic KCl compared with hypertonic NaCl (Ware et al. 2005; Neprasova et al. 2007). Water content was also measured following 3 h exposure to hypotonic (200 mOsm), isotonic (control) or hypertonic (2000 mOsm) solutions. Water content changes correlated with volume changes: hypotonic exposure increased water content and volume, whereas hypertonic exposure decreased water content and volume compared with controls (figure 3c). This suggests that volume changes were caused by influx or efflux of water pursuant to the net movement of ions.
To further test whether the FCD was the principal driving force behind swelling, the tissue was exposed to a non-ionic osmolyte. Volume change of a triphasic material is the result of obligated water moving to neutralize the osmotic potential between the charge-neutralized FCD and the bath, i.e. the Donnan effect (Overbeek 1956; Chahine et al. 2005). A non-ionic osmolyte should have no effect on the volume because it does not interact with the FCD. High concentrations of 1,2 propanediol, a small non-ionic molecule that readily penetrates cells and tissues (Arnaud & Pegg 1990), elicited no volume change at 2000 mOsm, substantiating the importance of the FCD interaction with cations.
d-mannitol, a sugar alcohol used in treating elevated ICP (Bhardwaj 2007), shrank the tissue by 14 per cent. The effect of d-mannitol on tissue volume could be explained by its brain tissue partition coefficient that describes the ratio of osmolyte concentration in the bathing media to inside the tissue. Partition coefficients less than unity would result in a higher concentration of the osmolyte outside the tissue, creating a negative osmotic gradient between tissues and bathing solution. Similar results for solutions of hypertonic mannitol have been observed in slices of the hippocampus (Marchi et al. 2009), which suggests that the partition coefficient of mannitol in brain is less than unity. 1,2 propanediol has a cytoplasmic partition coefficient not statistically different than unity, which suggests that it would not affect the volume of the tissue as we have found here.
To measure the FCD remaining in dead slices of tissue after 24 h, we used a standard DMMB assay for sulphated glycosaminoglycans (GAGs; Farndale et al. 1982). This assay has been used with success to measure FCD values for comparison with FCD predictions in tissues modelled as triphasic mixture materials, such as cartilage and aorta (Lu et al. 2007; Azeloglu et al. 2008). While GAGs may not represent the entirety of the FCD found within brain (other contributions may come from negatively charged DNA, proteins and matrix molecules), there is a significant amount of different sulphated proteglycans in brain, the majority of which contain chondroitin sulphate (Margolis et al.1975, 1976; Jenkins & Bachelard 1988; Lander 1993; Koppe et al. 1997; Costa et al. 2007). Much of this sulphated GAG, especially at later stages of development, has been localized within the cytoplasm of neurons and astrocytes (Margolis et al. 1979; Alvarado & Castejon 1984; Aquino et al. 1984; Sames & Hoyer 1992). GAG content measured with the DMMB assay for dead tissue exposed to different ionic solutions (200, 300, 2000 mOsm) was converted to FCD using equation (2.2) (figure 5a). As was expected, FCD decreased with decreasing bath osmolarity, which reflected the change in tissue volume. Given the FCD measured with the DMMB assay of 2.32 mEq l−1 in the isotonic tissue swollen by 78 per cent, the FCD in vivo was estimated to be approximately 4 mEq l−1.
To further determine whether the swelling behaviour of dead rat brain tissue could be modelled as a mixture material, equation (2.7) was used to predict free-swelling volume change (J−1) as a function of ionic osmolarity (figure 5b; Lai et al. 1991; Azeloglu et al. 2008; Ateshian & Costa 2009). The reference state was considered to be the 4000 mOsm hypertonic group. All stretch ratios were calculated relative to this group. A least squares fit was performed for the reference state FCD,  , and nonlinear material parameter, c. The model was capable of capturing the swelling behaviour of the tissue (figure 5b), suggesting that the triphasic mixture model may be appropriate for describing the swelling and pressurization of brain tissue. The free parameter
  , the FCD in the reference state at 4000 mOsm, was calculated from a least squares fit to be 5.88±1.25 mEq l−1, slightly higher than that measured for the 2000 mOsm group with the DMMB assay (3.06±0.32 mEq l−1). This slightly higher value may reflect the volume difference between the 4000 and 2000 mOsm; however, this volume difference was not significant (figure 3a). Another explanation is that the DMMB assay may not be measuring all sources of FCD other than sulphated GAGs. Other charge sources would still contribute to the Donnan osmotic potential and may explain the larger value for the FCD found from the fit to data from actual swelling experiments. The estimated FCD given above for the reference state (4000 mOsm) for dead tissue corresponds to an FCD for tissue in vivo of 8.88 mEq l−1.
One limitation of this study was that volume change was assumed to be purely dilatational and that strains were equal in each principal direction. This assumption follows from the fact that cortical brain tissue can be considered an isotropic material (Prange & Margulies 2002). Fluid pressure was also considered to be entirely caused by the Donnan osmotic pressure given by equation (2.6) (Overbeek 1956; Chahine et al. 2005; Wang et al. 2007). The chemical expansion stress described by Lai et al. (1991) was ignored, given the relatively low concentration of FCD. In addition, mechanical properties of the intrinsic matrix of brain tissue used in equation (2.3) were taken from the only constitutive model with mixture material parameters generated for brain (Cheng & Bilston 2007). Differences in species and brain region between that study and the one presented here may have affected the determination of  using equation (2.7).
We have shown that freshly dissected brain tissue will swell at different rates depending on cell health, but that ultimate swelling volume is due to a thermodynamic equilibrium swelling processes. We have also shown that dead tissue possesses an FCD that is pressurized based on the principles of Donnan equilibrium. This FCD may represent the driving force behind brain tissue swelling. However, at physiological temperature and isotonicity, this FCD would contribute to a Donnan osmotic pressure of only approximately 2.6 mm Hg, which is not sufficient to generate pathological levels of ICP. One potential explanation for the discrepancy is that some of the negative charge within cells is not necessarily fixed, but rather hindered such that when the cellular membranes were compromised, this hindered charge density slowly diffused out of the tissue. It would not be unreasonable to assume that these soluble, large molecules cannot easily diffuse out of damaged and necrotic tissue since diffusion coefficients for most molecules, even sodium, are significantly reduced in post-mortem brain relative to living brain (Goodman et al. 2005). Also, following TBI, increases in proteoglycan production have been reported (Asher et al. 2000; Sherman & Back 2008). The effect could exacerbate oedema in the chronic phase by increasing the FCD in the injured brain (Lai et al. 1991; Sun et al. 2004; Wang et al. 2008).
These concepts may be most applicable to developing treatments for severe trauma where large regions of cell death exist. These regions, which often include large portions of necrotic tissue, strongly contribute to the rises in ICP following trauma. Currently, the most effective treatment in such cases is to evacuate the necrotic region (Kawamata & Katayama 2006). Osmolarity in necrotic brain tissue sampled from central areas of contusion or from regions affected by severe ischaemia was reported to be extremely high (Hatashita et al. 1990; Katayama & Kawamata 2003), and much of this change comes from the net influx of cations into the necrotic regions (Yates et al. 1975; Young et al.1986, 1987), supporting the Donnan pressurization hypothesis. Necrotic tissue and brain tissue homogenate exert osmotic pressures (relative to isotonic media) of 184 and 213 mm Hg, respectively, owing to the exposure of the intracellular contents (Tomita et al.1979, 1988). These pressures represent a significant driving force for tissue swelling that are not observed in the living brain, but which are exposed upon cell death.
Other cytotoxic swelling mechanisms discussed in the literature remain important for describing the progression of oedema, especially in damaged but not dead cells. Facilitators of oedema, such as aquaporins, which increase permeability of the cell membrane, magnify the effect of the drivers and the rate of swelling. Treatments directed to inhibiting these channels have shown some benefit (Amorini et al. 2003; Marmarou 2007; Taya et al. 2008) and should be considered an essential element to effective treatments. However, a full description of the driving forces against which they are meant to protect will be crucial for developing other appropriately targeted treatments, especially when dealing with necrotic tissue that can no longer maintain cellular integrity regardless of the aquaporin expression, for example. To identify the drivers and their tractability as therapeutic targets, future studies will need to better characterize these negatively charged molecules, including their diffusion capabilities within the cytoplasm and extracellular space, their charge interactions and their expression patterns.
Acknowledgements
The authors would like to thank Gerard A. Ateshian for help with constitutive modelling and useful discussions, Vikrum A. Thimmappa for help with tissue-slice imaging and Michael B. Albro for useful discussions. This work was supported by a Natural Sciences and Engineering Research Council of Canada (NSERC) postgraduate scholarship (BSE).
All animal procedures were approved by the Columbia University Institutional Animal Care and Use Committee (IACUC).
Footnotes
One contribution of 9 to a Theme Issue ‘Multi-scale biothermal and biomechanical behaviours of biological materials’.
References
- Albro M. B., Chahine N. O., Caligaris M., Wei V. I., Likhitpanichkul M., Ng K. W., Hung C. T., Ateshian G. A. Osmotic loading of spherical gels: a biomimetic study of hindered transport in the cell protoplasm. J. Biomech. Eng. 2007;129:503–510. doi: 10.1115/1.2746371. ( ) [DOI] [PMC free article] [PubMed] [Google Scholar]
- Alvarado M. V., Castejon H. V. Histochemical demonstration of cytoplasmic glycosaminoglycans in the macroneurons of the human central nervous system. J. Neurosci. Res. 1984;11:13–26. doi: 10.1002/jnr.490110103. ( ) [DOI] [PubMed] [Google Scholar]
- Amorini A. M., Dunbar J. G., Marmarou A. Modulation of aquaporin-4 water transport in a model of TBI. Acta Neurochir. Suppl. 2003;86:261–263. doi: 10.1007/978-3-7091-0651-8_56. [DOI] [PubMed] [Google Scholar]
- Aquino D. A., Margolis R. U., Margolis R. K. Immunocytochemical localization of a chondroitin sulfate proteoglycan in nervous tissue. II. Studies in developing brain. J. Cell Biol. 1984;99:1130–1139. doi: 10.1083/jcb.99.3.1130. ( ) [DOI] [PMC free article] [PubMed] [Google Scholar]
- Arnaud F. G., Pegg D. E. Permeation of glycerol and propane-1,2-diol into human platelets. Cryobiology. 1990;27:107–118. doi: 10.1016/0011-2240(90)90002-L. ( ) [DOI] [PubMed] [Google Scholar]
- Asher R. A., et al. Neurocan is upregulated in injured brain and in cytokine-treated astrocytes. J. Neurosci. 2000;20:2427–2438. doi: 10.1523/JNEUROSCI.20-07-02427.2000. [DOI] [PMC free article] [PubMed] [Google Scholar]
- Ateshian G. A., Costa K. D. A frame-invariant formulation of Fung elasticity. J. Biomech. 2009;42:781–785. doi: 10.1016/j.jbiomech.2009.01.015. ( ) [DOI] [PMC free article] [PubMed] [Google Scholar]
- Azeloglu E. U., Albro M. B., Thimmappa V. A., Ateshian G. A., Costa K. D. Heterogeneous transmural proteoglycan distribution provides a mechanism for regulating residual stresses in the aorta. Am. J. Physiol. Heart Circ. Physiol. 2008;294:H1197–H2205. doi: 10.1152/ajpheart.01027.2007. ( ) [DOI] [PubMed] [Google Scholar]
- Barzo P., Marmarou A., Fatouros P., Hayasaki K., Corwin F. Contribution of vasogenic and cellular oedema to traumatic brain swelling measured by diffusion-weighted imaging. J. Neurosurg. 1997;87:900–907. doi: 10.3171/jns.1997.87.6.0900. ( ) [DOI] [PubMed] [Google Scholar]
- Berger S., Schurer L., Hartl R., Messmer K., Baethmann A. Reduction of post-traumatic intracranial hypertension by hypertonic/hyperoncotic saline/dextran and hypertonic mannitol. Neurosurgery. 1995;37:98–107. doi: 10.1097/00006123-199507000-00015. ( ) [DOI] [PubMed] [Google Scholar]
- Bhardwaj A. Osmotherapy in neurocritical care. Curr. Neurol. Neurosci. Rep. 2007;7:513–521. doi: 10.1007/s11910-007-0079-2. ( ) [DOI] [PubMed] [Google Scholar]
- Cater H. L., Sundstrom L. E., Morrison B., III Temporal development of hippocampal cell death is dependent on tissue strain but not strain rate. J. Biomech. 2006;39:2810–2818. doi: 10.1016/j.jbiomech.2005.09.023. ( ) [DOI] [PubMed] [Google Scholar]
- Chahine N. O., Chen F. H., Hung C. T., Ateshian G. A. Direct measurement of osmotic pressure of glycosaminoglycan solutions by membrane osmometry at room temperature. Biophys. J. 2005;89:1543–1550. doi: 10.1529/biophysj.104.057315. ( ) [DOI] [PMC free article] [PubMed] [Google Scholar]
- Cheng S., Bilston L. E. Unconfined compression of white matter. J. Biomech. 2007;40:117–124. doi: 10.1016/j.jbiomech.2005.11.004. ( ) [DOI] [PubMed] [Google Scholar]
- Costa C., Tortosa R., Domenech A., Vidal E., Pumarola M., Bassols A. Mapping of aggrecan, hyaluronic acid, heparan sulphate proteoglycans and aquaporin 4 in the central nervous system of the mouse. J. Chem. Neuroanat. 2007;33:111–123. doi: 10.1016/j.jchemneu.2007.01.006. ( ) [DOI] [PubMed] [Google Scholar]
- Diringer M. N., Zazulia A. R. Osmotic therapy: fact and fiction. Neurocrit. Care. 2004;1:219–233. doi: 10.1385/NCC:1:2:219. ( ) [DOI] [PubMed] [Google Scholar]
- Elkin B. S., Morrison B. Region-specific tolerance criteria for the living brain. Stapp. Car Crash J. 2007;51:127–138. doi: 10.4271/2007-22-0005. [DOI] [PubMed] [Google Scholar]
- Elkin B. S., Azeloglu E. U., Costa K. D., Morrison B. Mechanical heterogeneity of the rat hippocampus measured by atomic force microscope indentation. J. Neurotrauma. 2007;24:812–822. doi: 10.1089/neu.2006.0169. ( ) [DOI] [PubMed] [Google Scholar]
- Farndale R. W., Sayers C. A., Barrett A. J. A direct spectrophotometric microassay for sulfated glycosaminoglycans in cartilage cultures. Connect. Tissue Res. 1982;9:247–248. doi: 10.3109/03008208209160269. [DOI] [PubMed] [Google Scholar]
- Fishman R. A. Brain edema. N. Engl. J. Med. 1975;293:706–711. doi: 10.1056/NEJM197510022931407. [DOI] [PubMed] [Google Scholar]
- Fishman R. A., Reiner M., Chan P. H. Metabolic changes associated with \hboxiso-osmotic regulation in brain cortex slices. J. Neurochem. 1977;28:1061–1067. doi: 10.1111/j.1471-4159.1977.tb10669.x. ( ) [DOI] [PubMed] [Google Scholar]
- Goodacre S. Hospital admissions with head injury following publication of NICE guidance. Emerg. Med. J. 2008;25:556–557. doi: 10.1136/emj.2007.055723. ( ) [DOI] [PubMed] [Google Scholar]
- Goodman J. A., Kroenke C. D., Bretthorst G. L., Ackerman J. J., Neil J. J. Sodium ion apparent diffusion coefficient in living rat brain. Magn. Reson. Med. 2005;53:1040–1045. doi: 10.1002/mrm.20444. ( ) [DOI] [PubMed] [Google Scholar]
- Hatashita S., Hoff J. T., Salamat S. M. An osmotic gradient in ischemic brain edema. Adv. Neurol. 1990;52:85–92. [PubMed] [Google Scholar]
- Hoffmann E. K., Lambert I. H., Pedersen S. F. Physiology of cell volume regulation in vertebrates. Physiol. Rev. 2009;89:193–277. doi: 10.1152/physrev.00037.2007. ( ) [DOI] [PubMed] [Google Scholar]
- Hrabetova S., Chen K. C., Masri D., Nicholson C. Water compartmentalization and spread of ischemic injury in thick-slice ischemia model. J. Cereb. Blood Flow Metab. 2002;22:80–88. doi: 10.1097/00004647-200201000-00010. ( ) [DOI] [PubMed] [Google Scholar]
- Hutchinson P., Timofeev I., Kirkpatrick P. Surgery for brain edema. Neurosurg. Focus. 2007;22(5) doi: 10.3171/foc.2007.22.5.15. ( ) [DOI] [PubMed] [Google Scholar]
- Jayakumar A. R., Rao K. V., Panickar K. S., Moriyama M., Reddy P. V., Norenberg M. D. Trauma-induced cell swelling in cultured astrocytes. J. Neuropathol. Exp. Neurol. 2008;67:417–427. doi: 10.1097/NEN.0b013e31816fc9d4. ( ) [DOI] [PubMed] [Google Scholar]
- Jenkins H. G., Bachelard H. S. Developmental and age-related changes in rat brain glycosaminoglycans. J. Neurochem. 1988;51:1634–1640. doi: 10.1111/j.1471-4159.1988.tb01134.x. ( ) [DOI] [PubMed] [Google Scholar]
- Katayama Y., Kawamata T. Edema fluid accumulation within necrotic brain tissue as a cause of the mass effect of cerebral contusion in head trauma patients. Acta Neurochir. Suppl. 2003;86:323–327. doi: 10.1007/978-3-7091-0651-8_69. [DOI] [PubMed] [Google Scholar]
- Kawamata T., Katayama Y. Surgical management of early massive edema caused by cerebral contusion in head trauma patients. Acta Neurochir. Suppl. 2006;96:3–6. doi: 10.1007/3-211-30714-1_1. ( ) [DOI] [PubMed] [Google Scholar]
- Kawamata T., Mori T., Sato S., Katayama Y. Tissue hyperosmolality and brain edema in cerebral contusion. Neurosurg. Focus. 2007;22:5. doi: 10.3171/foc.2007.22.5.6. ( ) [DOI] [PubMed] [Google Scholar]
- Klatzo I. Presidental address. Neuropathological aspects of brain edema. J. Neuropathol. Exp. Neurol. 1967;26:1–14. doi: 10.1097/00005072-196701000-00001. ( ) [DOI] [PubMed] [Google Scholar]
- Koppe G., Bruckner G., Brauer K., Hartig W., Bigl V. Developmental patterns of proteoglycan-containing extracellular matrix in perineuronal nets and neuropil of the postnatal rat brain. Cell Tissue Res. 1997;288:33–41. doi: 10.1007/s004410050790. ( ) [DOI] [PubMed] [Google Scholar]
- Kurbel S. Are extracellular osmolality and sodium concentration determined by Donnan effects of intracellular protein charges and of pumped sodium. J. Theor. Biol. 2008;252:769–772. doi: 10.1016/j.jtbi.2008.02.022. ( ) [DOI] [PubMed] [Google Scholar]
- Kuroiwa T., Miyasaka N., Fengyo Z., Yamada I., Nakane M., Nagaoka T., Tamura A., Ohno K. Experimental ischemic brain edema: morphological and magnetic resonance imaging findings. Neurosurg. Focus. 2007;22(5) doi: 10.3171/foc.2007.22.5.12. ( ) [DOI] [PubMed] [Google Scholar]
- Lai W. M., Hou J. S., Mow V. C. A triphasic theory for the swelling and deformation behaviors of articular cartilage. J. Biomech. Eng. 1991;113:245–258. doi: 10.1115/1.2894880. ( ) [DOI] [PubMed] [Google Scholar]
- Lander A. D. Proteoglycans in the nervous system. Curr. Opin. Neurobiol. 1993;3:716–723. doi: 10.1016/0959-4388(93)90143-M. ( ) [DOI] [PubMed] [Google Scholar]
- Langlois J. A., Rutland-Brown W., Wald M. M. The epidemiology and impact of traumatic brain injury: a brief overview. J. Head Trauma Rehabil. 2006;21:375–378. doi: 10.1097/00001199-200609000-00001. ( ) [DOI] [PubMed] [Google Scholar]
- Liang D., Bhatta S., Gerzanich V., Simard J. M. Cytotoxic edema: mechanisms of pathological cell swelling. Neurosurg. Focus. 2007;22(5) doi: 10.3171/foc.2007.22.5.3. ( ) [DOI] [PMC free article] [PubMed] [Google Scholar]
- Lu Y. B., et al. Viscoelastic properties of individual glial cells and neurons in the CNS. Proc. Natl Acad. Sci. USA. 2006;103:17 759–17 764. doi: 10.1073/pnas.0606150103. ( ) [DOI] [PMC free article] [PubMed] [Google Scholar]
- Lu X. L., Miller C., Chen F. H., Guo X. E., Mow V. C. The generalized triphasic correspondence principle for simultaneous determination of the mechanical properties and proteoglycan content of articular cartilage by indentation. J. Biomech. 2007;40:2434–2441. doi: 10.1016/j.jbiomech.2006.11.015. ( ) [DOI] [PubMed] [Google Scholar]
- Maeda T., Katayama Y., Kawamata T., Koyama S., Sasaki J. Ultra-early study of edema formation in cerebral contusion using diffusion MRI and ADC mapping. Acta Neurochir. Suppl. 2003;86:329–331. doi: 10.1007/978-3-7091-0651-8_70. [DOI] [PubMed] [Google Scholar]
- Marchi N., Betto G., Fazio V., Fan Q., Ghosh C., Machado A., Janigro D. Blood-brain barrier damage and brain penetration of antiepileptic drugs: role of serum proteins and brain edema. Epilepsia. 2009;50:664–677. doi: 10.1111/j.1528-1167.2008.01989.x. ( ) [DOI] [PMC free article] [PubMed] [Google Scholar]
- Margolis R. U., Margolis R. K., Chang L. B., Preti C. Glycosaminoglycans of brain during development. Biochemistry. 1975;14:85–88. doi: 10.1021/bi00672a014. ( ) [DOI] [PubMed] [Google Scholar]
- Margolis R. K., Preti C., Lai D., Margolis R. U. Developmental changes in brain glycoproteins. Brain Res. 1976;112:363–369. doi: 10.1016/0006-8993(76)90290-0. ( ) [DOI] [PubMed] [Google Scholar]
- Margolis R. K., Thomas M. D., Crockett C. P., Margolis R. U. Presence of chondroitin sulfate in the neuronal cytoplasm. Proc. Natl Acad. Sci. USA. 1979;76:1711–1715. doi: 10.1073/pnas.76.4.1711. ( ) [DOI] [PMC free article] [PubMed] [Google Scholar]
- Marmarou A. A review of progress in understanding the pathophysiology and treatment of brain edema. Neurosurg. Focus. 2007;22:5. doi: 10.3171/foc.2007.22.5.2. ( ) [DOI] [PubMed] [Google Scholar]
- Marmarou A., Signoretti S., Aygok G., Fatouros P., Portella G. Traumatic brain edema in diffuse and focal injury: cellular or vasogenic? Acta Neurochir. Suppl. 2006a;96:24–29. doi: 10.1007/3-211-30714-1_6. ( ) [DOI] [PubMed] [Google Scholar]
- Marmarou A., Signoretti S., Fatouros P. P., Portella G., Aygok G. A., Bullock M. R. Predominance of cellular edema in traumatic brain swelling in patients with severe head injuries. J. Neurosurg. 2006b;104:720–730. doi: 10.3171/jns.2006.104.5.720. ( ) [DOI] [PubMed] [Google Scholar]
- Mongin A. A. Disruption of ionic and cell volume homeostasis in cerebral ischemia: the perfect storm. Pathophysiology. 2007;14:183–193. doi: 10.1016/j.pathophys.2007.09.009. ( ) [DOI] [PMC free article] [PubMed] [Google Scholar]
- Mow V. C., Kuei S. C., Lai W. M., Armstrong C. G. Biphasic creep and stress relaxation of articular cartilage in compression? Theory and experiments. J. Biomech. Eng. 1980;102:73–84. doi: 10.1115/1.3138202. ( ) [DOI] [PubMed] [Google Scholar]
- Neprasova H., Anderova M., Petrik D., Vargova L., Kubinova S., Chvatal A., Sykova E. High extracellular K(+) evokes changes in voltage-dependent K(+) and Na (+) currents and volume regulation in astrocytes. Pflugers Arch. 2007;453:839–849. doi: 10.1007/s00424-006-0151-9. ( ) [DOI] [PubMed] [Google Scholar]
- Nguyen M. K., Kurtz I. Quantitative interrelationship between Gibbs-Donnan equilibrium, osmolality of body fluid compartments, and plasma water sodium concentration. J. Appl. Physiol. 2006;100:1293–1300. doi: 10.1152/japplphysiol.01274.2005. ( ) [DOI] [PubMed] [Google Scholar]
- Olivecrona M., Rodling-Wahlstrom M., Naredi S., Koskinen L. O. Effective ICP reduction by decompressive craniectomy in patients with severe traumatic brain injury treated by an ICP-targeted therapy. J. Neurotrauma. 2007;24:927–935. doi: 10.1089/neu.2005.356E. ( ) [DOI] [PubMed] [Google Scholar]
- Osada T., Tomita M., Tanahashi N., Takeda H., Nagai T., Suzuki N. Astroglial swelling for removed rat brain enlargement incubated in deoxygenated mock cerebrospinal fluid. Clin. Hemorheol. Microcirc. 2006;34:223–226. [PubMed] [Google Scholar]
- Overbeek J. T. The Donnan equilibrium. Prog. Biophys. Biophys. Chem. 1956;6:57–84. [PubMed] [Google Scholar]
- Papadopoulos M. C., Binder D. K., Verkman A. S. Enhanced macromolecular diffusion in brain extracellular space in mouse models of vasogenic edema measured by cortical surface photobleaching. FASEB J. 2005;19:425–427. doi: 10.1096/fj.04-2834fje. [DOI] [PubMed] [Google Scholar]
- Pombo C. M., Tsujita T., Kyriakis J. M., Bonventre J. V., Force T. Activation of the Ste20-like oxidant stress response kinase-1 during the initial stages of chemical anoxia-induced necrotic cell death. Requirement for dual inputs of oxidant stress and increased cytosolic [Ca2+] J. Biol. Chem. 1997;272:29 372–29 379. doi: 10.1074/jbc.272.46.29372. ( ) [DOI] [PubMed] [Google Scholar]
- Prange M. T., Margulies S. S. Regional, directional, and age-dependent properties of the brain undergoing large deformation. J. Biomech. Eng. 2002;124:244–252. doi: 10.1115/1.1449907. ( ) [DOI] [PubMed] [Google Scholar]
- Raslan A., Bhardwaj A. Medical management of cerebral edema. Neurosurg. Focus. 2007;22(5) doi: 10.3171/foc.2007.22.5.13. ( ) [DOI] [PubMed] [Google Scholar]
- Sames K., Hoyer S. Age-related histochemical staining patterns of glycosaminoglycans in cell nuclei of different regions of the rat brain: a pilot study. Arch. Gerontol. Geriatr. 1992;14:75–84. doi: 10.1016/0167-4943(92)90008-R. ( ) [DOI] [PubMed] [Google Scholar]
- Sherman L. S., Back S. A. A ‘GAG’ reflex prevents repair of the damaged CNS. Trends Neurosci. 2008;31:44–52. doi: 10.1016/j.tins.2007.11.001. ( ) [DOI] [PubMed] [Google Scholar]
- Shigemori Y., Katayama Y., Mori T., Maeda T., Kawamata T. Matrix metalloproteinase-9 is associated with blood–brain barrier opening and brain edema formation after cortical contusion in rats. Acta Neurochir. Suppl. 2006;96:130–133. doi: 10.1007/3-211-30714-1_29. ( ) [DOI] [PubMed] [Google Scholar]
- Simard J. M., Kent T. A., Chen M., Tarasov K. V., Gerzanich V. Brain oedema in focal ischaemia: molecular pathophysiology and theoretical implications. Lancet Neurol. 2007;6:258–268. doi: 10.1016/S1474-4422(07)70055-8. ( ) [DOI] [PMC free article] [PubMed] [Google Scholar]
- Stocchetti N., Colombo A., Ortolano F., Videtta W., Marchesi R., Longhi L., Zanier E. R. Time course of intracranial hypertension after traumatic brain injury. J. Neurotrauma. 2007;24:1339–1346. doi: 10.1089/neu.2007.0300. ( ) [DOI] [PubMed] [Google Scholar]
- Sun D. D., Guo X. E., Likhitpanichkul M., Lai W. M., Mow V. C. The influence of the fixed negative charges on mechanical and electrical behaviors of articular cartilage under unconfined compression. J. Biomech. Eng. 2004;126:6–16. doi: 10.1115/1.1644562. ( ) [DOI] [PubMed] [Google Scholar]
- Taya K., Gulsen S., Okuno K., Prieto R., Marmarou C. R., Marmarou A. Modulation of AQP4 expression by the selective V1a receptor antagonist, SR49059, decreases trauma-induced brain edema. Acta Neurochir. Suppl. 2008;102:425–429. doi: 10.1007/978-3-211-85578-2_83. ( ) [DOI] [PubMed] [Google Scholar]
- Tomita M., Gotoh F. Cascade of cell swelling: thermodynamic potential discharge of brain cells after membrane injury. Am. J. Physiol. 1992;262:H603–H610. doi: 10.1152/ajpheart.1992.262.2.H603. [DOI] [PubMed] [Google Scholar]
- Tomita M., Gotoh F., Sato T., Yamamoto M., Amano T., Tanahashi N., Tanaka K. Determination of the osmotic potential for swelling of cat brain in vitro. Exp. Neurol. 1979;65:66–70. doi: 10.1016/0014-4886(79)90248-6. ( ) [DOI] [PubMed] [Google Scholar]
- Tomita M., Gotoh F., Kobari M. Colloid osmotic pressure of cat brain homogenate separated from autogenous CSF by a copper ferrocyanide membrane. Brain Res. 1988;474:165–173. doi: 10.1016/0006-8993(88)90679-8. ( ) [DOI] [PubMed] [Google Scholar]
- Unterberg A. W., Stover J., Kress B., Kiening K. L. Edema and brain trauma. Neuroscience. 2004;129:1021–1029. doi: 10.1016/j.neuroscience.2004.06.046. ( ) [DOI] [PubMed] [Google Scholar]
- van Pul C., Jennekens W., Nicolay K., Kopinga K., Wijn P. F. Ischemia-induced ADC changes are larger than osmotically-induced ADC changes in a neonatal rat hippocampus model. Magn. Reson. Med. 2005;53:348–355. doi: 10.1002/mrm.20353. ( ) [DOI] [PubMed] [Google Scholar]
- Vorisek I., Hajek M., Tintera J., Nicolay K., Sykova E. Water ADC, extracellular space volume, and tortuosity in the rat cortex after traumatic injury. Magn. Reson. Med. 2002;48:994–1003. doi: 10.1002/mrm.10305. ( ) [DOI] [PubMed] [Google Scholar]
- Wang Q., Zheng Y. P., Niu H. J., Mak A. F. Extraction of mechanical properties of articular cartilage from osmotic swelling behaviour monitored using high frequency ultrasound. J. Biomech. Eng. 2007;129:413–422. doi: 10.1115/1.2720919. ( ) [DOI] [PubMed] [Google Scholar]
- Wang Q., Zheng Y. P., Leung G., Lam W. L., Guo X., Lu H. B., Qin L., Mak A. F. Altered osmotic swelling behavior of proteoglycan-depleted bovine articular cartilage using high frequency ultrasound. Phys. Med. Biol. 2008;53:2537–2552. doi: 10.1088/0031-9155/53/10/006. ( ) [DOI] [PubMed] [Google Scholar]
- Ware M. L., Nemani V. M., Meeker M., Lee C., Morabito D. J., Manley G. T. Effects of 23.4% sodium chloride solution in reducing intracranial pressure in patients with traumatic brain injury: a preliminary study. Neurosurgery. 2005;57:727–736. doi: 10.1227/01.NEU.0000175726.08903.0A. ( ) [DOI] [PubMed] [Google Scholar]
- Werner C., Engelhard K. Pathophysiology of traumatic brain injury. Br. J. Anaesth. 2007;99:4–9. doi: 10.1093/bja/aem131. ( ) [DOI] [PubMed] [Google Scholar]
- Yates A. J., Thelmo W., Pappius H. M. Postmorten changes in the chemistry and histology of normal and edematous brains. Am. J. Pathol. 1975;79:555–564. [PMC free article] [PubMed] [Google Scholar]
- Young W., Decrescito V., Flamm E. S., Hadani M., Rappaport H., Cornu P. Tissue Na, K, and Ca changes in regional cerebral ischemia: their measurement and interpretation. Cent. Nerv. Syst. Trauma. 1986;3:215–234. doi: 10.1089/cns.1986.3.215. [DOI] [PubMed] [Google Scholar]
- Young W., Rappaport Z. H., Chalif D. J., Flamm E. S. Regional brain sodium, potassium, and water changes in the rat middle cerebral artery occlusion model of ischemia. Stroke. 1987;18:751–759. doi: 10.1161/01.str.18.4.751. [DOI] [PubMed] [Google Scholar]